Supplementary Information
The Role of L-Proline and Co-Catalysts in the Enantioselectivity of OXA-Michael-Henry Reactions
Lucas F. do Carmo,
aSimone C. Silva,
aMatheus V. Machado,
aPaloma S. Prata,
cAlberto Wisniewski Júnior,
cDiogo M. Vidal
band José Augusto F. P. Villar *
,aa
Laboratório de Síntese Orgânica e NanoEstruturas, Universidade Federal de São João Del-Rei, Campus Centro-Oeste Dona Lindu, Rua Sebastião Gonçalves Coelho, 400,
35501-296 Divinópolis-MG, Brazil
b
Universidade Federal de Minas Gerais, Campus Belo Horizonte,
Av. Pres. Antônio Carlos, 6627, Pampulha, 31270-901 Belo Horizonte-MG, Brazil
c
Grupo de Pesquisa em Petróleo e Energia da Biomassa (PEB), Departamento de Química, Universidade Federal de Sergipe, Rodovia Marechal Randon, s/n, Jardim Rosa Elze,
49100-000 São Cristóvão-SE, Brazil
Materials and methods
Reagents and solvents were purchased as reagent grade and used without further purification. All nuclear magnetic resonance (NMR) data were acquired in CDCl3 or DMSO-d6 on a Bruker AVANCE 400 NMR spectrometer, observing 1H and 13C at 400.13 and 100.61 MHz, respectively, or Bruker DRX 200 NMR spectrometer, observing 1H and 13C at 200.13 and 50.3 MHz, respectively. The spectrometers were equipped with a 5-mm multinuclear direct detection probe with z-gradient. All 1H and 13C NMR chemical shifts are given in ppm () relative to the tetramethylsilane (TMS) signal at 0.00 ppm as internal reference and the coupling constants (J) are in Hz. Thin layer chromatography (TLC) was performed using silica gel GF254, 0.25 mm thickness. For visualization, TLC plates were either placed under ultraviolet light, stained with iodine vapor or acidic vanillin. HPLC analysis was performed in a Shimadzu Prominence liquid chromatography, equipped with a LC-20AT pump, SPD-M20A Photodiode Array detector, SIL-20A automatic injector and a Shim-pack C-18 VPODS 4.6_250 mm 5 lm reverse phase column. Chiral column model Astec Cellulose DMP with 4.6 mm × 25 cm and particle diameter of 5 μm. The solvents were purified according to standard procedures.
___________________________________
*e-mail: [email protected]
Characterization data for compound 1
Diethyl-L-proline (compound 1a)
In a 50 mL flask was added 1.15 g of L-proline and 4.5 g of K2CO3 in 20 mL of ACN. Then 2.3 mL of ethyl bromide was also added in the reaction. The reaction was maintained under stirring and heating at 40 °C overnight.
After the time and monitoring of product formation by CCD (MeOH:EtOAc 1:10), 30 mL of H2O and (3×) 30 mL of EtOAc were added to extract the organic phase, dried with Na2SO4 and concentrated in vacuum. The product obtained was a yellow liquid in 90% yield; 1H NMR (200 MHz, CDCl3) δ 4.20 (q, J 7.1 Hz, 2H), 3.11-3.28 (m, 2H), 2.69-2.82 (m, 1H), 2.30-2.56 (m, 2H), 1.80-2.16 (m, 4H), 1.27 (t, J 7.1 Hz, 3H), 1.13 (t, J 7.0 Hz, 3H); 13C NMR (50 MHz, CDCl3) δ 174.18, 65.99, 60.70, 53.23, 48.85, 29.49, 23.07, 14.36, 13.66.
Zn[L-proline]2 (compound 1b)2,3
The zinc amino acid complex was prepared in 50 mL flask by addition of 0.6 mL triethylamine and 4.34 mmol L-proline in 10 mL MeOH. After 10 min, 2.17 mmol of zinc acetate was added in the mixture. The reaction was kept
under stirring and RT. After stirring for 45 min a white precipitate formed and was collected by filtration to give a 95%
yield; 1H NMR (200 MHz, CDCl3) δ 3.8 (m, 2H), 3.2-3.0 (m, 4H), 2.2-1.8 (m, 8H); 13C NMR (50 MHz, CDCl3) δ 185.7, 60.9, 47.4, 30.0, 25.7.
L-Prolinol (compound 1c)4
In round-bottomed flask and two 21-well shakers, coupled with reflux condenser was added 8.75 g of proline, 6.92 g of NaBH4. It was transferred 200 mL of THF by siphoning, avoiding the contact of the solvent with the humidity.
After, a 19.3 g solution of iodine (I2) in 50 mL of THF was prepared. The transfer was done with the aid of an addition funnel coupled to the mouth of the flask. The reaction was placed in a 0 °C ice bath and iodine solution was added in small aliquots for 30 min. After reaction with iodine and complete formation of the hydrogen gas, the reaction was subjected to heating (approx. 40 °C) and the condenser was coupled to a water reflux pump, porcelain pieces were also added into the flask and kept under stirring overnight. After 18 h we let the reaction cool to room temperature and stirred methanol carefully until the mixture becomes clear. After stirring for 30 min, the solvent was removed by rotary evaporator, leaving a white liquid. After the elapsed time, 150 mL of 20% KOH solution was added under the white liquid and the reaction was allowed to stir for 4 h. The organic phase was extracted 3× with CH2Cl2, dried with Na2SO4 and concentrated by spin evaporator to give a yellowish liquid in 85% yield. 1H NMR (200 MHz, CDCl3) δ 4.41 (s,
1H), 4.12 (dd, J 3.1 and 11.4 Hz, 1H), 3.66 (dd, J 3.1 and 11.4 Hz, 1H), 3.29-3.43 (m, 1H), 2.79-3.09 (m, 2H), 1.76- 2.09 (m, 4H).
References
1. Karthikeyan, T.; Sankararaman, S.; Tetrahedron: Asymmetry 2008, 19, 2741.
2. Darbre, T.; Machuqueiro, M.; Chem. Commun. 2003, 1090.
3. Zeba, N.; Siddiqui, Z. N.; Farooq, F.; Catal. Sci. Technol. 2011, 1, 810.
4. McKennon, M. J.; Meyers, A. I.; Karlheinz Drauz, K.; Schwarm, M.; J. Org. Chem. 1993, 58, 3568.
Spectra of compounds
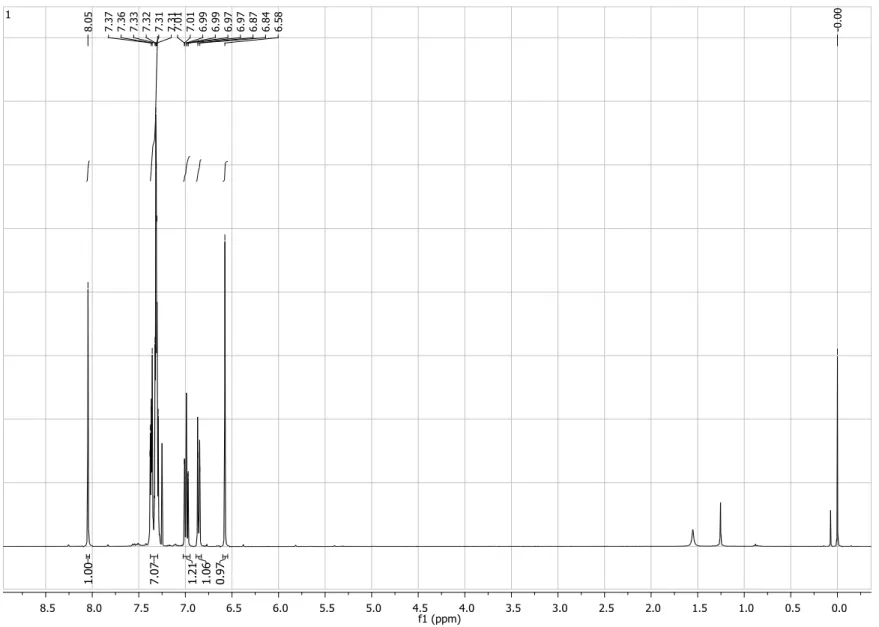
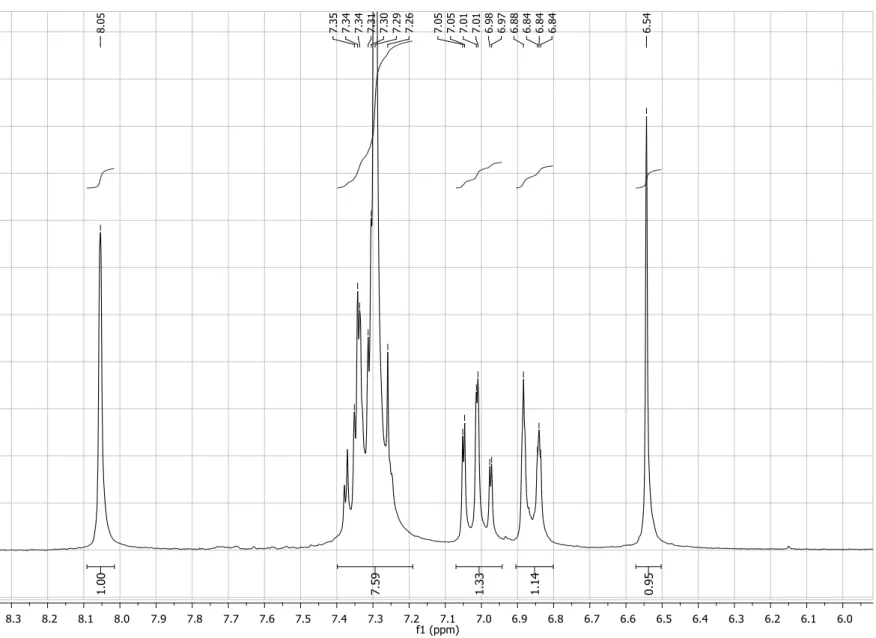
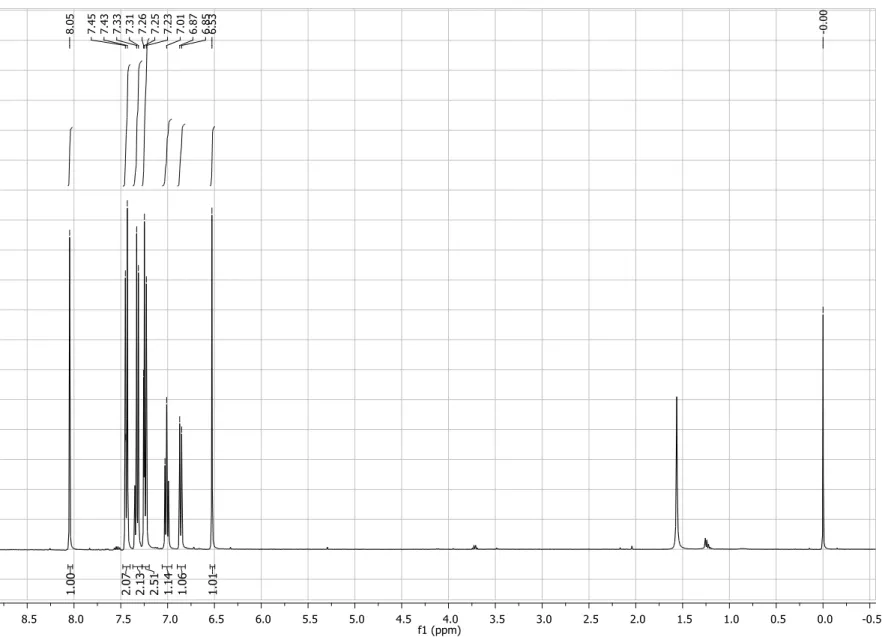
Figure S1. 1H NMR spectrum (200 MHz, CDCl3) of compound 4.
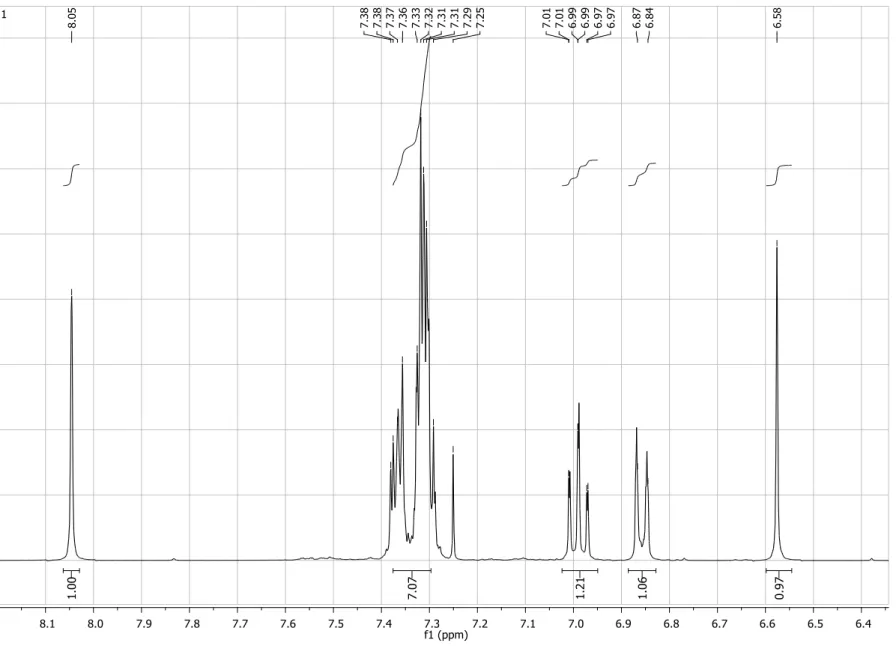
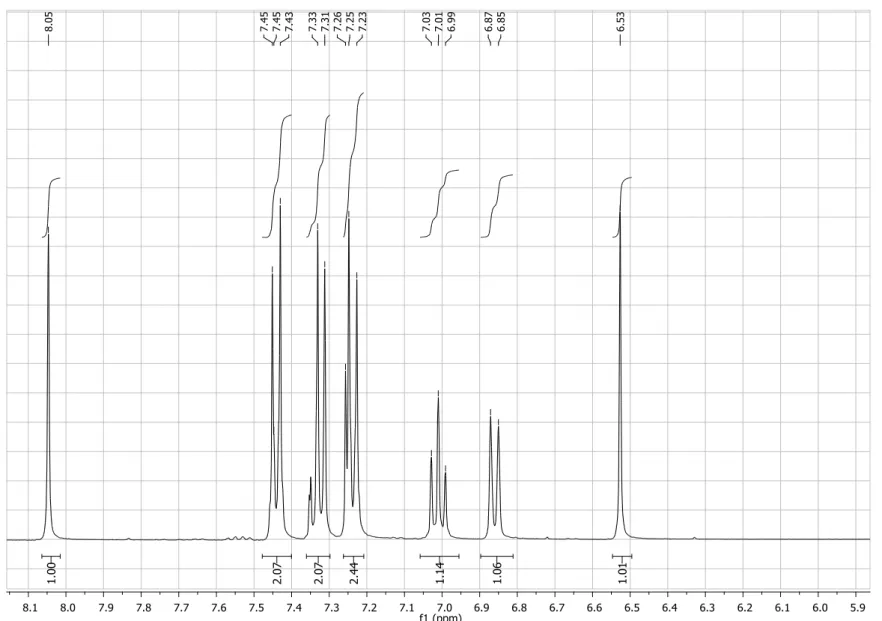
Figure S2. Expansion of 1H NMR spectrum (200 MHz, CDCl3) of compound 4.
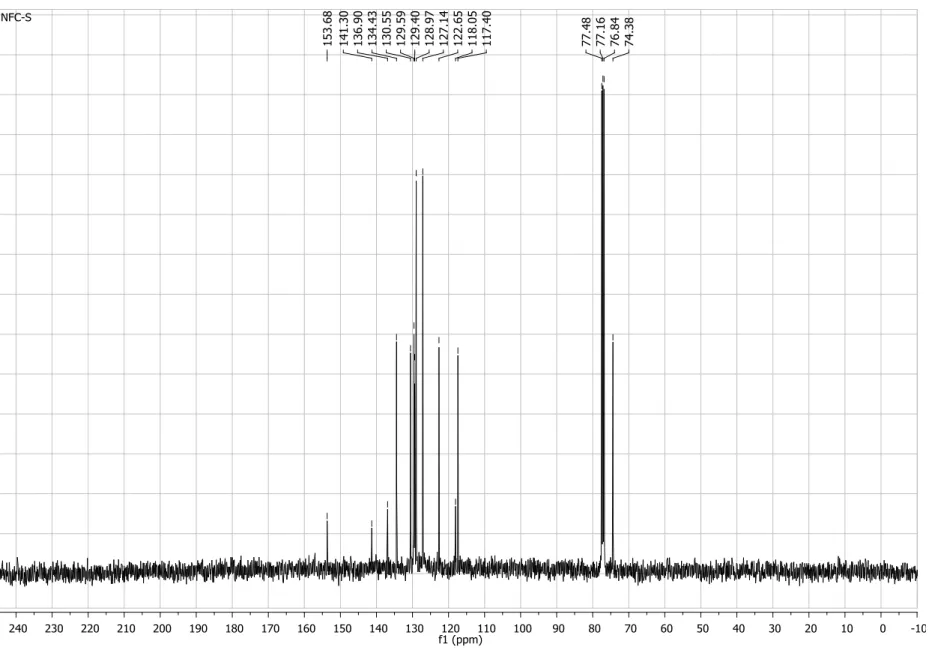
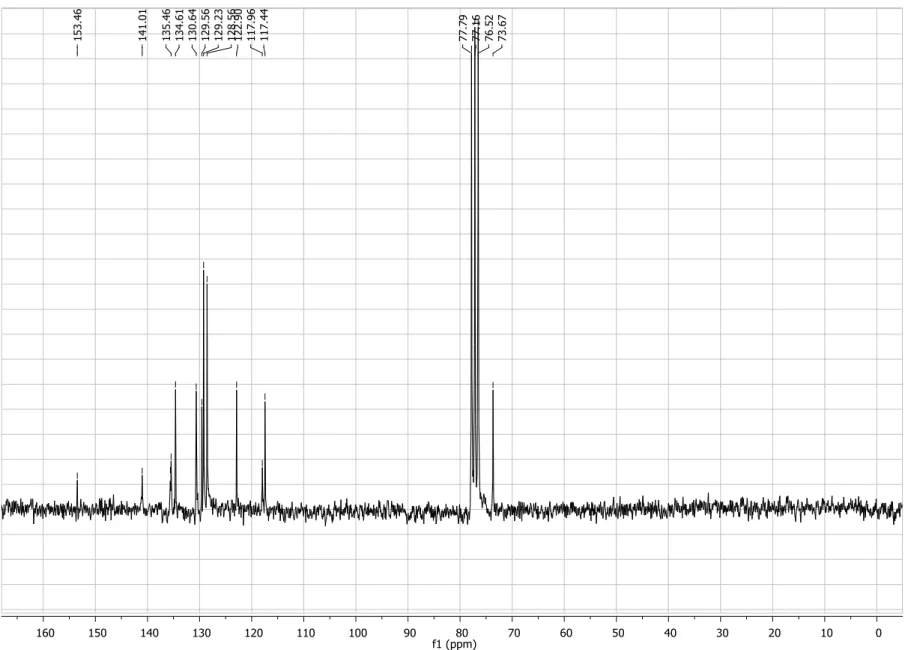
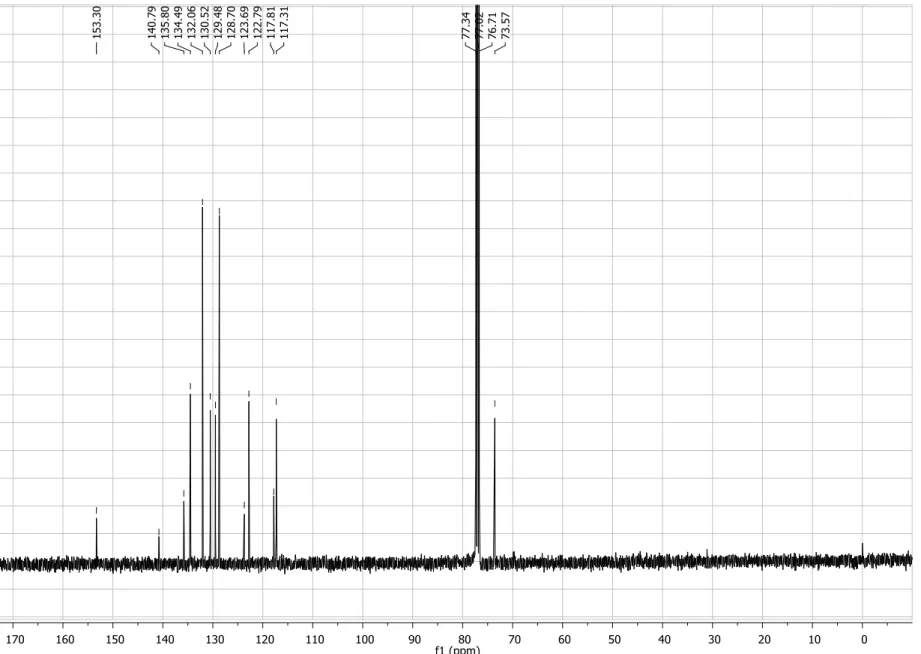
Figure S3. 13C NMR spectrum (50 MHz, CDCl3) of compound 4.
Figure S4. 1H NMRspectrum (200 MHz, CDCl3) of compound 4a.
Figure S5. Expansion of 1H NMRspectrum (200 MHz, CDCl3) of compound 4a.
Figure S6. 13C NMRspectrum (50 MHz, CDCl3) of compound 4a.
Figure S7. 1H NMRspectrum (400 MHz, CDCl3) of compound 4b.
Figure S8. Expansion of 1H NMRspectrum (400 MHz, CDCl3) of compound 4b.
Figure S9. 13C NMRspectrum (100 MHz, CDCl3) of compound 4b.
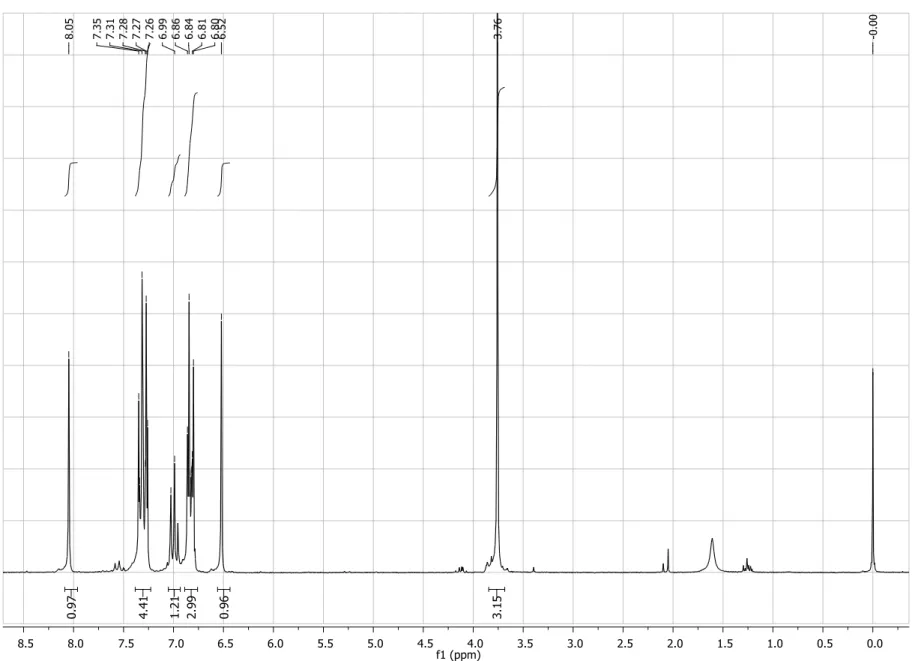
Figure S10. 1H NMR spectrum (200 MHz, CDCl3) of compound 4c.
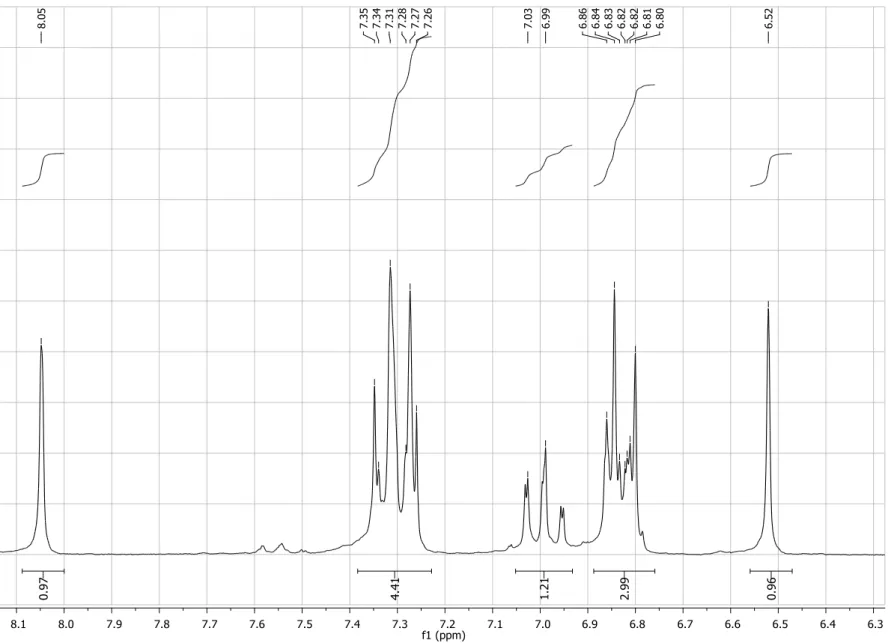
Figure S11. Expansion of 1H NMRspectrum (200 MHz, CDCl3) of compound 4c.
Figure S12. 13C NMR spectrum (50 MHz, CDCl3) of compound 4c.
Figure S13. 1H NMR spectrum (400 MHz, CDCl3) of compound 4d.
Figure S14. Expansion of 1H NMR spectrum (400 MHz, CDCl3) of compound 4d.
Figure S15. 13C NMR spectrum (100 MHz, CDCl3) of compound 4d.
Figure S16. Expansion of 13C NMR spectrum (100 MHz, CDCl3) of compound 4d.
Figure S17. 13C DEPT 135 NMR spectrum (100 MHz, CDCl3) of compound 4d.
Figure S18. 1H NMR spectrum (200 MHz, CDCl3) of compound 4e.
Figure S19. Expansion of 1H NMR spectrum (200 MHz, CDCl3) of compound 4e.
Figure S20. 13C NMR spectrum (50 MHz, CDCl3) of compound 4e.
Figure S21. 1H NMR spectrum (200 MHz, CDCl3) of compound 1a.
Figure S22. Expansion of 1H NMR spectrum (200 MHz, CDCl3) of compound 1a.
Figure S23. 13C NMR spectrum (50 MHz, CDCl3) of compound 1a.
Figure S24. 1H NMR spectrum (200 MHz, D2O) of compound 1b.
ID# Ret. Time Area Height Area%
1 10.554 6450405 520550 49.7691 2 11.455 6510251 499835 50.2309
Figure S25. HPLC of racemic compound 4.
ID# Ret. Time Area Height Area%
1 10.536 455232 38976 22.5210 2 11.367 1566133 117976 77.4790
Figure S26. HPLC of 55% ee compound 4.
ID# Ret. Time Area Height Area%
1 10.524 162280 14496 14.7232 2 11.171 939931 73629 85.2768
Figure S27. HPLC of 70% ee compound 4.
ID# Ret. Time Area Height Area%
1 11.788 293773 23161 19.8168 2 12.091 1188676 89073 80.1832 Figure S28. HPLC of 60% ee compound 4a.
ID# Ret. Time Area Height Area%
1 12.592 1195947 110811 25.0504 2 12.751 255546 255546 74.9496
Figure S29. HPLC of 50% ee compound 4b.
ID# Ret. Time Area Height Area%
1 11.340 161921 12962 14.7023 2 11.986 939410 61535 85.2977 Figure S30. HPLC of 70% ee compound 4c.
ID# Ret. Time Area Height Area%
1 10.347 1250956 117367 19.5024 2 10.783 5163422 421160 80.4976 Figure S31. HPLC of 61% ee compound 4d.
ID# Ret. Time Area Height Area%
1 10.903 3205356 270512 21.4197 2 11.651 117599161 907486 78.5803 Figure S32. HPLC of 57% ee compound 4e (note: 40 °C).
NFC-S (12)_20ppm #335-475 RT:11.13-12.35 AV:141 SB:140 0.04-1.26 NL:5.73E7 T:FTMS + p ESI Full ms [150.0000-1000.0000]
249 250 251 252 253 254 255 256 257 258 259
m/z 0
5 10 15 20 25 30 35 40 45 50 55 60 65 70 75 80 85 90 95 100
Relative Abundance
254.08113 C15H12O3N
10.5 RDBE -0.14005 ppm
252.06557 C15H10O3N
11.5 RDBE 0.18227 ppm
255.08446 C1413C H12O3N
10.5 RDBE -0.26165 ppm 253.06891
C1413C H10O3N 11.5 RDBE 0.12296 ppm 250.06866
C1813C2H8 17.0 RDBE -0.41984 ppm
256.08809 C19H12O 14.0 RDBE -0.69018 ppm 251.07202
C1713C3H8 17.0 RDBE -0.37587 ppm
258.08420 C1513C H12O N Na
11.0 RDBE -1.04172 ppm 254.70305
253.80488
Figure S33. HRMS (ESI+) of compound 4.
4CINFC-S (13)_20ppm #307-448 RT:7.48-8.71 AV: 142 SB:129 0.03-1.15 NL:5.10E7 T:FTMS + p ESI Full ms [150.0000-1000.0000]
287.0 287.5 288.0 288.5 289.0 289.5 290.0 290.5 291.0 291.5 292.0 292.5
m/z 0
5 10 15 20 25 30 35 40 45 50 55 60 65 70 75 80 85 90 95 100
Relative Abundance
288.04203 C15H11O3N Cl
10.5 RDBE -0.57278 ppm
290.03902 C15H11O3N37Cl
10.5 RDBE -0.78537 ppm 289.04533
C1413C H11O3N Cl 10.5 RDBE
-0.77163 ppm 291.04229
C1413C H11O3N37Cl 10.5 RDBE -1.08574 ppm
292.04592 290.26881
287.90553 288.17296 288.84144 289.16207 289.90679 291.27181
Figure S34. HRMS (ESI+) of compound 4a.
4-BrNFC-S (19)_10ppm #314-459 RT: 9.66-10.92 AV:146 SB: 146 0.03-1.29 NL: 6.47E6 T:FTMS + p ESI Full ms [150.0000-1000.0000]
331.5 332.0 332.5 333.0 333.5 334.0 334.5 335.0 335.5
m/z 0
5 10 15 20 25 30 35 40 45 50 55 60 65 70 75 80 85 90 95 100
Relative Abundance
331.99146 C15H11O3N Br
10.5 RDBE -0.65839 ppm
333.98947 C15H11O3N81Br
10.5 RDBE -0.50404 ppm
332.99480 C1413C H11O3N Br
10.5 RDBE -0.72057 ppm
334.99275 C1413C H11O3N81Br
10.5 RDBE -0.72010 ppm
331.20896
332.90219
332.33115 333.23990 335.21897
331.88890
334.27361 335.49169
Figure S35. HRMS (ESI+) of compound 4b.
4OMeNFC-S (14)_10ppm #308-454 RT:16.98-18.26 AV:147 SB:132 0.07-1.21 NL:2.24E7 T:FTMS + p ESI Full ms [150.0000-1000.0000]
301 302 303 304 305 306 307 308 309 310 311
m/z 0
10 20 30 40 50 60 70 80 90 100
Relative Abundance
306.07365 C16H13O4N Na
10.5 RDBE -0.10960 ppm
307.07692 C1513C H13O4N Na
10.5 RDBE -0.35481 ppm
308.08055
302.07871 309.07319 311.05092
301.11845 304.92844
303.08207 C1613C H13O3N Na
11.5 RDBE
-0.16322 ppm 310.07659
305.80486 307.40097
306.83678
Figure S36. HRMS (ESI+) of compound 4c.
4FNFC-S (15)_10ppm #311-455 RT:14.91-16.17 AV:145 SB:145 0.06-1.32 NL:4.41E6 T:FTMS + p ESI Full ms [150.0000-1000.0000]
271.5 272.0 272.5 273.0 273.5 274.0 274.5 275.0 275.5 276.0 276.5
m/z 0
10 20 30 40 50 60 70 80 90 100
Relative Abundance
272.07157 C15H11O3N F
10.5 RDBE -0.65710 ppm
273.07489 C1413C H11O3N F
10.5 RDBE -0.78843 ppm
273.16697 274.07847 275.07119 276.04299
271.93085 272.88672 275.50244
272.25831 C16H34O2N
0.5 RDBE
-0.35974 ppm 274.50879 276.50018
271.42530 273.55746
Figure S37. HRMS (ESI+) of compound 4d.
2,3diClNFC-S (16)_10ppm #376-553 RT:17.64-19.18 AV:178 SB:120 0.10-1.14 NL:1.45E7 T:FTMS + p ESI Full ms [150.0000-1000.0000]
321.5 322.0 322.5 323.0 323.5 324.0 324.5 325.0 325.5 326.0 326.5 327.0
m/z 0
5 10 15 20 25 30 35 40 45 50 55 60 65 70 75 80 85 90 95 100
Relative Abundance
322.00323 C15H10O3N Cl2
10.5 RDBE 0.01876 ppm
324.00020 C15H10O3N Cl37Cl
10.5 RDBE -0.23994 ppm
323.00653 C1413C H10O3N Cl2
10.5 RDBE -0.15616 ppm
325.00351 C1413C H10O3N Cl37Cl
10.5 RDBE -0.36676 ppm
325.99720 C15H10O3N37Cl2
10.5 RDBE
-0.36959 ppm 327.00067 C1413C H10O3N37Cl2
10.5 RDBE -0.03406 ppm 325.16353
323.12459
321.84866 322.15769 324.86667
324.16556
323.84288 325.86654
322.64028
Figure S38. HRMS (ESI+) of compound 4e.