As we will see shortly, the US residential mortgage stock is now dominated by positions in market-based institutions, rather than traditional bank balance sheets. In other words, monetary policy tends to accentuate fluctuations in the size of financial intermediary balance sheets. To the extent that the financial system as a whole holds long-term, illiquid assets financed by short-term liabilities, any tensions resulting from a sharp, synchronized contraction of balance sheets will show up somewhere in the system.
Market-based holdings surpassed bank-based holdings in the early 1990s and now account for two-thirds of the total $11 trillion stock of home mortgages. The difference between the security's current market price and the price at which it is sold is called the repo "haircut" and fluctuates with market funding conditions. Even if some institutions can adjust their balance sheets flexibly, there will be bottlenecks in the system that will be exposed by deleveraging.

Macroeconomic consequences
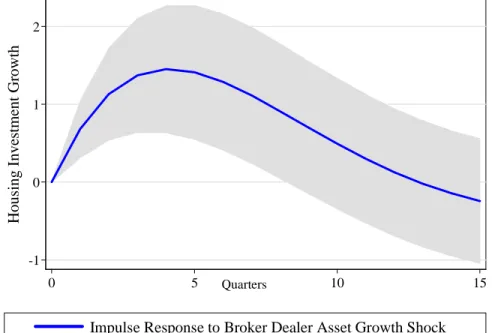
The balance sheets of brokers and dealers contain potentially more information about underlying financial conditions as they are an indication of the marginal availability of credit. The growth rate of the total assets of stockbrokers and dealers has the greatest significance for the growth rate of future housing investment and consumption of durable goods (Table 1, columns (iv) and (ii), respectively). The market value of brokers' and stockholders' equity also has predictive power for housing investment, but it additionally predicts the total.
The chart shows a response from housing investment to broker-dealer growth that is positive, large and sustained. Impulse response function of housing investment growth to a broker-dealer asset growth shock (in units of standard deviations). One way to do this is to first orthogonalize the growth of the commercial bank's total assets and the growth of its equity with respect to the broker-dealer variables, and then add the commercial bank variables that are unexplained by the broker-dealer variables to the regressions.
In Table 3, we run the same regressions as in Table 1, but with commercial bank variables instead of the security broker and dealer variables. Our interpretation of these findings is that the balance sheets of commercial banks are less informative than the balance sheets of brokers and dealers since they (mostly) have not marked their balance sheets to market over the time frame in our regressions. We now present some additional evidence of the impact of broker-dealer assets from vector autoregressions that capture the joint dynamics of macroeconomic variables, broker-dealer variables, and monetary policy.
The second VAR adds the broker-dealer variables to the macro variables, with the macro variables ordered before the financial institution variables. The fall in residential investment in response to an increase in the Fed funds target is both faster and larger in the VAR with the broker-dealer variables, compared to the base model.
Determination of broker-dealer balance sheets
The two response functions of Figure 8 again illustrate that balance sheet variables of financial institutions have quantitatively important effects. Financial market volatility, as measured by the VIX index of implied volatility, has a negative relationship to the growth of brokerage and dealer assets, as higher volatility is associated with higher margins and tighter capital constraints, both of which lead to tighter restrictions on dealer leverage. Credit spreads are positively related to dealer asset growth, as they represent the profitability of holding risky, illiquid assets with longer maturities.
Increases in the federal funds target (and expectations of a future target) tend to reduce broker-dealer balance sheets. extension to Fed funds) Macroeconomic conditions. Stock brokers actively trade, so it would be desirable to study their balance sheet behavior at higher frequencies. Fortunately, the Federal Reserve Bank of New York collects weekly data on so-called primary dealer funding.
In Table 5 we explain Primary Dealer repo loans by the same variables as in Table 4 (except for GDP and inflation which we have seen to be insignificant anyway, and which are not available at a weekly frequency). We use 13-week changes and lags in the regression, to pick up correlations that occur at the same frequency as the quarterly data. We again find the negative development of dealer balance sheets with changes in the Fed funds target, and we also uncover a positive relationship between dealer repos and the term spread.
Monetary Policy Reactions to Balance Sheet Changes
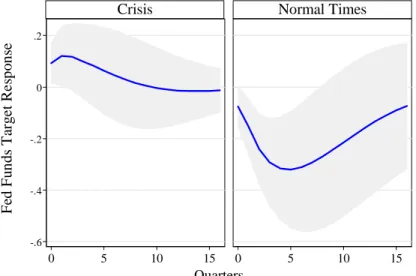
We find that monetary policy is procyclical relative to the balance sheets of brokers and dealers in normal times. In Figure 9, we show the impulse response function of the target Fed funds rate to a standard deviation shock to the growth rate of brokers' and securities dealers' assets. It may be that broker-dealer asset growth is important in a policy rule only because it reflects movements in asset prices that are helpful in predicting future macroeconomic variables.
Column (i) of Table 7 shows that the significance of growth in security broker-dealer assets is not affected when additional asset price controls are included in the regression. In column (ii) of Table 7, we first regress the growth of security broker-dealer assets on four lags of inflation and GDP growth, and then add the predicted value from that regression to the right-hand side of the policy rule regression. We see that both security broker assets and security broker-dealer asset values are explained by the past.
In column (iii) we do the reverse; we first subtract GDP and inflation growth from four slowdowns in stockbrokers and dealers growth, and add the predicted value of those regressions to the right-hand side. Security broker-dealer Total asset growth (annual percentage) Fed Funds Future (a year ahead, more than current). Stockbroker-dealer Total asset growth (annual percentage) Taylor rule residue (break down from Table 3, column (i)).
Security Broker-Dealer Total Capital Growth (percentage per annum) Remaining Taylor Rule (Specification from William Poole). One way we can visualize the policy response in determining the Fed Funds rate to the growth of the broker-dealer balance is to calculate the residual against a Taylor benchmark rule, and then plot the residual of the Taylor rule along with the series for the growth in broker-dealer assets.
Implications for Monetary Policy
When monetary policy is tightened at the end of an economic expansion, the slope of the yield curve becomes shallower and sometimes inverts. To the extent that financial intermediaries play a role in monetary policy transmission through credit supply, short-term interest rates have a direct impact on monetary policy. 13 Adrian and Estrella (2008) further examine the signaling value of the term spread for future macroeconomic outcomes in the context of monetary policy tightening.
Second, there is an argument for rehabilitating some role for balance sheet quantities in the implementation of monetary policy. Ironically, our call comes even as monetary aggregates have fallen from favor in the conduct of monetary policy (see Friedman (1988)). Finally, our results highlight the way monetary and financial stability policies are related.
When analyzing the interaction between financial stability and monetary policy in the time series of recent decades, it is important to note that the interaction of monetary policy and the provision of the lender of last resort has been successful in insulating the real economy from the problems of the financial sector. Thus, we can easily conclude that policies towards financial stability are more or less orthogonal to the analysis of monetary policy. In addition to the consequences for credit regulation, balance sheet dynamics imply the role of monetary policy in ensuring financial stability.
Contrary to the common perception that monetary policy and financial stability policies should be seen separately, they are inseparable. At the very least, there is a strong case for better coordination of monetary and financial stability policies.
Concluding Remarks
To put it in Bayesian language, when one analyzes the data (either via econometric or via structural approaches) with the assumption that monetary policy and financial stability are orthogonal, one runs the risk of confirming this assumption all too easily. The events of the past 12 months have clearly shown that now is the right time to reset the past and rethink the monetary policy transmission mechanism in a market-based financial system. Growing and declining balance sheets both have a monetary policy dimension in terms of regulating aggregate demand, but it has the decisive dimension of ensuring the stability of the financial system.
Monetary policy and financial stability policy are therefore two sides of the same coin. Bean, Charles (2003) “Asset Prices, Financial Imbalances and Monetary Policy: Are Inflation Targets Enough?” in Asset Prices and Monetary Policy, ed. Bernanke, Ben and Mark Gertler (1995) "Inside the Black Box: The Credit Channel of Monetary Policy Transmission", Journal of Economic Perspectives 9, p.
Bordo, Michael and Olivier Jeanne (2002) “Monetary Policy and Asset Prices: Does Benign Neglect Make Sense?” International Finance 5, pp.139-164. The Implications of Evolving Policy Regimes," Proceedings of the Federal Reserve Bank of Kansas City Symposium at Jackson Hole 2003. The Implications of Evolving Policy Regimes," Proceedings of the Federal Reserve Bank of Kansas City Symposium at Jackson Hole, 2003.
Kohn, Donald (2005) "Commentary: Has financial development made the world riskier?" Proceedings of the Federal Reserve Bank of Kansas City Symposium at Jackson Hole, 2005. Shin, Hyun Song (2005) "Commentary: Has financial development made the world riskier?" Proceedings of the Federal Reserve Bank of Kansas City Symposium in Jackson Hole, 2005.