Esta tese de doutorado foi desenvolvida com o objetivo de elucidar alguns aspectos relacionados ao valor prognóstico do pulso máximo de oxigênio (O2p) e ao comportamento da curva O2p durante exercício máximo progressivo. Então, de acordo com a equação de Fick (Wasserman et al., 2004), temos isso. Munhoz et al., 2007), também submeteram 87 pacientes à cintilografia miocárdica e ao TCPE com o objetivo de comparar a resposta da curva O2p durante exercício máximo progressivo em pacientes com e sem isquemia.
Até onde sabemos, no momento desta tese, apenas três estudos (Cohen-Solal et al., 1997; Lavie et al., 2004; Laukkanen et al., 2006) tiveram como objetivo avaliar o valor prognóstico do O2p Máximo. . Cohen-Solal e Carl Lavie investigaram o valor prognóstico do O2p em indivíduos com insuficiência cardíaca, mas apresentaram resultados conflitantes. Lavie et al., 2004) mostraram em uma análise multivariada de Cox que o O2p máximo foi o melhor preditor independente de eventos clínicos.
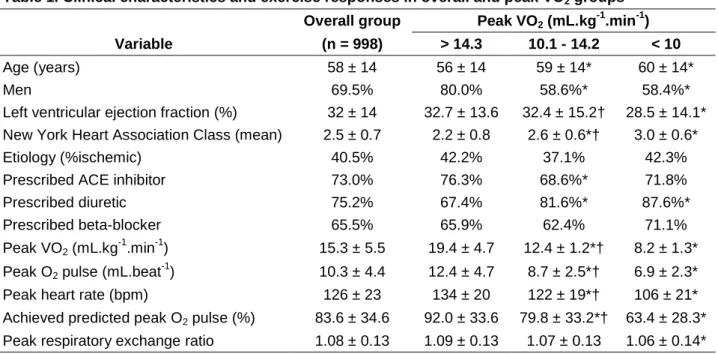
Mancini et al., 1991), o VO2máx tem sido considerado uma das variáveis mais importantes para a seleção de pacientes para transplante. No segundo estudo desta tese, objetivamos ampliar o uso clínico do O2p avaliando seu valor prognóstico em indivíduos com insuficiência cardíaca, especialmente naqueles com valores de VO2máx entre 10 e 14 mL.kg-1.min-1. Já o valor prognóstico do valor de pico de O2p foi estabelecido nos dois primeiros estudos.
Whipp et al., 1996), o comportamento do O2p foi melhor descrito em resposta a protocolos de teste escalonados e fases estacionárias (por exemplo, protocolo de Bruce).
ESTUDO 1- MAXIMAL EXERCISE OXYGEN PULSE AS A PREDICTOR OF MORTALITY AMONG MAKE VETERANS REFFERED FOR EXERCISE TESTING
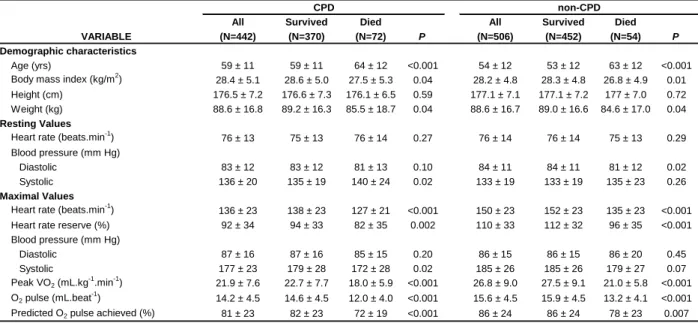
The ability of peak O2 pulse and peak oxygen uptake (VO2 point) to predict mortality was investigated using proportional hazards and Akaike information criterion (AIC) analyses. The relative risks of mortality were 3.4 and 2.2 (CPD and non-CPD, respectively) among subjects with maximal O2 pulse and maximal VO2. Conclusions: These results indicate that peak O2 pulse is an important predictor of mortality in patients with and without CPD.
The O2 pulse (defined by dividing VO2 by heart rate) is generally considered a reflection of cardiovascular efficiency during exercise. A secondary objective was to determine whether the maximum O2 pulse has predictive value that complements other exercise tests. There was no interaction between the use or non-use of beta blockers and the predictive value of the maximum O2 pulse.
AIC weights showed greater accuracy in predicting mortality when maximum O2 pulse and peak VO2 were included together in the Cox model (79%), compared to models that included peak VO2 (4%) or include the maximum O2 pulse (17%) separately. Subjects with both a peak O2 pulse and an abnormal peak VO2 response had a 3.4 and 2.2 times higher risk of mortality (CPD and non-CPD, respectively) than those with both normal responses. The results of the Kaplan-Meier analysis for the complementary predictive value of O2 pulse and peak VO2 are shown in Figure 2.
The present results indicate that even after adjustment for chronotropic incompetence, maximal O2 pulse remained a strong multivariate predictor of all-cause mortality. Laukkanen et al., 2006), our findings support the concept that maximal O2 pulse provides information that complements peak VO2 in predicting mortality. In our study, the AIC weights showed that the model including both maximal O2 pulse and peak VO2 had the highest predictive accuracy for mortality.
After adjustment for all possible confounding factors, the risks of mortality are at both maximum O2 pulse and maximum VO2. Furthermore, we showed that age-predicted O2 pulse was an independent predictor of mortality. These results support the concept that peak O2 pulse complements peak VO2 in predicting risk of mortality.
Survival curves for all subjects against pulse O2 (Panel A) and against peak VO2 (Panel B). Survival curves for all subjects against combined exercise heart rate O2 and VO2 peak responses.

DOES PEAK OXYGEN PULSE COMPLEMENT PEAK OXYGEN UPTAKE IN RISK STRATIFYING PATIENTS WITH HEART FAILURE?
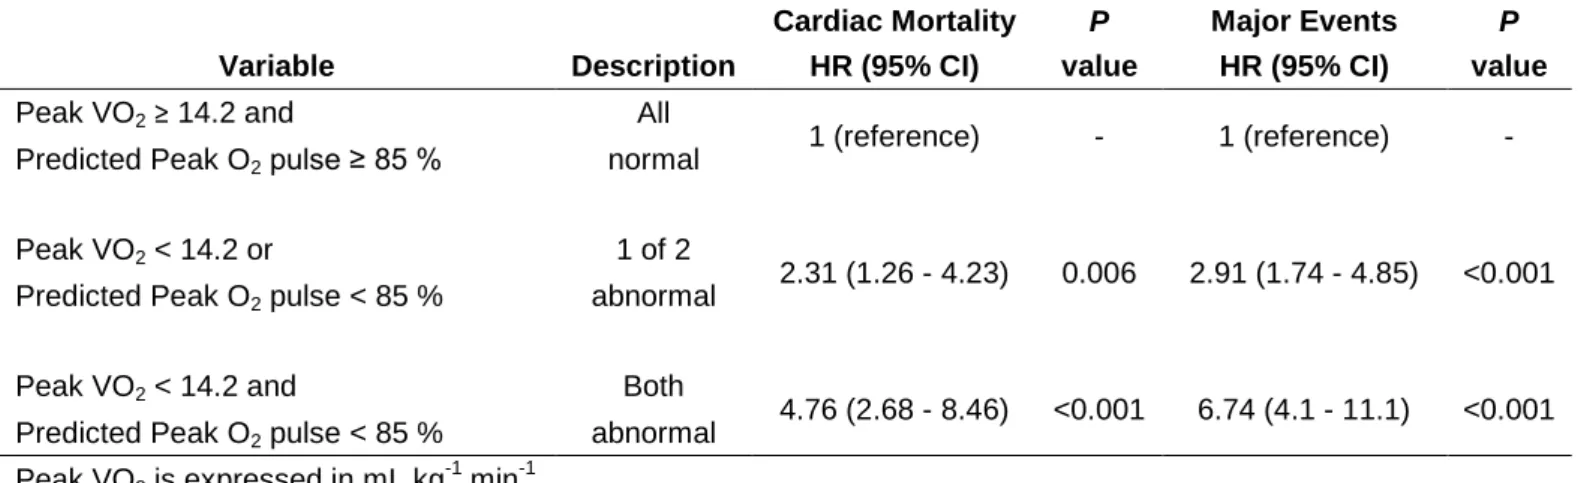
Peak VO2 and age-predicted peak O2 pulse were demonstrated by univariate and multivariate Cox regression analyzes to be independent predictors of mortality (p<0.001). Age-predicted peak O2 pulse also predicted mortality among patients in the intermediate range of peak VO2 (between 10 and 14 ml.kg-1.min-1). In conclusion, age-predicted peak O2 pulse was a strong and independent predictor of cardiac mortality and complemented peak VO2 in predicting risk in patients with HF.
To date, no studies have further investigated the prognostic utility of age-predicted peak O2 pulse in patients with HF. We also expressed peak O2 heart rate as a percentage of the age-predicted value obtained by dividing the age-predicted peak VO2 by age-predicted peak heart rate (Wasserman et al., 2004). AIC weights showed that the models including both peak VO2 and age-predicted peak O2 pulse had the highest predictive value.
Kaplan-Meier analyzes for 3-year major cardiac events with normal and abnormal peak VO2 and age-predicted peak O2 pulse response and their combination are illustrated in Figure 1. Subjects with both an abnormal age-predicted peak O2 pulse and peak VO2 had a 36% higher frequency of cardiac events compared to those with normal responses. We observed that adding age-predicted peak O2 pulse to the model with peak VO2 provided the highest prediction of risk of mortality and composite cardiac events.
It is also worth noting that the highest risk was generated in the model that included peak VO2 and peak O2 pulse predicted by age (Table 3). When VO2 peak and age-predicted pulse responses were abnormal, a greater than 4-fold risk of mortality and a 6-fold risk of having an event was observed. Furthermore, the application of the age-predicted peak O2 pulse cut-point in different HF populations is unknown.
Future prospective studies should attempt to determine the optimal application of age-predicted peak O2 pulse in different subgroups of HF. Kaplan Meier analyzes for 3-year major cardiac events with normal and abnormal peak VO2 and age-predicted peak O2 pulse responses and their combination. Relative risks associated with abnormal peak VO2 and age-predicted peak O2 pulse and their combination.
LONG-TERM STABILITY OF THE OXYGEN PULSE CURVE DURING MAXIMAL EXERCISE
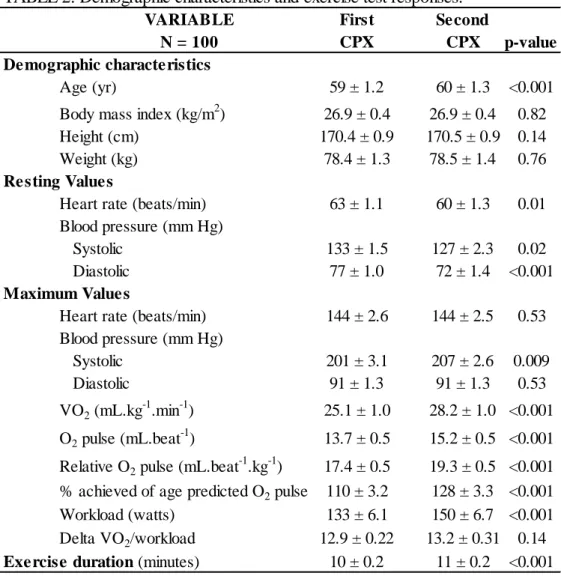
CPX results and the O2 pulse curve pattern, expressed by its slope and intercept, were compared between quintiles of relative O2 pulse at both CPXs. Conclusion: With the exception of the rest-exercise transition, the relative O2 pulse showed a stable linear increase through maximal exercise in adults retested under the same clinical conditions. In order to make the mathematical manipulations of the study easier, all results related to the relative O2 pulse were multiplied by 100.
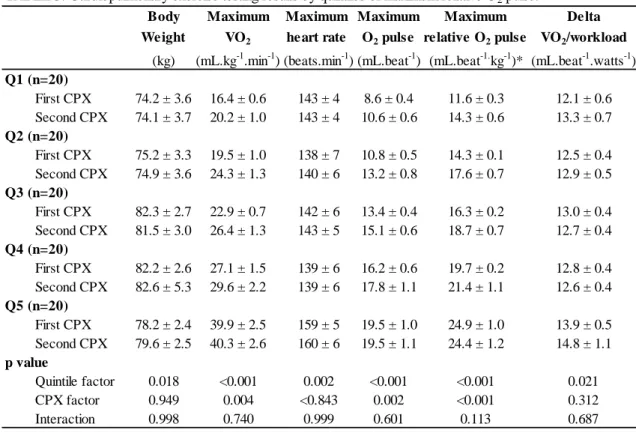
One of the strategies for testing our hypothesis was to divide the sample into quintiles, according to the results of maximum relative O2 pulse obtained during the first CPX. By dividing the sample by quintiles, we compared the stability of relative O2 pulse in subjects with different fitness levels and values of maximum relative O2 pulse. In contrast, when the first and second CPXs were compared in each quintile, significant differences were found for VO2max, maximum O2 pulse and maximum relative O2 pulse (p<0.05 for all comparisons).
The results of the linear regression between the relative O2 pulse and the CPX time divided by quintiles of the maximum relative O2 pulse are shown. After a median time of 15 months, no significant differences were found for the slopes and intercepts between the first and second CPX in each quintile of the maximum relative O2 pulse (p>0.05 for all comparisons; except for intercept comparison in the 5th quintile, p =0.007). When the extremes of the quintiles for the maximum relative O2 pulse (i.e. the first versus the fifth quintiles) were compared, the respective slopes were significantly different (p<0.05).
The results of this study add to the existing body of research showing a linear increase in pulse O2 during maximal non-steady-state exercise testing. A decrease or plateau in the relative O2 pulse would lead to a decrease in R2, which was not the case in our results. Although the linearity was present regardless of the quintile of relative peak O2 pulse (high R2 in all quintiles), it is clear that the higher the slope of the relative O2 pulse, the higher its linearity will be , as shown by the positive trend shown in the results. of R2 between relative pulse O2 quintiles (Table 4).
In contrast, this was not the case in our relatively normal subjects, as delta VO2/workload was within normal limits in all quintiles of maximal relative O2 pulse (Table 3) and the slopes were significantly different from zero (Table 4). The slopes and intercepts were similar despite the significantly higher values of VO2max in second CPX in each quintile of maximal relative O2 pulse (on average 1% to 20% higher on the second CPX). Munhoz et al patients underwent both myocardial scintigraphy and treadmill CPX to compare the O2 pulse response to incremental exercise in patients with and without ischemia as detected by myocardial scintigraphy.
This is increasingly important given the existing association between the O2 pulse waveform pattern and myocardial ischemia. Body Maximum Maximum Maximum Maximum Delta weight VO2 heart rate O2 pulse relative O2 pulse VO2/work load.