To validate the method, the expanded uncertainty (𝑼), the precision and the correctness of the method were calculated. 50 Table 7.21 – Values for calculating the uncertainty related to the calibration/maximum permissible error of the balance.
Framework And Motivation
The MyPlateis an image or graphic representation that helps to choose and combine the foods that should be part of the daily diet. The Portuguese Institute of the Sea and the Atmosphere (IPMA) suggests the extraction of fat by Soxhlet, although the limitations of this method as previously mentioned.

AEMITEQ
Internship Goals
Report Organization
Depending on the type of food, lipids are one of the main components, contributing to the organoleptic, physico-chemical and nutritional aspects that are important in a normal diet. Lipids are soluble in organic solvents (such as ether, hexane or chloroform), but are insoluble in water.
Fats And Oils
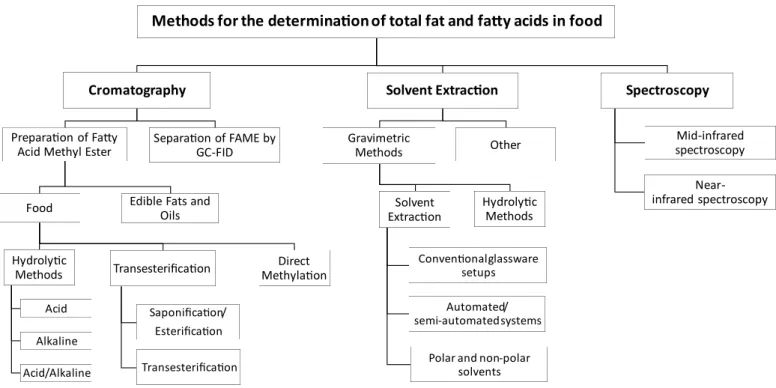
There is therefore a wide range of analytical techniques for the analysis of total fat and fatty acids in food. In Figure 3.1, an overview of the conventional analytical techniques for the quantification of total fat and fatty acids in food is presented.

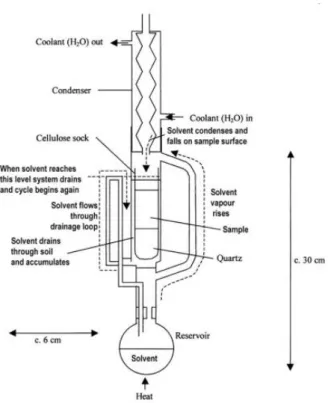
Soxhlet Method
This state ensures sufficient contact with analytes, which controls extraction recovery (Zygler et al., 2012). As the solvent boils, fresh solvent from the distillation flask slowly fills the extraction chamber.
Bligh & Dyer And Folch Methods
Microwave Assisted Extraction
The alignment of the dipoles with the applied field is known as dipole rotation (Eskilsson & Bjorklund, 2000). Microwave power and radiation exposure time have opposite effects: for a given process, using a higher power gives a shorter extraction time; on the other hand, using lower power requires a longer irradiation of the sample to apply the same amount of energy (Lebovka et al., 2012). In large samples with high scattering factors, heating after the penetration energy depth is due to thermal conduction through molecular collisions.
This is due to the fact that an increase in temperature causes a decrease in intermolecular interactions in the solvent, resulting in greater molecular mobility, which increases solubility (Eskilsson & Bjorklund, 2000; Hemwimon et al., 2007; Moret et al., 2019). Although the open-vessel system is safer than the closed-vessel system, the extraction conditions are less reproducible and many samples cannot be processed simultaneously, requiring longer extraction times to achieve similar performance to the closed-vessel system (Kapoore et al., 2018 ). The upper part of the fish fillet contains more protein than lipids compared to the lower part (Gökoğlu & Yerlikaya, 2015).
Methods For Lipid Extraction
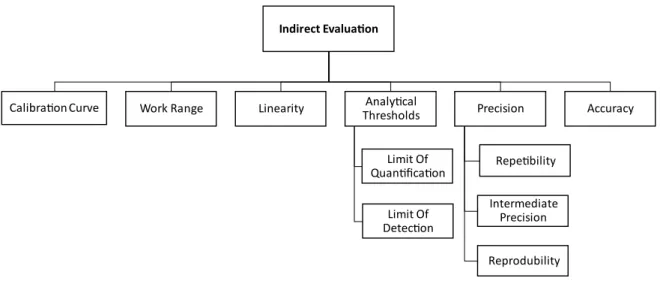
In other words, the validation process aims to demonstrate that the method is suitable for the quantification of the target analyte in a matrix, at a certain concentration level, with satisfactory precision and accuracy. According to ISO/IEC 17025, in order to perform the method validation, it may be necessary and convenient to perform some (or all) of the investigations below. The study of the representativeness of the method, i.e. that the specific properties correspond to the purpose of the test.
The study of the theoretical principles (foundations) of the method to prove the scientific basis for the method. The study of the sources of interference and error to outline its utility and dominate its application. Examining the performance characteristics of the method to know the quality of the results.
Working Range
If 𝑻𝑽 ≤ 𝑭𝒄𝒓𝒊𝒕: the variance difference is not significant and the working range is well adapted;. If 𝑻𝑽 > 𝑭𝒄𝒓𝒊𝒕: the difference between the variances is significant and the working range should be reduced until the differences between the variances allow 𝑻𝑽 ≤ 𝑭𝒄𝒓𝒊𝒕.
Linearity
Analytical Thresholds
Limit Of Detection
For this, the mean and standard deviation of the values obtained for the experimental fat were calculated. In figure 7.2 it is possible to see the replay of the tests made for the standard controls. In table 7.22 it is possible to see the values obtained for the repeatability test of the balance, and the uncertainty associated with a unit weighing.
With this, the combined standard uncertainty and the expanded uncertainty of the method were calculated, which are presented in Table 7.32. From the results presented in the table above, it can be decided what the uncertainty of the method should be. For the validation of the method, the expanded uncertainty (𝑼), and the accuracy and truth of the method (coefficient of variation) are compared with the combined uncertainty (𝒖𝒄).
Limit Of Quantification
Precision
- Repeatability
- Intermediate Precision
- Reproducibility
- Statistical Hypothesis Testing (t-test)
- Performance Factor Z (z-score)
- Normalized Error
Repeatability and reproducibility refer to the agreement between successive measurements of the same analyte performed under the same conditions. Repeatability represents the agreement between the results of successive measurements of the same method performed under the same measurement conditions, called repeatability conditions: same procedure, same analyst, same instrument used under similar conditions, same local repetitions in a short period of time (Ribani et al., 2004; Olivieri & Faber, 2009). This parameter is determined by the study of n repetitions using the same matrix, which includes all concentration levels and domains of the method application.
In the event that the laboratory calculates the uncertainty of its result (𝑼𝒍𝒂𝒃), the actual value (𝑿𝒗) must be within the uncertainty interval of 𝑿𝒍𝒂𝒃. When the evaluation processes used do not show satisfactory conditions, a plan of actions must be worked out to identify the causes of the success, correct them and re-evaluate the rehearsal (Augusto et al., 2000). During the validation of the method, the A.C used in the implementation was compared with the expanded uncertainty obtained (𝑼), and the accuracy and truth of the method (coefficient of variation) was compared with the combined uncertainty (𝒖𝒄) .
Implementation Of The Method
Determination Of Theorical And Experimental LOQ
During the implementation of the method, the acceptance criteria (A.C) were established by us, from previously performed tests, and were set to <15% for all parameters. The chosen mass to determine the LOQ of the method was 0.01 g once it was the most comfortable mass to weight, from the operator's point of view. With this, the accuracy and precision (repeatability) of the determination of the LOQ was studied.
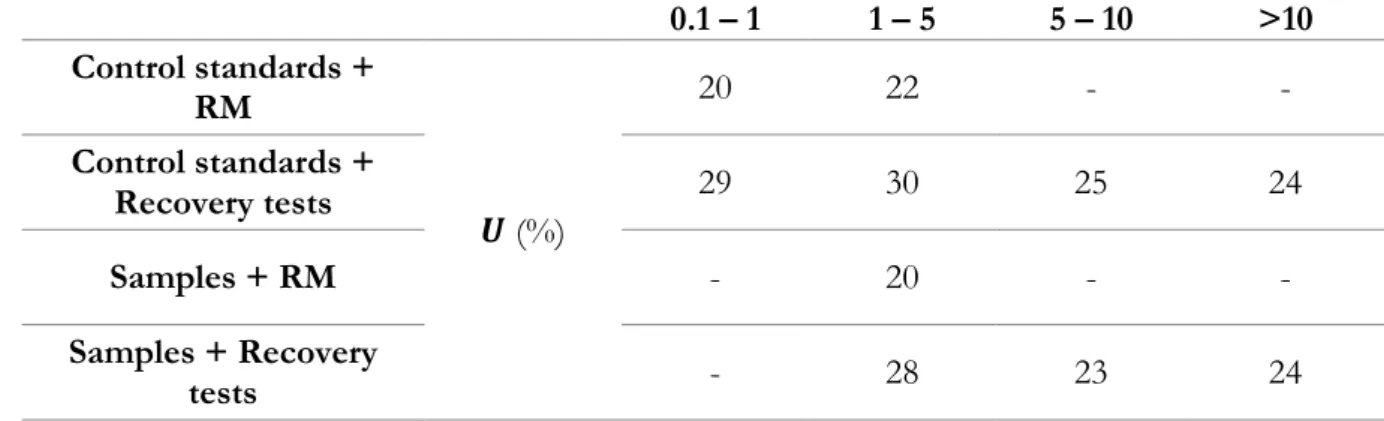
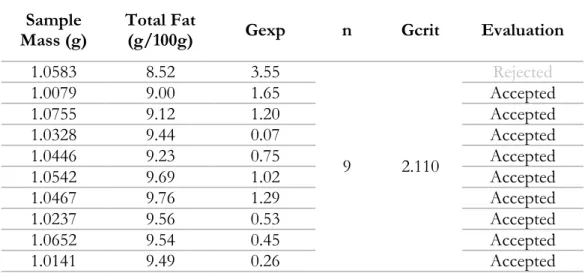
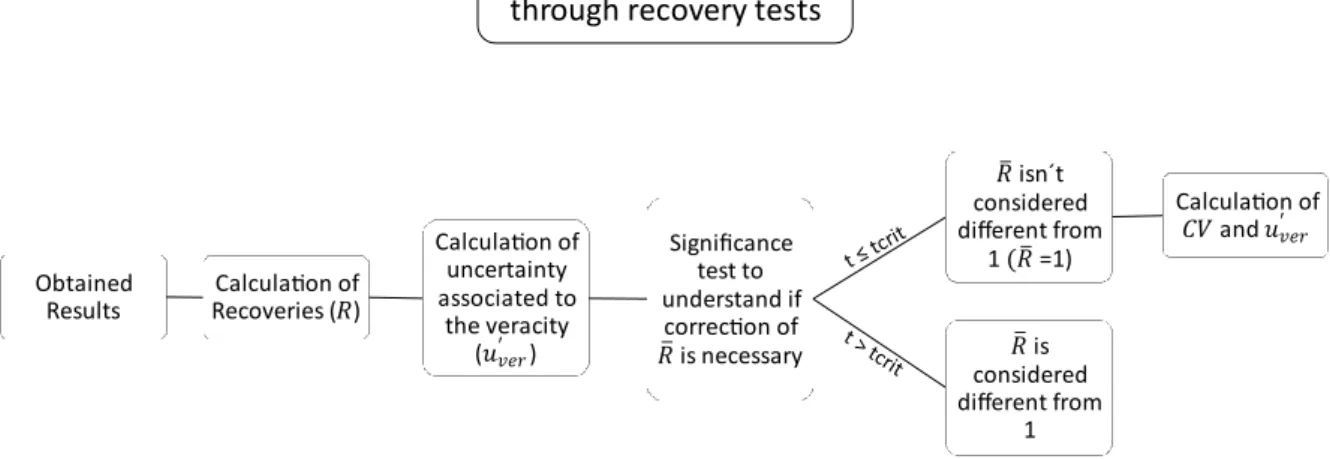
It is normal to obtain a higher value of the experimental LOQ than that of the theoretical LOQ. The other masses, previously referred to, were used as control standards to assess the performance of the method. If F For both tables, since F Due to the amount of results, the tables with the obtained values are presented in Appendix A1: Examination of intermediate precision from reproducibility. With these values, the standard deviation and coefficient of variation for each sample were calculated. In table 7.18 it is possible to see the weighted coefficients of variation obtained for the repeatability and reproducibility. The laboratory can define another criterion, depending on the efficiency and complexity of the method. To calculate the relative uncertainty of the added analyte concentration, the repeatability of the measuring vessel was examined. Since 𝒕 ≤ 𝒕𝒄𝒓𝒊𝒕, 𝑹̅ is not considered different from 1, so no recovery corrections need to be made. Selectivity is the ability of the method to identify and distinguish a particular analyte in a mixture without interference. Table 7.25 shows the values obtained for the limits of the graph, as the average of the obtained results and the standard deviation. Another way to check the authenticity of the method is with certified reference materials (CRM). However, to determine these parameters, it is necessary to know the value of the extended uncertainty of the method, calculated through the validation of the method. Table 7.28 Table 7.28 lists the results of 𝒖𝑹𝒘 for all studied working areas, calculated using control standards and duplicate samples. The expanded uncertainty associated with the RM value is required to calculate 𝒖𝑪𝒓𝒆𝒇'. Uncertainty From Recovery Tests The main goal of this work was to validate the MAE method for the extraction of total fat in fish. The parameters calculated for the application of the method were LOQ, LOD, control standards, duplicates and replicates of samples, recovery tests and reference materials. The lowest amount of the analyte that could be quantified with precision determined under the stated experimental conditions (LOQ) was determined from a data set with a known concentration, obtaining a value of 0.11 g/100g . Finally, the value of 𝑼 was calculated in four different ways for the different series: control standards + reference material, control standards + recovery tests, samples + reference material and finally, samples + recovery tests. The validation of the method could be more robust if: certified reference material was available for each series of work, which could also be considered. Guidelines for the Validation of Analytical Methodology and Calibration of Equipment Used for the Testing of Illicit Drugs in Seized Material and Biological Specimens A Commitment to Quality and Continuous Improvement. Use of focused open-vessel microwave-assisted extraction as a predictor for determining the fatty acid profile of fish - A comparison with results obtained after liquid-liquid extraction according to Bligh and Dyer. At the beginning of the internship, once AEMITEQ was in constructions, it was not possible to immediately start with the theme proposed to me.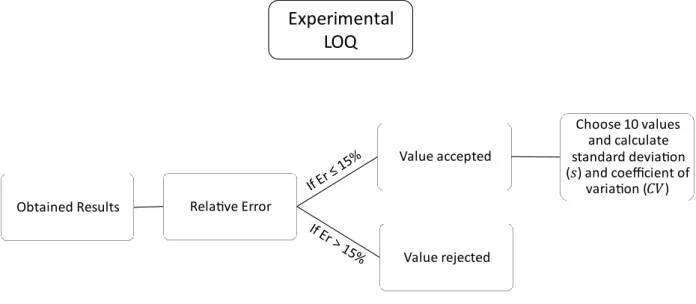
Study Of Precision
Trueness
Validation Of The Method
Uncertainty Of The Method
Uncertainty Trough Standards
Uncertainty From Samples