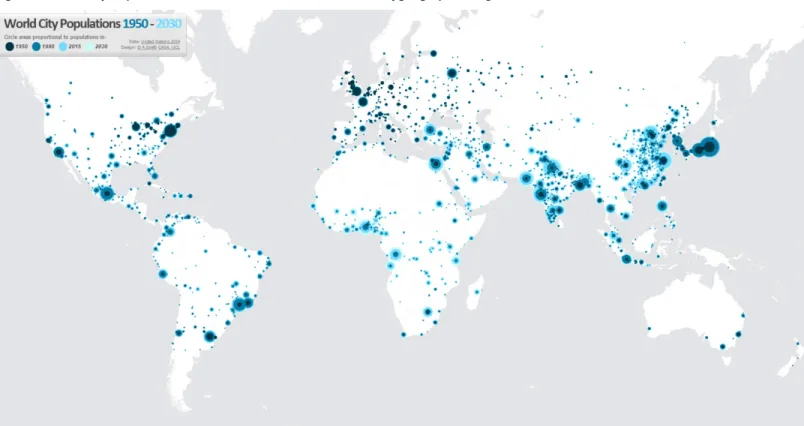
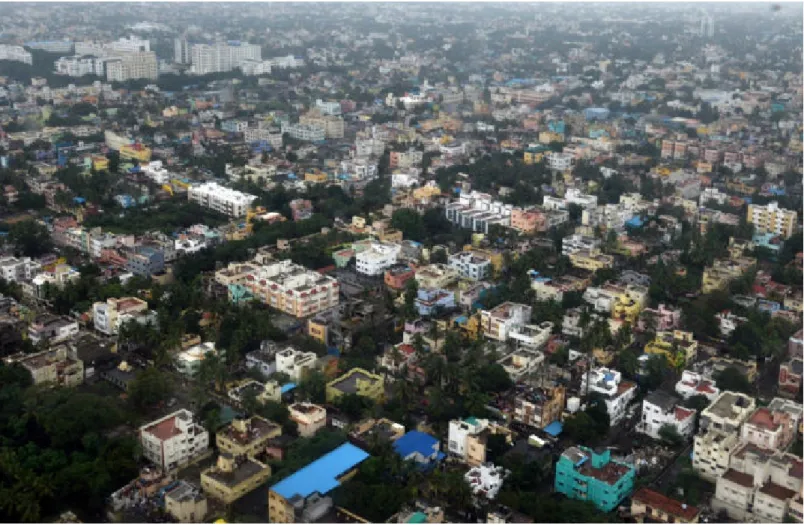
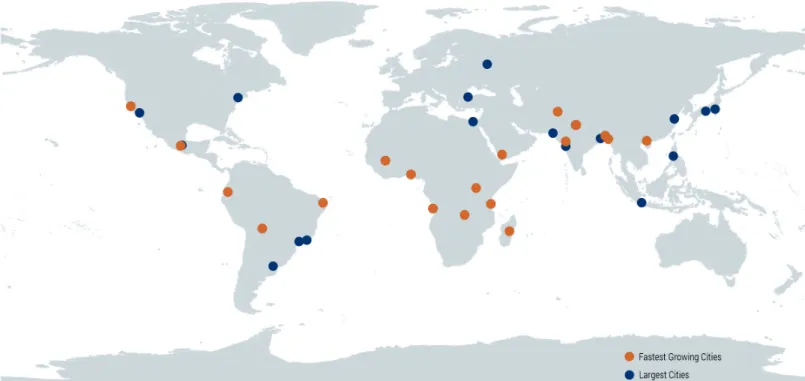
Two of the main parameters in causation, as not all disasters can be planned. It is used to reduce vulnerability to disasters and mitigate their impact. The United Nations (UN) predicts that 70% of the world's population will live in cities by 2030.
As part of the study, we included global and local disaster risk reduction efforts in the form of frameworks and vulnerability studies.
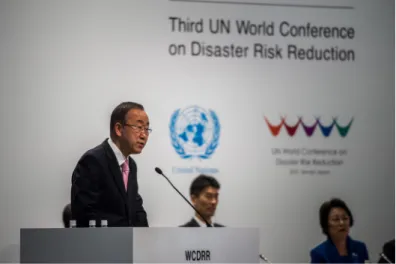
GLOBAL FRAMEWORKS OF DRR AND URBAN PLANNING
UNISDR also offers a platform called PreventionWeb that can be used to share knowledge about disaster risk. In 2015, the UNISDR Hyogo Framework was updated to the Sendai Framework, which forms a large part of the proposal. The Sendai Framework for DRR is 15 the stakeholders responsible for reducing disaster risk and the role they play in doing the same from 2015-2030.
UNISDR is responsible for the implementation and review of the framework and one of the objectives of our proposal is to formulate a robust method of reviewing progress towards the Sendai framework. The goal of the Sendai Framework is "to prevent new risk and reduce existing disaster risk through the implementation of integrated and comprehensive economic, structural, legal, social, health, cultural, educational, environmental, technological, political and institutional measures that prevent and reduce risk". exposure and vulnerability to disaster, increase readiness for response and recovery, and thus strengthen resilience9". To understand this risk, it is important to evaluate and keep a record of the following in a local and.
The frequency of assessment of the above risk dimensions • Dissemination of location-based disaster risk information • Sharing of experiences and good practices among ULBs • Use of traditional, indigenous practices in risk reduction and sharing of these local techniques. Investing in disaster risk research at local and national levels • Incorporating disaster management knowledge into community and public education. Integrating disaster risk assessment into land use planning through guidelines and follow-up tools.
CURRENT PRACTICES OF DRR
Vulnerability to Resilience Approach - This approach talks about building the livelihood capacity of communities to increase their resilience to disasters. Total risk management approach - Combines approaches in other methods in a more comprehensive way. It focuses on the root causes of disasters and looks at planning in such a way as to reduce people's vulnerability and risk.
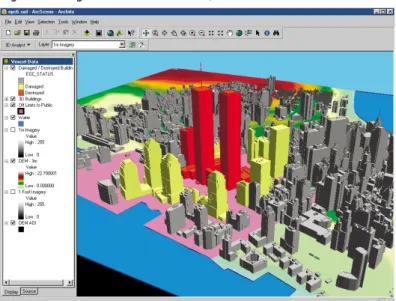
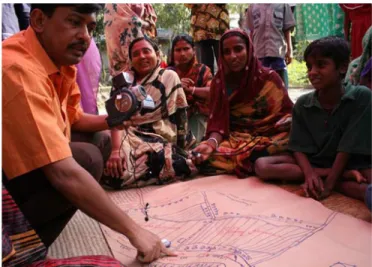
This acquired map was created to map the effects of the many global, national and local agencies that collect spatial information about their cities, which can be a powerful tool to integrate planning and DRR. Through a participatory process, people from the community identify the hazards, and map in a graph that represents the boundaries of the locality with the use of art pieces, the larger their size, the greater the intensity and damage. Zoning regulations must be adjusted in relation to different preferences and characteristics of the residents in each area, while the building codes must be selectively applied, especially to public buildings, because building costs are unaffordable for the community in general.
Emphasize the use of development criteria or indicators as measures to identify and describe vulnerability (or resilience) and their integration into the disaster risk management framework, c. In the following study, vulnerability will be considered in the context of vulnerability to natural disasters. These include factors that make a city where disaster occurrence is more likely, as well as the social factors and ability of the people to recover from disasters.
VULNERABILITY INDICES
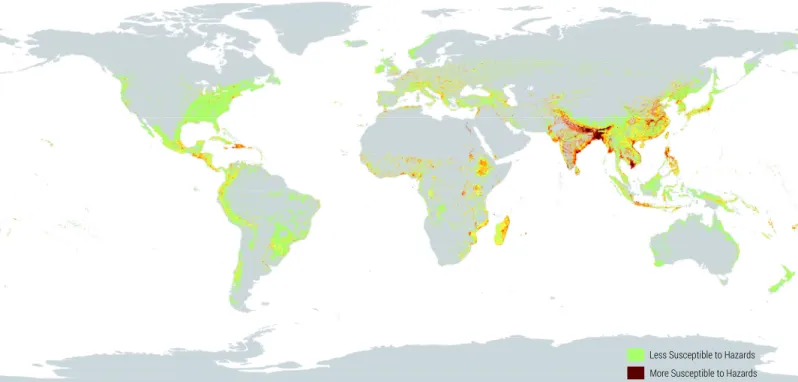
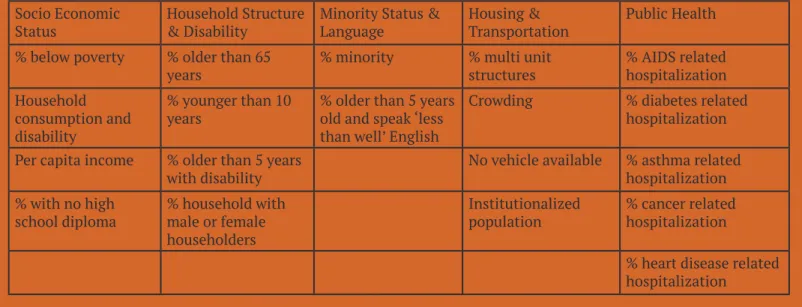
According to UNISDR, vulnerability “encompasses the characteristics and conditions of a community, system or asset that render it susceptible to the adverse effects of a hazard arising from a variety of physical, social, economic and environmental factors11. There are different facets of vulnerability that can be considered in this domain such as economic vulnerability, social vulnerability, environmental vulnerability and so on. The following section attempts to report the most comprehensive vulnerability indices relevant to disaster management.
This model takes into account a set of indices used in vulnerability analysis at the local level.
CONCLUSION
The previous sections show that there are several theories today about how planners should work on DRR and how they should implement processes to reduce risk in their cities. It also shows that there are multiple frameworks to analyze how effectively DRR is being implemented in cities on a global level. On the other hand, technical means are also available to measure disasters, depending on the type of disaster and the availability of data at the municipal level.
This is directly related to the last point of data availability in small amounts on various websites. If the purpose of city planning is to create positive change in communities, one of the primary responsibilities is to respond to the urbanization process in a way that grows and develops.
PROPOSAL
GOALS AND OBJECTIVES
Web developers will be involved in purchasing a domain name and a web server and creating individual web pages on the site. Measure' opens a series of graphs related to the vulnerability index that will be discussed in section 4.6. This updated quarterly by CityProgress and people will be able to view time series data on how their city has progressed over time.
Learn' provides detailed statistics and information from urban planners about their DRR efforts. Finally, 'explore' opens an interactive map that contains all the information listed in the section.
CREATION OF CITYPROGRESS CITYPROGRESS WEBSITE
The last tab - 'login' is for planners and this opens a registration page where they can access and provide more information about their sites and other sites using the server. This tab will be linked to additional spatial data provided by planners about their sites and the calculation of their vulnerability score. They will be able to see a breakdown of their vulnerability score on the dashboard.
CREATION OF GIS OPEN DATA MAP
This rich and comprehensive data set will be the basis used by planners when they register on the website. When cities provide their registration details, they will be able to provide additional layers that they can access, which will only be viewed by them and any other city planners registered for the service. In the long term, a basic GIS model will be built using the types of data uploaded by cities that will create a spatial risk index layer using the vulnerability index.
For the purposes of this proposal, this has not been explored as it depends on the type of data submitted by cities and the level of information they can provide.
PLANNERS WORK PLATFORM
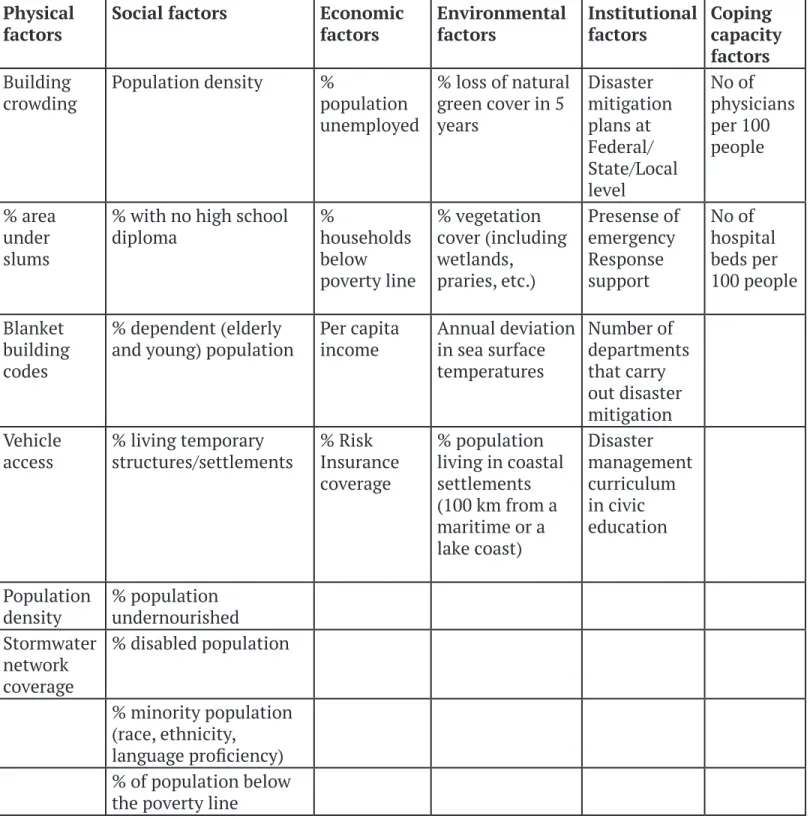
In this way, this extensive open data mapping exercise is useful in visualizing information and achieving our future objectives. This is most often used due to the simplicity of the procedure and the actual difference in the indices that fall under this approach lies in the weight and indicators used. The CityProgress Index includes population density, unemployment, population 65 and over, GDP per capita, percentage of population female, physicians per population, literacy rate, total population, beds per population per hospital, percentage of population under poverty line and GINI is a long-term value and depends on the type.
This is a functionality that is developed six months - a year after the opening of CityProgress. Both the index and the GIS map will be available to the planner and can be shared with other planners on the server if he/she chooses to do so. The questionnaire will be generated quarterly so that planners can update their progress and on new ideas in DRR.
In addition, planners can also click on individual risk areas taken to mitigate risk. In this way, CityProgress recognizes that local planners have the most in-depth information about their city and can work on DRR, provided they have the tools to do so.
VULNERABILITY INDEX
Disaster Management Curriculum in Civic Education. population below the poverty line .. the indicators will be weighted differently with greater emphasis on physical, environmental and coping factors. The Vulnerability Index and progress towards Sendai provide a robust mechanism for planners to determine Compliance with Priority 1 – Understanding Disaster Risk. more than 10% Results01 Is location-based disaster risk information being disseminated? No Yes Traditional, indigenous practices are used in risk reduction.
NoYes 10An assessment has been made of the institutions' ability to cope with NoYes 11An assessment has been made of the institutions' ability to address disaster risk from an administrative perspective. NoYes 12Here has been an assessment of the institutions' ability to deal with disaster risks from a technical point of view. NoYes 13Planning safety regulations are metNoYes 14Building code safety regulations are metNoYes Priority 3 - Investing in Disaster Risk Reduction for Resilience 29Geneva Challenge.
There is an existing mechanism for insurance, risk sharing and No Yes There is an integration of disaster risk assessment into land use planning through guidelines and follow-up tools. No Yes Social infrastructure plans include aspects of disaster preparedness. 18Existing early warning systems for multihazard disasters.
FUTURE SCOPE
Urban disaster resilience planning workbook, adapting experiences from Vietnamese cities to other cities. Evaluating land use and emergency management plans for natural hazards as functions of good governance: a case study from New Zealand. A Research Study on Land Use Planning for Disaster Prevention: A Case Study of Kaohsiung New City.
BIBLIOGRAPHY