Dans le domaine de la spectroscopie d'absorption, les lasers à cascade quantique dans le rayonnement infrarouge moyen sont capables de résoudre les résonances roto-vibratoires fondamentales de nombreuses molécules de gaz. Dans le domaine de la spectroscopie térahertz, les peignes de fréquence optique sont une technologie émergente pour la spectroscopie à double peigne optique haute résolution.
Information technology
The Internet accounts for 5% of global energy consumption [2], much of this power is in electrical core switches that consume up to 10 kW. Silicon is attracting a lot of interest in the field of passive photonics because of the perspectives it opens up for all-optical systems.
Health and environment
In this thesis I dealt with the design of laser optical cavities capable of carrying the load required for germanium with a direct bandgap. A set of detectors has been installed on top of trams moving in the city of Zurich to monitor air quality.

Astronomy
Waveguides
COMSOL Solvers
CST microwave studio
Unlike COMSOL, CST microwave studio [57] provides a time domain solver and can solve S-matrix problems very efficiently.
Large systems
- System disassembling
- Symmetry reduction
- Mode selection
- Effective index approximation
Such information can be given to the solver, and the number of degrees of freedom per grid point of the system must be reduced from 6 to 3. To calculate the modes of a ridge laser cavity, the effective index approximation can be used due to small field complexity in the transverse (x,z) direction compared to the y propagation direction, as shown in Figure 4.2.

Wave transfer matrix method
Fabry-Perot resonator
0 where n" is the imaginary part of the refractive index, and λ0 is the vacuum wavelength of light. In the active layer a 2D triangular photonic crystal pattern is defined, which fixes the high symmetry points of the reciprocal space on Γ, K and M Figure 5.2.

The absorbers
In our design, the extractors extend the mode beyond the pumped region of the photonic crystal [74] and increase its radiation losses. One can observe the electrical insulation of the contact pad by the deposition of a SiN layer.

Results and discussions
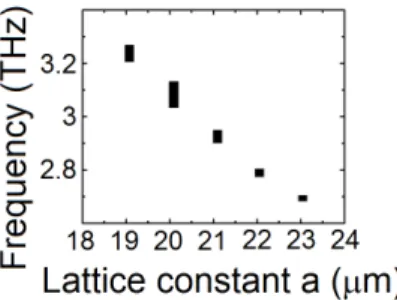
The lattice parameter
We see that for the lattice parameter a = 19 µm, the high symmetric point M hairs, the point K is outside the gain bandwidth. We see that for a lattice parameter of 19 µm the gain peaks at the M point energy and for larger lattice parameters it peaks at the K point and explains the results shown in Figure 5.7.
The filling factor
On the right vertical axis, the overlap factors of the different fill factors are displayed with the corresponding color. In addition, we see that the slope efficiency of the lasers is the same regardless of the fill factor.
The cavity size
The maximum operating temperature is obtained by the smaller devices with a lattice parameter of a=21 µm. The fact that with a 30% fill factor the device performed at higher temperatures compared to the 20% and 40% shows the trade-off between power dissipation and modal gain.

Conclusion
The extraction is realized by an additional second-order Bragg grating in the center of the spacer. We choose the subset of the lattice positionsxj=j∗Λextrwhere j∈[−N2, N2], as a result the near field follows this amplitudeE(xj) =E0cos(πj/N).

Fabrication
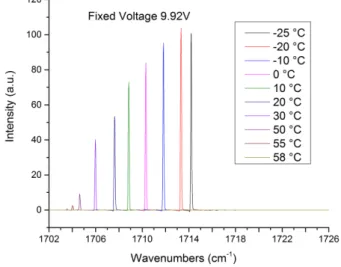
The spectral peaks are the result of enhanced spontaneous emission and are the signature of optical cavity modes. The high peak located in the center of the stopband is the error mode that occurs at the laser frequency. The observed frequency of the electroluminescence modes is in good agreement with the calculation, which also predicts a mode separation of 10 cm−1 between the defect and band-edge modes.
Results
This is a sign of constant optical gain and losses and of their independence from the phase of the facet reflection. Correspondingly, the low device-to-device fluctuations of the rollover current reflect the reproducibility in the device bandwidth. The far-field patterns of the devices are measured with a goniometer assembly; the result is displayed in figure 6.6.

Further results
The tuning is biased towards lower frequencies and originates from the temperature increase in the active region. The lack of surface emission can be caused by an incorrect placement of the extraction grating relative to the DBR, or by a window offset. The light-current-voltage performance measured at the top of the lasers has a poor collection efficiency from the facet emission, so the LIV does not represent the real output power of the devices.

Outlook and Conclusion
The terahertz quantum cascade laser is an ideal platform to combine the fields of optics and microwave electronics. In this work we propose to use antennas to engineer the laser aspect properties of a terahertz quantum cascade laser. A first design at 4.7 THz integrated a slot and a fixture antenna attached to a terahertz QCL and has been reported [113], this chapter presents an analysis of published results and presents further results at 1.9 THz.

Double-Metal waveguides and impedance matching 78
Reflection
The laser cavity can best be described by an impedance model, and the aspect reflectivity can only be estimated using a impedance mismatch model, R=.
Antenna
Design
Results
To characterize the effect of the antenna, compare it to an antennaless reference device. Antenna devices are characterized by an increase in the threshold current and a decrease in the maximum operating current, an increase in the slope efficiency and the maximum output power. The antenna radically reduces facet reflectivity, which translates into an increase in cavity losses and thus threshold.

Design
BCB absorption losses are three times lower at 1.9 THz than at 4.7 THz, as can be seen in Figure 7.8. Between the amplifier section and the antenna is a reflector with about 60% reflectivity, which regulates the length of the cavity and losses. The function of the antenna is to narrow the long-range radiation and deflect it in the vertical direction.

Results
Self-mixing
The resulting field inside the cavity is the interference of a wave reflected from a laser reflector and a wave reflected from a movable external mirror, similar to an interferometer. The oscillating field inside the cavity creates a voltage variation in the laser, which is recorded by the lock-in amplifier through the alternating end of the bias voltage T. It has an oscillatory behavior attributed to small tuning of the laser frequency in and out of resonance of the external cavity.

Conclusion
Von Mises stress
Gain in strained germanium
The gain in strained germanium strongly depends on the strain level and carrier density in the conduction band. For low levels of strain, the structure exhibits absorption, the carriers generated at the Γ point of the conduction band escaping to the L valley. At a strain of 4%, the interband and interval band transitions are resonant as seen in Figure 8.2.

Strain measurement
The von Mises stress profile in Figure 8.10 reveals a concentration of the von Mises stresses in the concave bends. The failure of the cavity can be explained by the value used in the two previous cases shown in Figure 8.12. The width of the reflection peak is due to the final acceptance angle in the simulation.

Dispersive mirrors
Group velocity dispersion in quantum cas-
Group velocity dispersion and effective refractive index of the fundamental mode in a conventional buried heterostructure mid-infrared quantum cascade laser.

Dispersion compensation in quantum cas-
For this reason, we use polynomial or Chebyshev polynomial phase fitting to perform two derivatives to calculate the GDD. An alternative technique to obtain phase from interferometer measurements is to use a laser interferogram. The echoes of the central burst of the interferogram contain the phase shift information needed to calculate the GDD.

Gires-Tournois interferometer
Second, in the interferogram method the echoes are not clearly distinguishable and they span a longer time than the cavity back and forth. An apodization must be used to isolate the individual echoes, a situation not encountered when measuring a MIR QCL, due to the faster 1ν period compared to the cavity return time. The group delay distribution from a Gires-Tournois interferometer can be calculated analytically by summing all possible reflection combinations.

Dispersion of a Bragg Mirror
In this mirror we see that the stop band is present where the field penetration length is small. The band edge modes are also present to the right and left of the stop band.
Duty cycle chirped mirror
Bragg wavelength chirped mirror
Double chirped mirror
In the double-chirped mirror case the induced group delay distribution is much stronger than the other two cases. Gires-Tournois oscillations are reduced and GDD is negative over most of the range of the high reflectivity zone. Many models exist to predict the shape of the induced GDD, but in general it is difficult for an analytical model to provide a mirror design capable of compensating an arbitrary GDD.

Genetic optimization
This design corrects the GDD shown in Figure 9-15 at a bandwidth between 1.65 and 2.6 THz. The frequency spectrum of the device is shown in Figure 9.16. It is a similar device as in these publications [84, 121]. For comparison, the phases of the Fabry-Perot modes are plotted in Figure 9-17, along with those of a mirrorless cavity.

Conclusion
MOVPE Growth
Untrainer, “High-power terahertz quantum cascade laser with symmetric wafer-connected active regions,” Applied Physics Letters , vol. Faist, "Ultra-wide broadband heterogeneous quantum cascade laser emitting from 2.2 to 3.2 thz," Applied Physics Letters, vol. Faist, “Fully automated quantum cascade laser design by genetic optimization,” Applied Physics Letters, vol.
Ritchie, “A low-frequency terahertz quantum cascade laser operating from 1.6 to 1.8 THz,” Applied Physics Letters , vol. Faist, “An integrated patch and slot antenna for terahertz quantum cascade lasers at 4.7 thz,” Applied Physics Letters, vol.

Microdisk processing
Heterogeneous stack of bound-to-continuum at 8-
ICP dry-etching
Chlorine is responsible for chemical etching, it reacts with surface components, so it is sensitive to surface elements and is not suitable for heterostructure. The original recipe, here referred to as Dana GaAs, has been slightly modified to Chris GaAs with helpful input from Drs. The recipe used in Figure B.1 is specifically vertical and etches at the same rate as InGaAs, InGaAsP, or InP.
RIE dry-etching
Wet-etching
Linfield, "Terahertz quantum cascade lasers with copper metal-metal waveguides operating up to 178 k," Optics Express, vol. Rakic, “Demonstration of a self-mixing displacement sensor based on terahertz quantum cascade lasers,” Applied Physics Letters , vol. Sirtori, "High power frequency comb based on mid-infrared quantum cascade laser at λ ~ 9 µm," Applied Physics Letters, vol.

Deposition
Plasma deposition
Spin-coating
Terahertz quantum cascade laser at lambda is about 100 mum using metal waveguide for mode confinement,” Applied Physics Letters, vol. Faist, “Continuous tuning of terahertz distributed feedback quantum cascade laser by gas condensation and dielectric deposition,” Applied Physics Letters , vol. Barbieri, "Continuous-wave coherent imaging with terahertz quantum cascade lasers using electro-optical harmonic sampling," Applied Physics Letters, vol.
![Figure 3.3: Images of the M16 Eagle Nebula at various frequencies [29, 30], from [31]](https://thumb-eu.123doks.com/thumbv2/pubpdfco/327711.42252/24.629.86.509.107.281/figure-images-m16-eagle-nebula-various-frequencies-29.webp)
![Figure 3.5: Comparative representation between performances of various THz QCLs, for pulsed laser operation the peak output power is plotted [31].](https://thumb-eu.123doks.com/thumbv2/pubpdfco/327711.42252/26.629.87.502.101.335/figure-comparative-representation-performances-various-pulsed-operation-plotted.webp)
![Figure 3.6: Compilation of the maximum published operation temperature as a function of the frequency [50].](https://thumb-eu.123doks.com/thumbv2/pubpdfco/327711.42252/27.629.193.472.116.323/figure-compilation-maximum-published-operation-temperature-function-frequency.webp)