However, Curriculum Theory hardly deals with the specific needs of VET, especially addressing the interface between education and employment systems. These features are characterized by addressing information links between education and employment systems.
Background and Objectives of the Feasibility Study
This interim report summarizes the results of the first project phase on the definition and identification of top performing countries. Next, we present our approach for identifying the 20 top performing countries (chapter 3) before describing the selected countries individually (chapter 4).

Conceptual Approach for the Identification of Top-performing Countries
Terminology
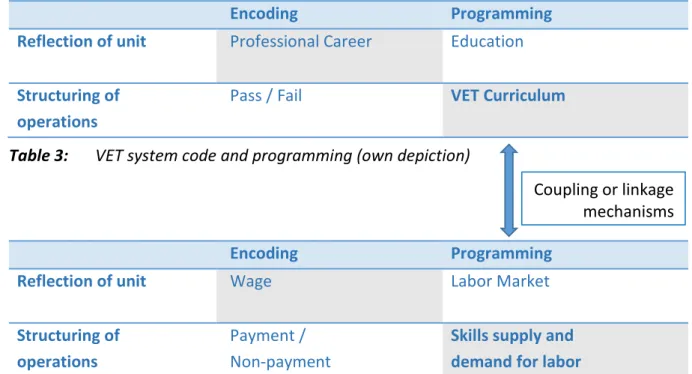
The labor market is part of the employment system, which is itself part of the economic system. The mutual factors of the education and employment systems are related to the linking of professional careers between the systems (programming).

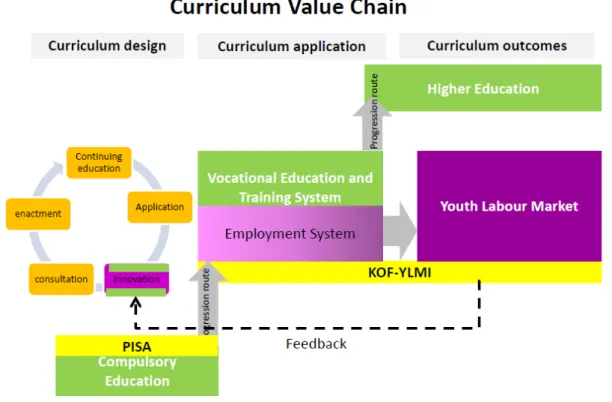
The Curriculum Value Chain
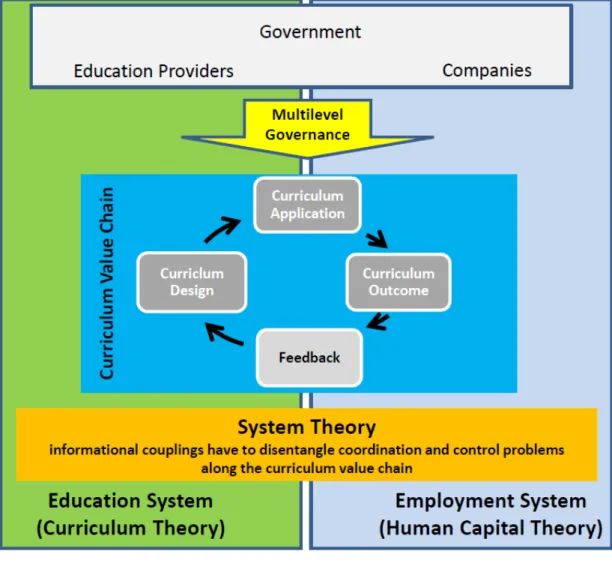
The “youth paradox”4 is an example of the symptoms of poorly functioning coordination and control processes between the education and employment systems. Finally, as we saw in the previous part of this study, systems theory provides a framework for understanding the linkage of the education and employment systems.
Our Hypotheses
Identification of Top-performing Countries
Youth Labor Market Measurement
The KOF YLMI therefore identifies high-performing countries with regard to the situation of young people on the labor market. The KOF YLMI comprises indicators for labor market integration (quantitative outcomes) as well as indicators for work quality (qualitative outcomes).
Programme for International Student Assessment (PISA)
Compared to the 2009 list, this list includes Taiwan, Estonia and Poland; while Australia, New Zealand and the Netherlands are excluded. Finally, note that Liechtenstein, despite its exceptionally high PISA scores, was not considered due to its small population.7.
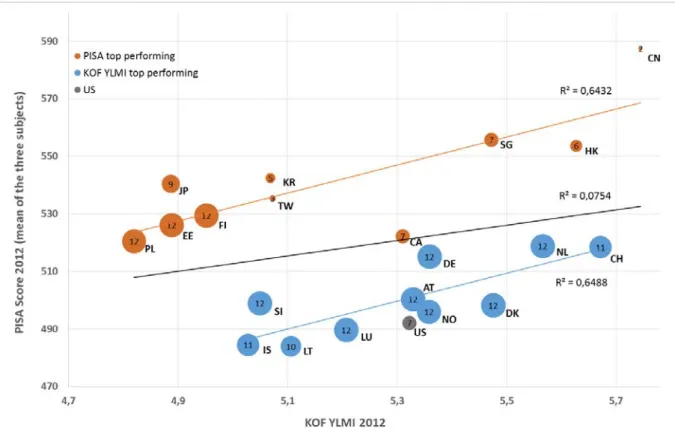
Correlation between PISA scores and the KOF YLMI
Although we have almost complete information on the ten best performing countries on the KOF YLMI in 2012, information on the ten best performing countries on PISA is scarce. Therefore, it may be the case that countries that are not in the top 10 according to the KOF YLMI – in which we only consider countries with at least eight indicators – have a better value in Figure 4 than some of the countries selected based on their good performance on the youth labor market. The most favorable youth labor situation represented by the KOF YLMI group of countries selected on the basis of their performance in the youth labor market is associated with relatively low scores on PISA.
Overall, there is a positive correlation between KOF YLMI and PISA scores, which validates our choice of instruments. The limitation of comparable indicators in KOF YLMI for some countries (CA, CN, HK, JP, KR, SG, TW) may distort the relationship. Therefore, to check the relationship with comparable indicators, we calculated the correlation between PISA results and a reduced version of KOF YLMI that considers only the six common indicators.
The positive correlation between the PISA and KOF YLMI scores within each country group suggests that countries with a successful compulsory education system also have a successful upper secondary education system. Conversely, the PISA scores of Slovenia and Germany suggest higher KOF YLMI scores than are actually observed.
Descriptions of the 20 Top-performing Countries
Outline
Our approach to collecting additional data for this second group of countries is as follows: We start by looking for data provided by international organizations that were not considered in the first release of the KOF YLMI. 9 For example: involuntary part-time in Hong Kong and Singapore is defined by a threshold of 35 hours per week, while in KOF YLMI it is set at 30. GDP (World Bank10): "GDP at buyer's prices is the sum of gross value added by all resident producers in the economy plus any product taxes and minus any subsidies that are not included in the value of the products.
GDP is the sum of gross value added by all resident producers in the economy plus any taxes on the product and minus any subsidies not included in the value of the products. Inflation (World Bank): "Inflation as measured by the consumer price index reflects the annual percentage change in the cost to the average consumer of purchasing a basket of goods and services that may be fixed or changed at certain intervals, such as every year. Population (World Bank): “Total population is based on the de facto definition of population, which counts all residents, regardless of legal status or citizenship - excluding refugees who are not permanently settled in the country of asylum, who are generally are considered part of the population of their country of origin.
To emphasize the problem of interpretation that arises if a country has less than eight indicators, we distinguish the type of line in the graph: dashed lines show index values resulting from less than eight indicators, otherwise the line is solid. The graph provides a multidimensional representation of the values of each indicator in 2012, as reported in the results table.

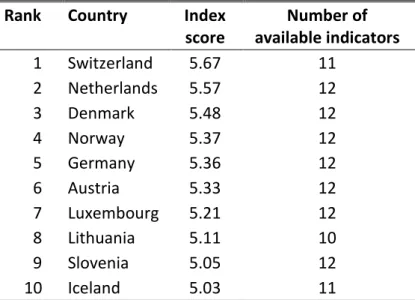
The 10 countries with the World’s Best Situation on the Youth Labor Market
The red line provides additional information about the average of the top 20 performing countries. A detailed look at the graph along this timeline tells an interesting story: the economic crisis or so-called Great Recession that started in 2008 could have negatively affected the general state of the labor market (note the average decrease since 2008), but that situation varies from country to country. While Denmark shows a negative trend, the Great Recession has no visible impact for Switzerland and there is even a small increase in Switzerland's KOF YLMI score over time.
Similar values at the aggregate level – the main KOF YLMI score – do not necessarily mean equal conditions in the labor market. At first glance, this spider web confirms our previous observation: despite being very close (and high). Finally, all three countries are above average in fixed-term employment and atypical working hours.
With regard to the Education category, one can easily see a particular pattern: the Netherlands is the best performer on "Formal education and training rate," but scores below average on "Skills mismatch." Switzerland shows a mirror-reversed situation. 12 Unfortunately, we have no internationally comparable value for Switzerland for the long-term unemployment rate.

The 10 countries with the World’s Best-Performing Education Systems
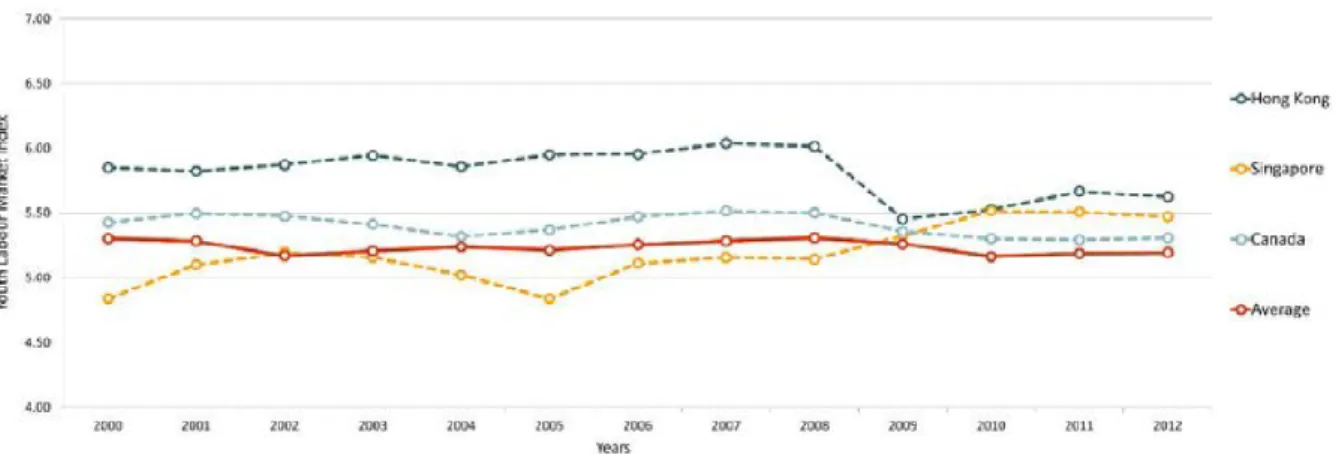
As can be seen from the factsheets presented earlier, the range of available KOF YLMI indicators for the best performing countries on PISA is in some cases quite limited. Although it covers a limited set of indicators, the graph suggests some trends regarding the youth labor market leaders among the top ten performing countries in PISA. This is likely a response to the Great Recession, and the index indicates recovery in subsequent years.
Singapore has been on an upward trend since 2005, and in this case, the Great Recession does not seem to have affected the youth labor market. Unfortunately, as already indicated by the dashed lines in the previous figure, these countries provide only a small set of indicators. 13 A possible solution could be to compare these countries on a limited set of commonly available indicators.
Apart from the vulnerable employment relationship and the involuntary part-time worker rate, we unfortunately have no indicators that allow us to make general statements about working conditions in these countries. While the country performs amazingly in terms of casual unemployment rate and in terms of the incidence of long-term unemployment, Singapore is ranked the lowest in terms of relative unemployment ratio.
Comparing the Top-performing Countries
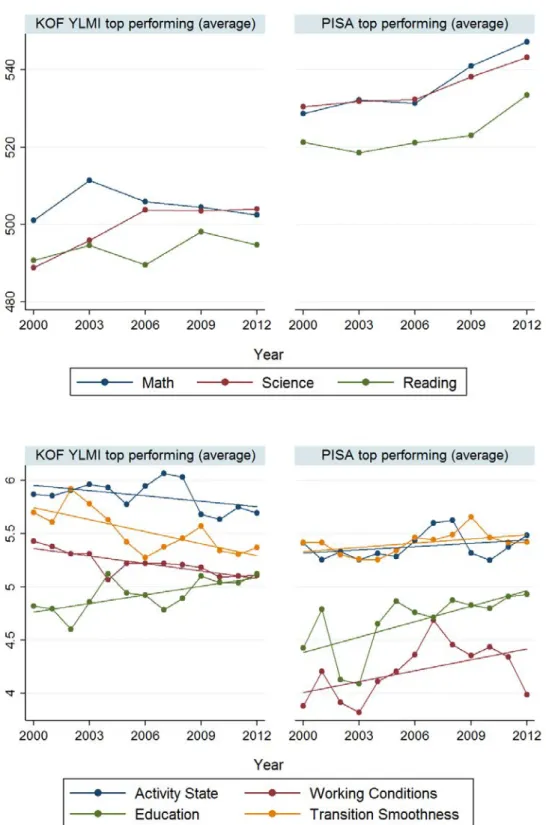
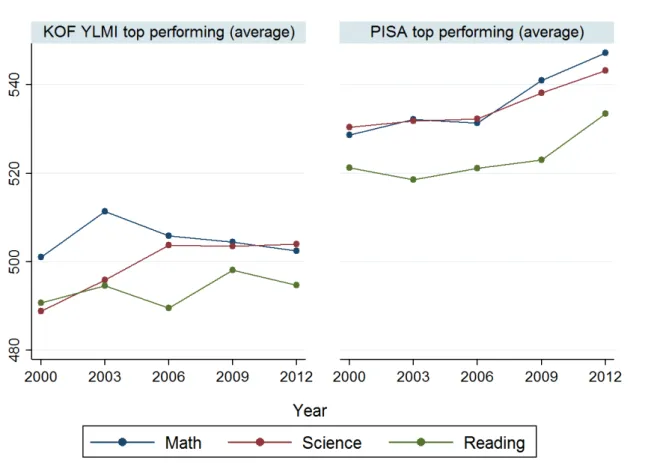
The low value of working conditions in the PISA group is particularly remarkable, while Activity State performs particularly well. For Activity State, the KOF YLMI group shows a slight upward trend until 2007, and after 2008 the situation suddenly deteriorates. The impact of the Great Recession appears to be stronger in the KOF YLMI group than in the PISA group, which is recovering quickly.
Finally, the PISA group's striking downward trend after the Great Recession in working conditions is alarming, although the relatively limited availability of data for that category mainly points to the need for additional research. By looking at the trends, we can see how the already good position of the PISA group continues to improve over time, especially since 2006. The KOF YLMI group, on the other hand, shows a relatively stagnant trend, with only improvements in the Science subject.
Conclusion and Outlook
Knowledge, Skills, Competence: European Divergences in Vocational Education and Training (VET)—The English, German and Dutch Cases.” Oxford Review of Education. Vocational education and training in Finland - Vocational competence, knowledge and skills for working life and further studies. Apprenticeship - Dual vocational education and training in Austria: modern training with a future." Vienna: Federal Ministry of Economy, Family and Youth.
A Skill Beyond Schooling Korea." OECD Review of Vocational Education and Training, OECD Publishing. Vocational Education in Iceland." Thessaloniki: European Center for the Development of Vocational Training (Cedefop). Prior to this, Renold was Director General of the Federal Office for Professional Education and Technology (OPET) until June 2012.
Before becoming Director General, she was Head of OPET's Vocational Education Department and Director of the Swiss Federal Institute for Vocational Education and Training (Teacher Education). During his career, Renold has launched several key initiatives that have had a major impact on the vocational education and training system in Switzerland. She holds a master's degree from the Department of Sociology at the Faculty of Arts at the University of Zurich, Switzerland. She is currently working on her Ph.D. in the sociology of education with a focus on comparative research on vocational training (EUD), as well as its results on the youth labor market.
She is currently engaged in identifying the success factors and barriers for labor market-oriented education system reforms through the Center for the Economics and Management of Education and Training Systems (CEMETS).