The effects of environmental regulations on the competitive performance of industries have been the subject of heated debate since the beginning of the environmental movement in the early 1970s. In particular, the study identifies a pollution tax threshold where a higher tax rate corresponds to productivity higher.
Dependent variables
The data used in this study comprise an unbalanced panel covering 768 four-digit industry sectors and 437 locations over a period of 12 years.
Market potential
The Market Potential Index varies by city, as the distances from each city to the provincial capitals vary by geographic coordinates. In addition, I also include the GDP of the province where the industry is located as a separate variable to capture the agglomeration effect of production activities.
Industry pollution intensity
A binary variable High Pole is equal to 1 for the most polluting industries (average pollution intensity above 4 tons/1000 RMB output). The variable Medium Pol is equal to 1 for the medium polluting industries (average pollution intensity between 2 and 4 tons/1000 RMB output).
Production costs
Capital costs are incurred for the purchase of land, buildings, construction and equipment to be used in the production of goods. I include additional variables to account for the varying density of transportation and telecommunications facilities in a region.
Special Economic Zones
Total Factor Productivity (TFP) captures companies' technology and managerial efficiency to determine production costs. The parameter β2 represents the "composition effect": a negative (or positive) coefficient means that more (or less) pollution-intensive industries are located in regions with low environmental requirements.
Preliminary results
To interpret the total effect of the pollution charge on the output of polluting industries, the coefficients of the variable ln charge and the pollution charge interactions must be read together.3 The results show that an increase of the effective pollution charge by 10% is correct . - accompanied by a decrease of about 2% in the total output of the most polluting industries. Both the volume effect and the composition effect of the pollution charge are larger in the models with fixed effects for city and industry.

New technology
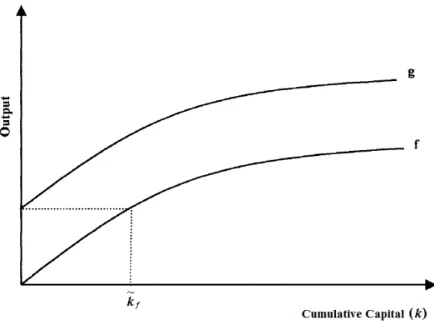
Therefore, the agent produces without any government intervention until the marginal product of waste reaches zero. In the initial period after the introduction, the agent has a larger cumulative investment in f than in g. Productivity rises again as the producer gradually accumulates capital kg dedicated to the new technology.
A shift to the new technology results in a short-run decrease in productivity due to technology-specific capital accumulation. The fear of short-term productivity loss prevents companies from using a cleaner and more efficient technology.
Environmental regulations
To summarize, the model allows for conditions under which a government intervention induces firms to switch to a more efficient technology and thus increases productivity in the long run, even though output in the short run may be compromised. First, instead of assuming identical agents, the model does not impose any specific constraints on the agents' production function and can therefore be applied to an economy with heterogeneous firms. Second, contrary to the technology spillover effect hypothesized in Mohr's paper, the model views capital as cumulative and technology specific.
Finally, the model extends the analysis to take into account various forms of government intervention, including technological standards and pollution taxes. The model predicts that a higher pollution tax can induce companies to adopt new and cleaner technologies, resulting in an increase in productivity.
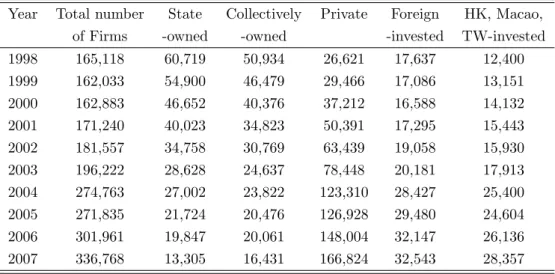
Annual Survey of Industrial Firms
The company-level information on industrial enterprises is taken from annual surveys conducted by China's National Bureau of Statistics (NBS). The data used to calculate the pollution charge, industrial pollution intensity and other environmental variables is collected from the China Environment Yearbooks from the years 1998 to 2007. In this section I describe the source of the data and the calculation of the key variables used at the analysis.
In particular, the unit of observation in the dataset is a company defined as a legal entity in China. It is important to note that most firms in the dataset have only one plant because environmental regulations are specific to firm locations, so potential measurement error arising from firms in multiple locations is negligible.
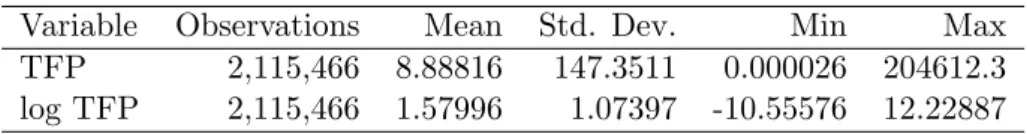
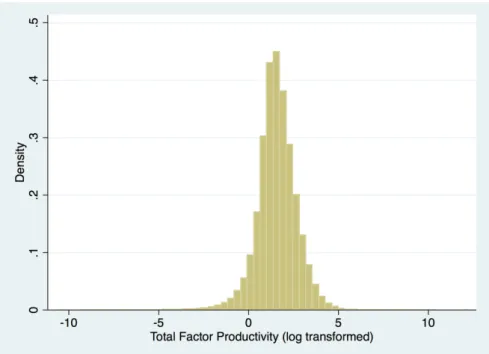
Dependent variable: Total Factor Productivity
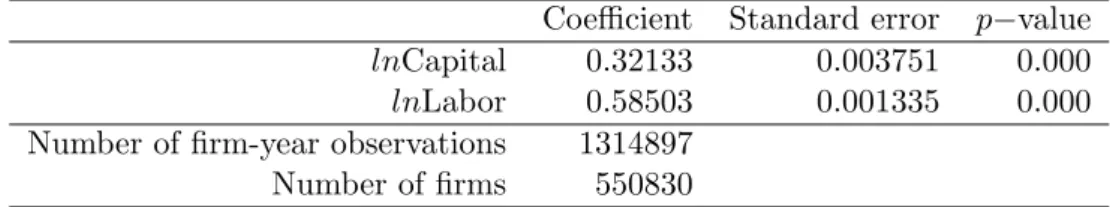
However, Ackerberg et al. 2006) point out that LP estimation suffers from collinearity problems in the first stage of estimation. Log laborlit are used as free variables in the sense that the choice of firm has no effect on the firm's future profits. Since annual investments are not directly observed in the data, I calculate investment iit as net fixed capital at time t minus net fixed capital in the previous period.
After estimating the share of capital and labor inputs in the firm production function, I calculate total factor productivity as the remainder of firm value added. 5 It is common in the literature to use the wages and employment benefit payments to use labor input in the calculation of TFP.
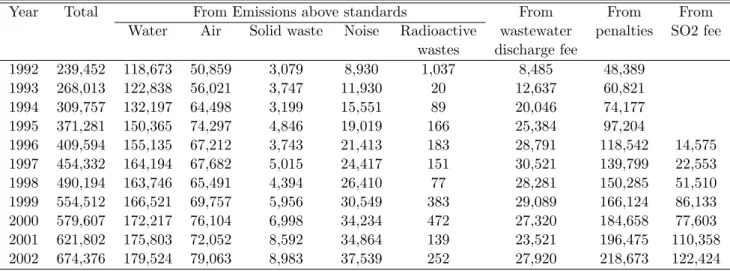
Effective pollution levy
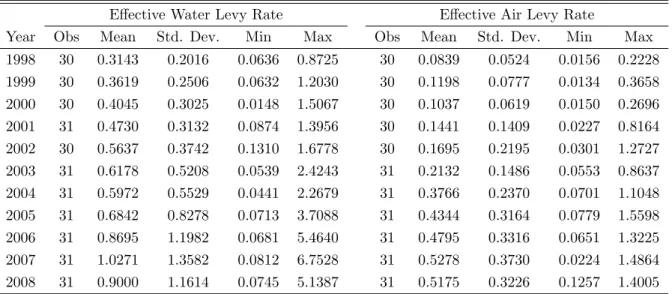
For the period before 2003, I calculate the total air pollution charge as the sum of above-standard air pollution charges and the SO2 emission fee reported in the China Environment Yearbook. To remove the effect of inflation over the years studied, I adjust the effective pollution charge rates by the provincial producer price index (PPI), released by China's National Bureau of Statistics. The water pollution charge per unit of polluting substance is consistently higher than the air pollution charge.
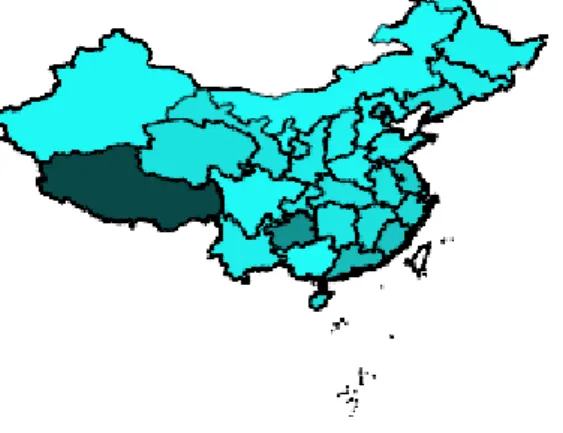
With the exception of the Tibet Autonomous Region, the effective pollution tax rate is correlated with income levels in most provinces—coastal regions in China, which are more economically developed, tend to charge higher effective pollution taxes.
Pollution Emission Standards
Similarly, China issued the Integrated Air Pollutant Emission Standard in 1996, followed by a series of air pollution emission standards targeting specific industries and sectors. As of June 2012, the Chinese Ministry of Environmental Protection recognizes 80 local pollution emission standards issued by provincial governments. To quantify the effects of pollutant emission standards on productivity, I construct binary indicator variables (sometimes referred to as “dummy” variables) based on industry-specific national and local pollutant emission standards.
I also create lagged variables for the years after a standard is published and put into effect. For integrated water and air emission standards that apply to all industries nationwide or in a province, the dummy variable equals 1 in the year the standards are introduced and lag dummies equal to 1 for subsequent years.
Industry pollution intensity
This section explains the empirical models to estimate the effects of pollution charges and emission standards on the productivity of firms. It also reports the estimation results for the two policy measures - the pollution charge and emission standards, respectively.
Pollution levy
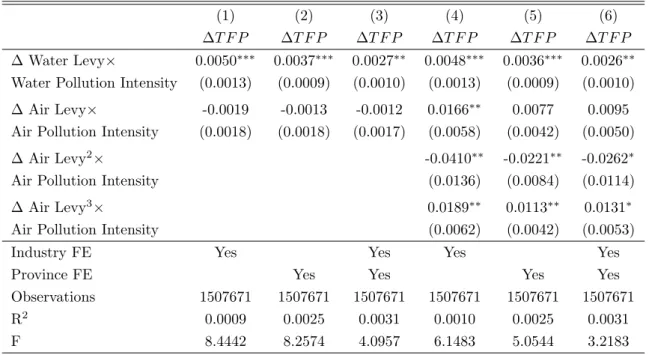
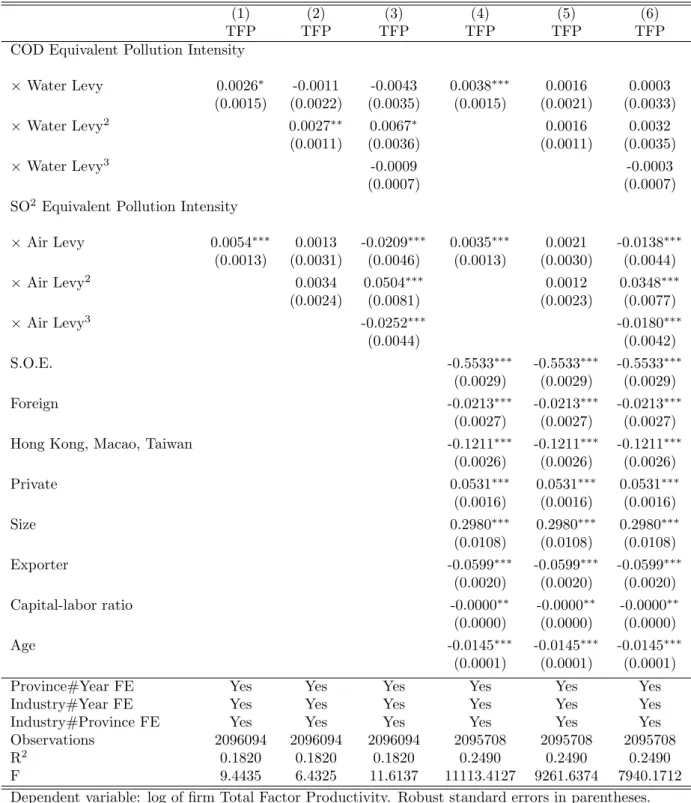
I include the equivalent water and air pollution intensities interacting with the linear, quadratic, and cubic forms of the effective pollution charge. In column (2), the quadratic term of the effective water pollution charge interacting with pollution intensity also shows a statistically significant relationship with productivity at a 5% level. The effect of the air pollution charge on total factor productivity indicates a positive correlation.
The interaction between industry pollution intensity and the quadratic and cubic terms of the air pollution tax is also significantly correlated with corporate productivity. When the water pollution tax rate is between RMB 0.4 and RMB 1.2, productivity increases with the pollution tax.
Pollution levy - First difference
For a pollution tax rate below RMB 0.4 per thousand RMB of output,10 an increase in the pollution tax is associated with a decrease in total factor productivity. And a second turning point appears around RMB 1.2 beyond which productivity decreases with the air pollution fee again. The positive and bell-shaped relationship between the rate of water and air pollution and productivity may seem paradoxical at first glance.
However, when the pollution tax rate is above a certain level, firms may find it more profitable to switch to new, cleaner technologies, resulting in reduced pollution and increased productivity. The change in the water pollution tax interaction is positively and significantly related to the change in total factor productivity in all specifications.
Pollution emission standards
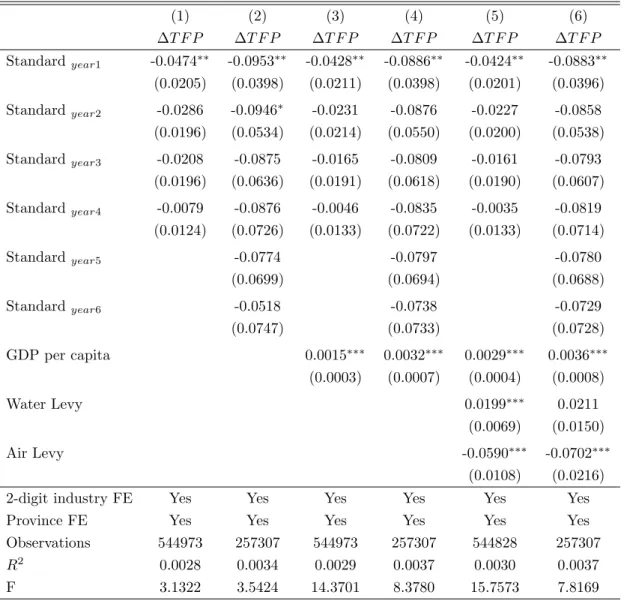
A one-unit increase in water duty intensity is associated with an increase in total factor productivity of about 0.3%–0.5%. To control for time-varying industry and regional trends that might affect productivity and pollution emission standards, I include two-digit industry dummies and province dummies in the differentiated question to represent unobserved trends at the broader sector level. To control for these factors, I included the following control variables in some of the specifications: provincial GDP per capita, effective water and air pollution charges as indicators of provincial environmental demands.
The coefficient suggests that the issuance of an industry-specific pollution standard is associated with a decrease in total factor productivity of about 4–10 percentage points for the affected industry in the year the standard takes effect. The results confirm that a pollution emission standard may lead to an initial decrease in productivity, but the negative effect diminishes in the long run.
Endogeneity
The empirical analysis of the relationship between the effective pollution levy and farm productivity finds a positive or non-linear correlation for the water levy. On average, a one-unit increase in the pollution levy is associated with a 0.6% decrease in total factor productivity. The pollution tax system is based on universal self-reporting, with verification by local regulatory authorities.
The water pollution fee varies according to the concentration of hazardous substances. chemicals and volume of wastewater. 11 NEPA, SPB, and MOF (National Environmental Protection Agency, State Bureau of Pricing, and Ministry of Finance), 1991, A Notice of Adjustment of Wastewater Pollution Discharge Rates and Noise Pollution Rate Rates. The new tax policy, which came into force on 1 July 2003, resulted in a sharp increase in the total pollution tax.
According to the new pollution fee regulation, plants must pay taxes on the sum of the three highest calculated pollution equivalents.