Smart-working: Work Flexibility Without Constraints
∗Marta Angelici, Bicocca University and Dondena
Paola Profeta, Bocconi University and Axa Research Lab on Gender Equality, Dondena
April 2022
Abstract
Does removing the constraints of time and place of work increase the utility of workers and firms? We design a randomized experiment on a sample of workers in a large Italian company:
workers are randomly divided into a treated group that engages in flexible space and time job (which we call “smart-working”) one day per week for 9 months and a control group that continues to work traditionally. By comparing workers in the treated and control group, we find causal evidence that the flexibility of smart-working increases the productivity of workers.
We estimate a decrease of days of leave by 0.2 standard deviation on average per month and a significant increase of monthly productivity equal to 0.22 standard deviations in specific months.
We also find a sizeable improvement of well-being (satisfaction with life in general increases by 0.29 standard deviations) and work-life balance and we observe that also men increase the time dedicated to household and care activities.
JEL codes: J16, J22, J24, L2, M54
Keywords: Smart-work, wellbeing, work-life balance, productivity.
∗Corresponding author: [email protected]. We thank Vittoria Dicandia, Annarita Macchioni and Gio- vanna Mazzeo Ortolani for research asbsistance. We are grateful to Massimo Anelli, Nicoletta Balbo, Francesco Billari, Marco Bonetti, Marina Brollo, Heejung Chung, Marilisa D’Amico, Daniela Del Boca, Giovanni Fattore, Vincenzo Galasso, Nicola Gennaioli, Giulia Giupponi, Anne-Marie Jeannet, Marco Manacorda, Monica Parrella, Joanna Rickne and Almudena Sevilla for their suggestions. We also thank participants of ELENA, AisP, Alp-Pop, EGEN-Stockholm conferences, the workhsop on gender and economics at the University of Luxembourg, seminars at Bocconi University, Dondena, Discont, University of Bologna, Ca’ Foscari University of Venice, UCL Quantitative Social Science, Erasmus University-Tinbergen Institute. Part of the data was collected under the ELENA project of Italy’s Department for Equal Opportunities and the Dondena Center of Bocconi University, financed by the Rights, Equality and Citizenship (REC) Programme of the European Union- JUST/2014/RGEN/AG/GEND/7803. This study is registered in the AEA RCT Registry and the unique identifying number is AEARCTR-0002979. All errors are ours.
1 Introduction
The outbreak of the 2019 novel coronavirus is threatening the growth of the economy worldwide.
To contain the spread of the coronavirus and curb the contagion, workers have been allowed to work outside their workplace, thanks to the use of technology. The coronavirus induced home-office as the only way to continue working during the pandemic and avoid the collapse of the economy.
Working from home is part of the more complex and general process of work flexibility. A new organizational model of work, which we call “smart-working”, has been introduced as a prominent modern work practice: workers can work outside their workplace and with a flexible time schedule.
Smart-working is a fully flexible work arrangement, with the capacity to adapt quickly and intel- ligently to different situations. Smart workers agree with their supervisors to perform their work activities for a defined period of the working week outside of the company’s physical workplace (at home or in another place) and according to a personalized time schedule. During this period, there are no specific constraints on the time or location of work. Thanks to the use of technology, smart- workers may perform the same duties and activities as those of ordinary workers and achieve the same set targets and results while choosing a workplace and time schedule that are more convenient for both the activity to be performed and their personal needs. Time and space flexibility creates a new work organization, which is based upon results rather than workplace presence and work during particular hours.
Despite the massive interest in recent months, related to the spread of working from home in times of pandemic, we still know very little about the economic effects of smart-working in normal times.
The available evidence, which consists only of case studies, management surveys on specific sam- ples of workers and ex post descriptive analyses, does not allow us to appropriately identify the economic effects of smart-working. This paper fills this research gap and provides causal evidence that smart-working is economically desirable.1
We design a randomized experiment to study the causal effects of the introduction of smart-working in a large traditional company in the multi-utility sector in Italy. The company has never used this
1A growing number of papers is studying how the pandemic is affecting jobs, by studying how many workers are working from home (Brynjolfsson et al.,2020) and which jobs are done or can be done from home in different countries (Dingel and Neiman(2020);Hensvik et al.(2020);Boeri et al.(2020)). Their scope is to describe the changes in work arrangements produced by the pandemic, rather than to assess their causal impact on outcomes. Interesting insights on the changes in the nature of work are found byDeFilippis et al.(2020).
approach before. Following the methodology of randomized control trials (RCTs), we select a sam- ple of 310 workers (containing both white- and blue-collar workers) and randomly divide it into two groups; the workers in the first group (the treated group) have the option to work “smart” (i.e., with no constraints on the place or time) one day per week for 9 months in agreement with their supervisors, while the workers in the second group (the control group) continue to work tradition- ally. We are interested in three major outcomes: productivity, well-being and work-life balance. We use objective measures of workers’ performance calculated monthly by the firm (e.g., the number of dossiers processed during the month) and the number of days of leave of each worker. We comple- ment this information with questionnaires administered to each worker and to his/her supervisor both before and after the treatment. The questions posed in the questionnaires capture several dimensions of self-assessed productivity, well-being and work-life balance. Given the randomization of the two groups, we are able to identify the causal effect of the treatment on our outcomes of interest.
Our results show that, for the same number of hours of work, workers involved in smart-working increase their productivity compared to that of workers who continue working traditionally; this outcome is true whether productivity is captured by an objective measure or if it is measured ac- cording to several specific productivity traits (e.g., the compliance with deadline) reported by the same worker or by the supervisor. The effects are sizeable: we estimate a decrease of days of leave by 0.2 standard deviation on average per month, a significant increase of monthly productivity in month seventh and eigth which corresponds to about 0.22 standard deviations and an increase in meeting deadlines which corresponds to 0.4 standard deviations when self-reported and to 0.57 when reported by the supervisor. Smart-workers are also more satisfied with their social life, free time and life in general (the increase of satisfaction in the different dimensions corresponds to a range between 0.29 and 0.46 standard deviations). They claim to be more able to focus, make decisions, appreciate their daily activities, overcome problems and experience reduced stress and loss of sleep.
Interestingly, when we consider work-life balance, we find that, against the stereotype that men use flexibility for performance purposes and women for work-family balance, men also increase the time engaged in household and care activities. Further analysis show that commuting time plays a limited or zero role, thus suggesting that smart-working differs from telecommuting.
Our results suggest that promoting smart-working is an effective way to increase productivity and
improve well-being and work-life balance. Moreover, we provide evidence that smart-working does not have heterogeneous effects by gender.
The high flexibility of smart-working (flexible time schedules, flexible places of work and flexible periods of flexible work to be used during the workweek) makes it a very appealing option for both employers and employees of a large category of jobs. Our results based on one day per week of smart-working (the standard use in normal times) are not directly comparable with the Coronavirus emergency which induced working from home for entire weeks, rarely with flexible time schedules.
However they will be useful for the post-Covid, as the experience of working at distance is stimu- lating an increase of work flexible organizations for part of the workweek.
Work flexibility is not a new concept. Before Covid-19, the traditional practice of working from home under the same wage conditions and under the strict control of the employer, which is known as telecommuting, was used by approximately 17% of workers in Europe (Eurofound, 2017) and 13% of workers in the US (Frazis,2020). During the pandemic, in July 2020, about 50% of workers in Europe report that they work from home at least part of the time and a third of them exclusively (Eurofound,2020). Telecommuting is only one way and one dimension of work flexibility, which is mainly based on replacing the workplace with the home, but maintaining the rigid control of the employer on the location of the work and the precise hours. Telecommuting is compatible with a limited number of jobs, mainly routine jobs. New and more complex forms of flexibility have begun to spread, including flexible location and flexible work times, which are highly appreciated by workers. According to the Sixth European Survey on Working Conditions carried out by the European Foundation for the Improvement of Living and Working Conditions (Eurofound, 2017), workers appreciate having control and freedom over where and when to work, i.e., the possibility of working without the control of the employer at a place that is different from both the office and home, as well as a flexible time schedule. More than 20% of the workers (men and women) interviewed by the survey reported that their working hours do not fit with their family and social commitments. While working from home does not change this perception in a statistically signif- icant way, having some freedom to set one’s start and finish times and arrange breaks during the working day increases the perception that one’s working hours fit in with their family and social
commitments by approximately 20%.2
After decades of experience with telecommuting, there is a growing consensus among major in- ternational organizations (OECD, 2016), that an effective improvement of work-life balance and productivity, which are the two major goals of work organizations, passes through more complex and different flexible work arrangements, based on the removal of the constraints on the location and scheduling of work.
Flexible work arrangements are introduced through individual or collective bargaining, which, in several countries, are regulated by laws (Hegewisch et al.,2009). In 2017, Law 81 introduced in Italy an appropriate regulatory framework for the implementation of smart-working, defined as a “new method of forming a subordinated employment relationship without precise constraints on time or location of work and with the use of technological tools in the workers’ duties and activities”. As smart-working was not regulated before in a structural way, Law 81 provides an important frame- work for the success of its implementation. Italy provides an interesting context for our analysis:
while the country is characterized by a general low flexibility in work organization, firms started to show some level of interest in smart-working as early as ten years ago, well before Law 81, although this approach was limited to very small groups of workers (typically, fewer than ten).
Smart-working is associated with a trade-off. On the one hand, there are potential gains from the flexible work locations and hours, which go beyond those associated with telecommuting. By work- ing from home, telecommuting allows workers to reduce their commuting costs and firms to optimize their costs. The reduction in costs is higher with smart-working than telecommuting, since the lat- ter one requires inspections and a constant monitoring of the workers at distance.3 Moreover, home is only one possible alternative to the office, and not necessarily the more convenient alternative;
the conflict between work and family may even become more visible when employees work from home for caring purposes. It may also be the case that, for the same reduction of commuting time,
2A report by Gallup (Gallup,2017) based on interviews with more than 5,600 US employees confirms that the flexibility of hours is of growing importance and suggests that one’s home is only one possible alternative to the workplace. Approximately 37% of the surveyed employees declared they would change their job for benefits related to a flexible working location (for part of their working week), and more than half of office workers (54%) said that they would leave their job for one that offers flexible work time (Gallup,2017). Among the millennials, these reported percentages increased to 50% and 63%, respectively.
3Firms may reduce lighting costs, summer and winter climatization costs, corporate canteen costs, cleaning costs, etc. In some cases, the place of work itself becomes “smart” as offices become flexible spaces where workers perform part of their activities and have free access to all technologies; such spaces often have novel physical layouts, including mindfulness zones and areas for team-working and communicating. The extreme case is the "no fixed desk" office.
the double gain of improving work-life balance and increasing productivity may be better obtained when workers work at a library, at a park, at a difference place close to their residence, or at a location that may change without the control of the employer, instead of home, where their family duties may interfere with their job activity. Moreover, removing the fixed daily start and finish times gives employees the possibility of better managing their time according to their preferences;
they can enjoy long or short breaks for personal or family reasons, and they can adapt their work hours to life changes without altering their compensation. This increases their satisfaction and work-life balance, which ultimately makes this arrangement desirable to workers. In parallel, firms may optimize by rewarding these employees based on effective productivity rather than on the par- ticular hours worked. Firms may also gain from the retention of talent and the reduction of days of absence, thus increasing their competitiveness. Additionally, time flexibility in the labor market for all workers (men and women) contributes to reducing the rewards of long hours, work at particular hours and inflexible schedules, which are considered a major driver of gender pay gaps (Bertrand, 2018) and may thus represent a step towards the “last chapter of the grand gender convergence”
(Goldin,2014).
On the other hand, smart-working raises concerns about the organizational process, the produc- tivity of workers and their well-being. Some of these concerns are shared with the telecommuting experience; for example, working outside the workplace may reduce the commitment of workers, who can then take advantage of the flexibility to take part in activities different from work. More- over, by reducing interactions among workers and between workers and supervisors, there is a risk of isolation and of reduction in productivity, particularly in jobs with high interactions. Costs of coordinating members of teams who are no longer co-located may also be substantial. Finally, blurring the boundaries between work and home may increase the hours of overtime, the levels of employee stress and worsen work-life balance. These concerns are even stronger in the case of smart-working, when the location of work can be changed by the employee without the control of the employer. Moreover, the lack of rigid daily start and finish times can amplify the reduction of workers’ commitment, reduce their regular activity (in absence of strict rules on time) and increase the risk of overworking.
How the introduction of smart-work addresses this trade-off is an open question that we address empirically. Our results are consistent with the idea that smart-working represents the removal of
a constraint that is desirable for employees and useful for employers. In the presence of rigid work hours, when workers choose their amount of work hours, they face an implicit constraint on the hours of the day that can be dedicated to the work activity. This constraint may be binding for those workers who gain utility from taking a break to adapt to their personal and family needs; such workers have to choose whether to work part-time and hence decrease their wages, to not meet their needs or to be absent from work. Any option is costly. The removal of the time constraint increases the utility of these workers such that they can still work full-time and accommodate their needs by choosing a personalized time schedule. Their increased satisfaction and better time management may also increase their productivity during working hours. To the extent that employers value the output of the workers rather than the work at specific hours, smart-working represents a net gain.
The paper is organized as follows. The next section presents a literature review, section three de- scribes the experiment, section four presents the data, section five describes the empirical strategy, section six shows the results, section seven discusses the results, section eight presents additional analyses and and section nine concludes. A set of appendixes complements the analysis of the main text.
2 Literature Review
Previous research has studied how flexible work affects productivity, well-being and work-life bal- ance. Productivity is the central dimensions in studies on different management practices (see literature reviews in Walker (1887), Leibenstein (1966), Syverson (2011), Gibbons and Henderson (2013), andBloom and Sousa-Poza(2013)). Only few of them have performed randomized experi- ments that can identify the causal effects of managerial procedures on productivity. These papers mainly consider routine jobs in white collar occupations and they analyze the emergence of negative spillover effects for employees working in a team. More precisely,Dutcher(2012) performs lab-based experiments exploring routine and non-routine tasks with and without remote monitoring, and ob- serves that the more routine ones are negatively affected by mimicking a home-based environment.
The author conjectures that the effect depends on the lack of peer and manager effects, which have been shown to be important in low-level tasks in field environments by Falk and Ichino (2006), Bandiera et al. (2005), andMas and Moretti (2009). Other papers use natural experiments in spe-
cific contexts to exploit the impact of work flexibility on productivity and the emergence of spillover effects: Choudhury et al.(2021) uses a natural experiment in the US States Patent and Trademark Office to show that a work-from-anywhere policy improved productivity. However, even in this case, negative spillover effects emerge on workers’ absenteeism among those who remained in the office (Linos,2018). Emanuel and Harrington(2020) study natural experiments in call-centers and find that the positive treatment effect of remote work is offset by adverse selection into remote jobs.
Negative spillover effects are also identified by Battiston et al.(2017) in the context of emergency phone operators.4
An important contribution in this literature is Bloom et al. (2014), which considers the impact of working from home on productivity and sastisfaction of workers. The paper performs a random- ized experiment on a sample of call center employees of a large Chinese travel agency, randomly assigned to two groups: telecommuters and office workers. The researchers find that telecommuters have higher productivity than do the other workers and have higher work satisfaction. After the experiment, when workers were allowed to choose whether to work at home or in the office, selection effects almost doubled the gains in performance. This paper considers a specific work environment, namely, call centers, where all workers perform similar and routine-based tasks. In this context, as observed byMas and Pallais (2017), the majority of workers do not value scheduling flexibility, while many of them, especially women with young children, value working from home.5 However, as suggested byDutcher(2012), work flexibility may affect the performance of routine and non-routine tasks differently. Non-routine jobs may take full advantage of flexibility, as they require a higher individual concentration than do routine tasks and are less exposed to isolation risks. Moreover, as we have already emphasized, current flexible work arrangements go beyond telecommuting, by including flexible time schedule, flexible place of work and a flexible period of flexible work to be
4Other attempts to measure the positive relationship of flexible work arrangements on productivity use an objective index such as absenteeism (Koopman et al.,2002) and output per hour (Golden,2012). Self-declared productivity is also positively related to flexibility (seeRiedmann et al.(2006)). However all these studies are not able to provide a causal analysis. The main reason is that they cannot control for other variables affecting productivity and cannot establish whether flexible working increases productivity, or whether companies with high productivity are more likely to introduce flexibility. The latter may also affect productivity through changes in workers’ well-being and work-life balance, which are therefore important to analyze in parallel.
5For a review on workers’ preferences over alternative arrangements see Mas and Pallais (2020). Interesting evidence on workers’ preferences for flexibility is also reported by Chen et al. (2019) and Maestas et al. (2018).
Psychological factors (Lee et al.,2016) may also contribute to the performance outcome: smart-working may increase performance if workers are “happy” to control their own work schedules and work more effectively, with fewer days of sickness and leave (Leslie et al.,2012).
used during the workweek, which we call smart-working. Yet, there exists no causal evidence on smart-workers. Similarly, randomized experiments in firms involving a variety of job types in a developed economy are very rare.
Another outcome which has been analyzed in relation to flexible work is work-life balance. Kelly et al.(2014) examines the impact of a work-life balance training program randomized across branches of a large firm, observing significant reductions in employees’ work-family conflicts, and improved family time and schedule control. Labor sociologists (Schieman et al.,2009) have also studied the relationship between flexibility and work-life balance. As reviewed by Chung, the evidence on this relationship is mixed: on the one hand, flexibility may reduce work-family conflicts (Chung,2011, Kelly et al., 2011), while, on the other hand, it can create spillovers from work to home, blurring the boundaries between the two and increasing overtime hours of workers with negative impact on work-life balance (Golden and Wiens-Tuers,2006). The latter effect tends to be dominant for high- skill workers in large companies, which also offer performance-related pay and other arrangements that motivate workers to work longer and harder. A gender divide emerges: while flexibility is used by women for family-friendly purposes, it is used by men for performance purposes. The evidence shows that women are more likely to stay employed after the birth of their first child and increase their capacity to work when family duties multiply and thus enjoy better work-life balance. Men instead increase their work intensity and performance-related payments with no changes in family arrangements, and earn incremental income. Thus, traditional gender roles risk being strengthened further by work flexibility. Chung (Chung,2011) analyzes data for 28 European countries and shows that flexibility can have different impacts in different contexts: it is more beneficial for workers in job cultures with more hours worked (overtime), where men and women use it for family-friendly purposes, and the flexibility stigma is not strong. Other related outcomes, such as health and stress (Halbesleben and Buckley,2004,Moen et al.,2016) outcomes, have been investigated, with results showing a positive relationship between schedule control and organization of work.6 These studies however do not provide causal relationships.
Bloom et al. (Bloom et al.,2011) is one of the few papers bridging the gap between family-friendly workplace practices (which they call a ’soft’ policy) and firm productivity (a ’hard’ outcome). For
6A large body of literature has studied nonstandard work schedules and their impact on well-being and family conflicts (Liu et al., 2011). Smart-working one day per week, however, is difficult to compare to a nonstandard schedule.
a large sample of European and US firms, they find that once they control for the quality of management, there is no relationship between family-friendly workplace practices and firm produc- tivity.
3 The Experiment
We design and implement a randomized experiment to explore the effects of smart-working on pro- ductivity, well-being and work-life balance of workers. We focus on Italy, where smart-working is regulated by Law 81/2017 that includes specific provisions to encourage the use of smart-work as a way to promote work-life balance and to enhance competitiveness. The law includes protection of health and safety of workers and guarantees equal remuneration of workers. The organizational details are left to an agreement between the employer and the employee.7 According to the law, smart-work may be engaged in over continuous periods, on some days of the week or during some hours of the day, as agreed by the workers and the company. Personnel protection for both private- and public-sector employees is regulated by the National Institute for Insurance against Accidents at Work (INAIL).
We approached a large Italian company in the multi-utility sector and signed an agreement to design and implement smart-work as a pilot experiment. The company is listed on the Italian Stock Exchange and has 4131 workers engaged in various tasks. Workers are divided into blue- and white-collar types. Blue-collar workers perform tasks related to technical, electrical and mechanical installations and maintenance, while white-collar workers work at a desk and perform several types of procedures, write and conclude contracts, perform transactions, etc. While both time and space flexibility are available to white-collar workers, for blue-collar workers smart-work is mainly char- acterized by a flexible time schedule.
We designed the experiment in agreement with the firm’s senior management, who assented to all of our requests and recommendations. We randomized the sample after data had been anonymized by the company. We had complete access to the data used for the analysis and direct access to the surveys administered for the experiment. We also had daily contacts with the managers in charge of the experiment at the company and the management team.
7During 2017 and 2018, smart-working was also one of the work-life balance measures that gave companies rights to a tax relief.
Figure1shows the Consolidated Standards of Reporting Trials flow (CONSORT) that summarizes the flows of the experiment.8 We adopt the intention-to-treat approach (ITT), which we now ex- plain step by step.
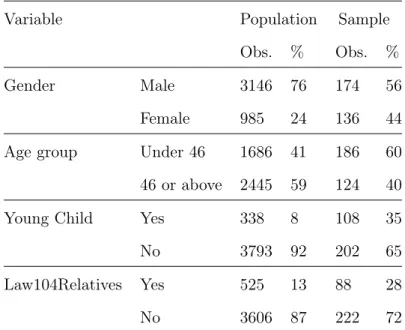
First, we extract our sample of analysis from the population of 4131 workers. We choose to over- sample women, workers younger than 46, workers with children under the age of three and workers with relatives who need special care, which gives them the right to reduce the number of hours worked, according to Italian Law 104/92 (Legislation on Support for the Disabled).9 In agreement with the firm, we decided to oversample these groups because survey evidence suggests that women and individuals with family care duties (caring for children, disabled relatives, etc.) are expected to need and benefit more from smart-working (seeGiammatteo(2009)). The firms was particularly interested in improving working conditions of these categories, expecting this to reflect also into their productivity.
Using these criteria, we selected 345 workers and asked them about their willingness to join the program. All of them were informed that they were participating to a pilot project and that only a part of them, resulting from a random process implemented by external academic experts, was going to receive the treatment, i.e. the possibility to use smart-working. Consensus was required.
The proportion of those who did not agree was 10%, which in experiments of this type is considered a reasonable number (Jacobsen et al., 2012). As a consequence, our final sample consists of 310 workers. Among them, 86% are white-collar workers and 14% are blue-collar workers.10 There are no seasonal workers. Table 1 summarizes the characteristics of our workers, and compares them with those of the total population of workers at the firm. Appendix F provides detailed information on the job description of each worker in our sample.11
8Randomized controlled trials can be affected by two major complications: noncompliance and missing outcomes (Gupta,2011). The more suitable approach is to perform an intention-to-treat (ITT) analysis, which includes all randomized subjects. It ignores noncompliance, protocol deviations, withdrawal, and anything that happens after randomization. The resulting estimate of the treatment effect is generally conservative because of dilution due to noncompliance. Full reporting of any deviations from random allocation and missing responses is essential in the assessment of the ITT approach, as emphasized in CONSORT (Moher et al.,2001).
9Law 104/92 allows workers with relatives who need special care to have a reduction of hours of work at the same wage. The reduction is valid as long as the condition of caregiver exists.
10The analysis is performed also on the two sub-samples of white collar and blue-collar separately. See Appendix G.
11Table F.3 in Appendix F illustrates the responses of white- and blue-collar workers to questions in the pre- experiment questionnaire related to dimensions considered crucial for flexible jobs using O*net characteristics (see Goldin(2014)): time pressure (proxied by the answer to the question “do you comply with the predetermined deadlines of your responsibilities at work?”), contact with others and interpersonal relationships (proxied by the answer to the question “do you feel like having a useful role in your work life?”) and freedom to make decisions (proxied by the
Afterwards, we randomly split the above 310 workers into two subgroups, consisting of 200 and 110 workers, respectively: the first group was to engage in smart-working (the treated group) and the second continued to work according to the preexisting arrangements (the control group).12
Based on the experience of other companies that have already implemented smart-working and after an assessment of the company, we defined the treatment as one day of smart-working (flexible place and time of work, chosen by the worker) per week, not allowed to be subdivided, and to be planned in agreement with the company on a weekly basis for 9 months starting on October. Given their flexibile schedule during this day, workers’ availability is guaranteed within the working day. The day of smart-work does not need to be the same for all workers and can change from one week to another. The total number of smart-work days amounts to 4595 days for 200 employees.
During the smart-working day, workers are available (by phone or mail), unless differently decided with the supervisor. However the important feature of the smart-working day is that the worker performs the task assigned to him/her, independently from the rigid control of the supervisor on the precise hours spent working. It is the nature of smart-working that there is no precisely defined rule on the time of working. Thus, it may be possible that he/she works less hours than the normal time or more (we define this a case of “overwork”, see Section 7 for specific analyses on that). Smart-work also applies to workers who are in team. We are aware of the possible negative spillover effects that smart-work may have on workers in a team, and thus we will carefully assess whether they emerge during our experiment (see Section 6.5 and Appendix E). Note that team work means that there is a task to be performed by a team of workers rather than individually assigned, with allocation of sub-tasks and interactions among workers, which does not necessarily mean that workers have to spend all the working time in the same place at the same time.
Smart-workers use the same IT equipment, perform the same tasks, and are compensated under the same pay system as are workers belonging to the control group. The only difference between the two groups is the flexible arrangement of time and place for one day per week. Computer equipment was provided for the duration of the treatment to treated group’s workers who did not have it. The respective workers knew that they would have the computer only for the duration of the experiment;
answer to the question “do you feel capable of making decisions?”).
12As each treated worker had to be provided with a computer and a maximum of 200 computers were available due to budget constraints, we decided to maximize the number of treated workers. As a consequence, treated and control groups had different sizes.
thus, we do not expect this to affect their perceived status.
The randomization of workers, performed by us in agreement with the firm, is based on gender (male and female), age groups (27-45 and 46-68) and type of job (white-collar and blue-collar). The combinations of these characteristics result in 8 strata. For each stratum, we randomly assign 65%
of the individuals to the treated group and the remaining 35% to the control group.
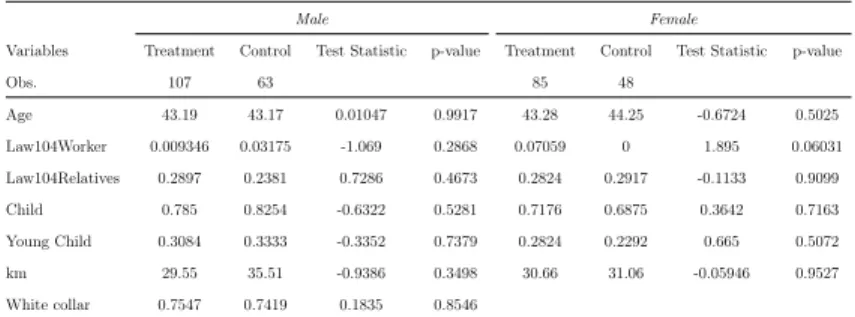
In Table2, we compare treated and control groups’ workers. The table confirms that the two groups are not significantly different in any of the observable characteristics, namely, gender, age, whether the worker benefits from Law 104 or has a relative who benefits from it, whether the worker has children and if he/she has children younger than 3 years old.
The firm communicated to each worker the results of the randomization. The Human Resources director informed workers and supervisors. Again, workers had the possibility to withdraw. Within the treatment group, 191 workers received the treatment, while 9 did not receive it, as they de- clined to participate. Within the control group, 2 workers left during the experiment. These small numbers do not pose a concern for the validity of the experiment. Instead, we have to take into account the attrition rate, i.e., the failure to follow up: 20% of our workers did not reply to the second questionnaire. Among them, 6% belong to the treated group and 14% to the control group.
Attrition is common in field experiments and attrition rates between 20 and 40 percent appear to be the norm in social experiments (Ashenfelter and Plant (1990); Hausman and Wise (1979);
Heckman and Smith(1995);Krueger (1999); Newhouse et al.(2008)). However attrition may raise concerns. We are aware that there may exist unobservable determinants of our outcomes which differ across the respondents in the two groups. To limit these concerns,13 in Table 3, Panel a, we present balance tests for observable characteristics of respondents and non-respondents to the post-treatment questionnaire. There are no significant differences, apart from a small difference in gender. In Table 3, Panel b and c, we also show balance tests for the intention to treat, i.e. means of the same observable characteristics of workers respondent after the treatment and those who did not, separately for the treated and control groups. Again, we observe no significant differences. We also show balance tests for treated and control groups among the respondents (Table 3, Panel d).
Multiple t-tests where observable variables are considered together confirm that groups in all panels
13In a comprehensive review of methodological issues related to presence of attrition rates,Akl et al.(2012) shows that balance tests of respondents and non respondents are appropriate to reduce estimation biases and minimize the lack to follow-up.
of Table 3are balanced. In the next section, we will introduce our outcome variables and describe balance tests of pre-treatment outcomes for treated and control workers, including a comparison between respondents and non-respondents to the post-treatment questionnaire to exclude biases from the attrition. As an additional check, we also include correction for selection on observables using inverse probability weights, and we find the same sign, magnitude and significance of the coefficients of our main results.14
Each worker is matched with his/her supervisor. There are 130 supervisors because some of them supervise more than one worker. Ten supervisors also participate in the experiment, of which 8 in the treated group and 2 in the control group. Among supervisors, 75% are male, and the rest are female. For both male and female supervisors, we have an equal split between the two age groups:
under 46 and 46 or above.15
Workers were informed about the experimental nature of the project. Interestingly, after the end of the experiment, given the positive results obtained, the company informed us of its decision to continue and gradually expand the implementation of smart-working. In this subsequent process, the firm decided to give priority to workers who did not participate in our experiment. This decison was made after and could not be anticipated by the workers during our experiment. Only 60 workers of our sample of 310 workers had the opportunity to apply for participation in the new round of smart-working, of which 80% belonged to our treatment group.
During the nine months, the experiment was constantly monitored through meetings with the com- pany, weekly reporting on the use of smart-working and an internal meeting of the company every 3 months with the target population.
The protocol used has been registered in the American Economic Association’s Randomized Con- trol Trial registry. The registration happened during the experiment, before the analysis of the results. All stratifications (in particular by gender, which we will use in the heterogeneity analy- sis) are pre-registered. The experiment has been approved by the Ethics Committee at Bocconi University.
14In section 8 we will also discuss Lee bounds estimates for our results, which are presented in Appendix C. In section 8 we also provide evidence that the difference in the response rate to the second questionnnaire between treatment and control workers is not consistent to negative reciprocity of control workers who show their disappointment for not being selected.
15In appendix E we perform our analyses on the reduced sample which excludes reated supervisors and workers with a treated supervisor, with unchanged results.
4 Data collection
Data are obtained from both the firm and questionnaires administered to workers in both the treatment and control groups and their supervisors before and after the treatment. The firm provides some baseline information for each worker in our sample, as has already been mentioned, namely, gender, age, number and ages of children, whether the worker or a relative needs special care according to Law 104 and the type of work performed by the worker. We also know whether the individual works in a team with other coworkers and with a common supervisor.
4.1 Objective Productivity
Measuring productivity is a difficult task. We thus decide to rely on three different measures:
objective productivity, self-reported and reported by supervisors. In this section, we describe the measures of objective productivity, while the other two will be introduced in the next section.
We use two measures of objective productivity, both provided by the firm. The first one is the number of days of leave per month. Days of leave are typically paid and depend on sickness or other special leave requested by the worker for their need, either in advance or on the same day.
The second one is a monthly numeric index of objective productivity for each worker, based on the results of each worker in his/her own tasks. This monthly index is collected for the entire duration of the experiment from the month prior to testing (September) to the last full trial month (June).16 The index computed by the firm is unavailable for only 6% of workers in our sample. For the remaining workers, the index used is a specific number that represents the respective worker’s level of performance. More specifically, for 84.5% of them, the index corresponds to an absolute number, while for the other 15.5%, it is measured as a numeric change with respect to the measurement of the previous period. The measurement is homogeneous over time for the same individual but varies across individuals, as it depends on the specific job of each worker. Both the absolute number and the change reflect the exact number of executed tasks (e.g., the number of procedures completed, the number of contracts concluded, transactions performed, etc.).
For each individual we measure objective productivity before the treatment (time 0) and from
16According to our knowledge of the operation of the firm and information received by the managers, September is an ordinary month in terms of productivity of workers. As the new working arrangements may take some time to fully stabilize, we also rerun the analysis, considering October as the month preceding testing. This adjustment does not change results.
month 1 to 9. We apply a logarithmic transformation, that smoothes out the excess variability of the different measurements. Table 4shows that these value on average ranges from -6.908 to 7.857.
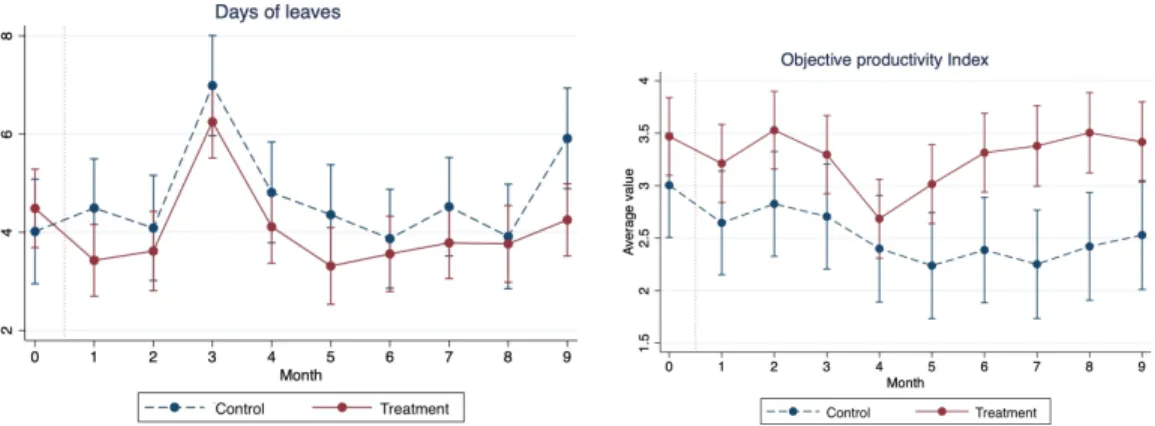
Figure2, on the left, compares the average numbers of days of leave requested by treated and control groups’ workers per month over the period of the experiment. Interestingly, starting from the same point, after one month the total amount of days of leave of the treated group is consistently lower than that of the control group. On the right instead we report the index of objective productivity per month. Treated workers show a higher productivity than control ones, however this difference is not statistically significant for the initial period and it becomes statistically significant in months 6 to 8.
4.2 Questionnaires
We designed questionnaires to collect data on productivity, well-being and the work-life balance.
Workers and supervisors in both the treated and control groups were asked to complete one ques- tionnaire before the experiment (the pre-treatment questionnaire) and another one afterwards (the post-treatment questionnaire). The questionnaires include questions related to productivity, well- being and the work-life balance. In the post-treatment questionnaire, the treated group also an- swered questions related to their evaluation of the policy.
Productivity assessed by the questionnaires includes self-reported productivity and that reported by supervisors. Both are measured by 4 outcomes: a measure of output or production, i.e., the ca- pacity to attain the assigned goals, efficiency at work, i.e., the capacity to attain the assigned goals within an appropriate time, proactivity at work, i.e., the capacity to take initiative appreciated by others; and the capacity to comply with predetermined deadlines. The respondents are asked to evaluate each outcome on a scale from 1 to 5, where 1 corresponds to “Very Low”, and 5 corresponds to “Very High”. Productivity reported by the supervisor includes the same four outcomes. They are consistent with measures used by existing case studies, reports, and toolkits focused on flexible work and productivity (seeGolden(2012),Pruchno et al. (2000),Kossek and Michel (2011), etc.).
Correlations between the variables self-assessed and reported by the supervisors are positive and significant and they range between 0.19 and 0.29.
The well-being assessment includes standard questions drawn from the British Household Panel Survey (Taylor et al. (1993)). These questions are widely used in the literature on economics of
happiness (see reviews in Van Praag et al. (2003) and Luhmann et al. (2012)). Respondents are asked to indicate the extent of their satisfaction on a scale from 1 to 7, where 1 corresponds to “highly dissatisfied” and 7 corresponds to “highly satisfied” with the following 7 dimensions: income, health status, home, job, social life, free time, and life overall. Respondents also have to report on a scale from 1 (much less than usual) to 5 (much more than usual) their ability to deal with the following 7 aspects of their lives: staying focused (referred to as “Focus On” in the tables), losing sleep due to any concerns, feeling that they play a useful role in their work life, being able to make decisions, appreciating the daily activities in a regular day, feeling stressed, and feeling unable to overcome difficulties.
The work-life balance assessment asks about satisfaction with working hours and how working hours adapt to private life on a scale from 1 (highly dissatisfied) to 5 (highly satisfied), the feeling of being able to balance work with personal and family life on a scale from 1 (no ability) to 4 (high ability).
Workers are also asked to quantify the time devoted to household activities per day (cleaning and housekeeping) and the time dedicated to taking care of others (children, elderly, or other family members) during the pre-questionnaire in two-hour ranges from “Less than 2 hours” up to “More than 6 hours”. In the post questionnaire workers are asked to quantify any possible change on a scale from 1 (the time has decreased over the last 6 months) to 5 (the time has increased).
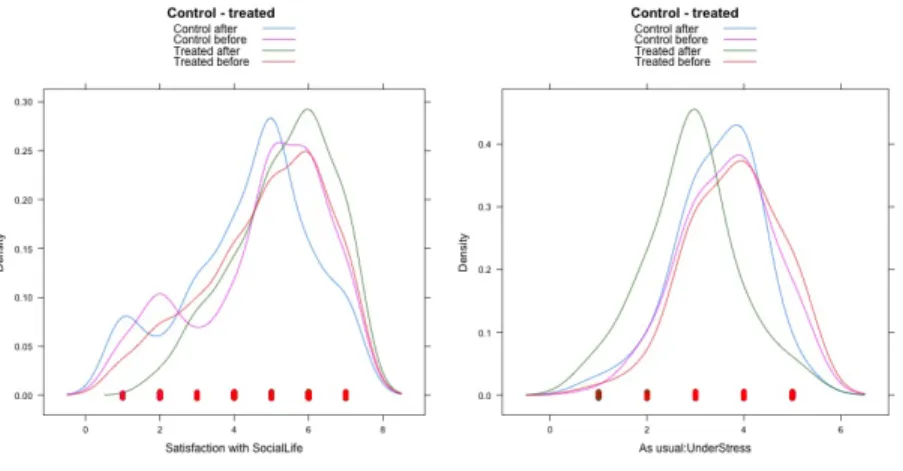
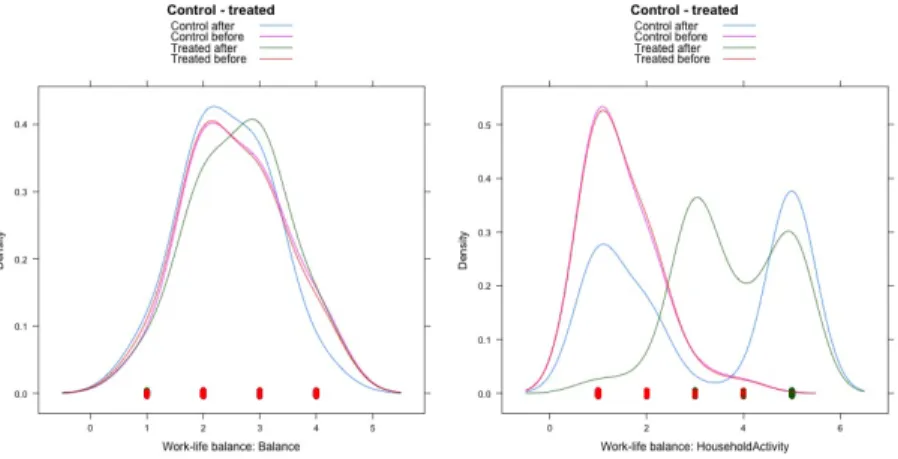
We provide first insights on the well-being and work-life balance indexes through a visual analysis.
Figure3and Figure4display kernel density functions for the treated and control groups before and after the treatment with reference to two specific outcomes: satisfaction with social life and ability to deal as usual with stress.17 Interestingly, while the pre-treatment kernel densities of treated and control groups overlap almost completely, they diverge after treatment, which thus suggests the emergence of an effect of the intervention.
The questionnaires also ask for the home-to-work distance in kilometers. Finally, they contain ques- tions about the commitment of workers to the company. The questions are: “How attached do you feel to the company?”, “Do you believe your work is sufficiently recognized?” and “Do you have a sense of moral responsibility towards the company?”.
Table A.1 in appendix A (Panel a) shows the results of the t-test for the difference between the means of treated and control groups for each outcome variable measured before the treatment (i.e.,
17We provide only these graphs for the sake of space. Graphs for the other outcomes are available upon request.
using data from the pre-treatment questionnaire). It confirms that the starting point is the same for treated and control groups, i.e., the two groups are balanced before the treatment, which confirms the validity of our randomization. The same result is obtained when we consider only respondents (in both treated and control group) to the post-treatment questionnaire (Panel b). To further limit the concerns related to the attrition rate, we also show balance tests of pre-treatment outcomes for respondents and non respondents (to the post-treatment questionnaire) within the treated group (Panel c) and the control group (Panel d).
Table 4 summarizes the outcome variables from the post-treatment questionnaires, related to the different dimensions of productivity, well-being, work-life balance and commitment to the company.
Additionally, we check that the difference between the number of hours worked by treated and control groups’ workers before and after the experiment is not statistically significant18, confirming that any possible effect of treatment on the outcome variables does not depend on a change in the number of hours worked (Table 19).
5 Empirical strategy
We estimate the effect of the treatment (i.e., of smart-working) on our variables which measure productivity, well-being and work-life balance.
For all the variables (different measures of objective productivity, self-reported productivity, pro- ductivity reported by the supervisor, well-being and work-life balance, as summarized in Table 4) we estimate the following equation at the individual level:
yi,P OST =α+βT REAT M EN Ti+δXi+γyi,P RE+εi (1)
whereyi,P OST is the specific measured outcome for individual ipost-treatment according to the di- mensions of productivity, well-being and work-life balance (as summarized in Table4),T REAT M EN Ti is a dummy variable that has the value of 1 if individualihas been assigned to the treatment group and is 0 if he/she belongs to the control group, yi,P RE is the specific outcome for individual i measured before treatment, Xi are individual control variables, and finally, εi is an error term.
18Time worked in minutes refers to overall time (normal plus eventual over-time) including lunch breaks.
Equation 1 is equivalent to a difference-in-differences model.19 Given the randomization, there should be no need to add control variables to measure the average treatment effects.20 However control variables are included to improve the accuracy of estimates. They are: the age of respondent (AGE) and its square (AGESQU ARED), gender, captured by a dummy variableM ALE that has the value of 1 if the respondent is male and 0 if the respondent is female, two dummy variables (LAW104W ORKERandLAW104RELAT IV ES) that capture the use of Law 104 for the worker or for a relative, respectively, two dummy variables related to children, namely, CHILD that has the value of 1 if the worker has at least one child and is 0 otherwise, and Y OU N GCHILD that has the value of 1 if at least one of the children of the worker is aged 3 or below and is 0 otherwise, the distance between the worker’s residence and the workplace in kilometers (KM) and the dummy variableW HIT ECOLLAR which is equal to 1 if the worker is a white collar and 0 if he/she is a blue collar. All variables are standardized as z-scores.
Since we are testing several outcomes, we report p-values adjusted for multiple hypothesis testing (Bonferroni correction). Since, as has already been mentioned, we oversample some characteristics of the population (female, people under the age of 46, subjects with children under the age of three and workers with a relative protected by Law 104), using weighting is recommended to make the analysis of the sample representative for the target population. We thus create a set of weights that is the inverse of the probability of inclusion of each stratum of the oversampled categories. In what follows, we report results using these weights.21
In addition to the baseline model, for our two variables of objective productivity (number of days of leave and index of objective productivity) which are measured every month, we pool observations for individuals in each month and provide Difference in Differences estimates as follows:
yit=α+βT REAT M EN Ti+γP OSTt+ηT REAT M EN Ti∗P OSTt+δi+εit (2)
19Our results are unchanged if we regress the outcome variable on the "treatment" dummy, the "post" dummy and the interaction between treatment and post, together with the control variables.
20We use the standard definition of "average treatment effects" altough we are aware of the limitations posed by the existence of potential dropouts and non compliance behaviour.
21To show the stability of our results and confirm that the extracted sample is representative of the firm’s workers even though we have over- or under-sampled some characteristics, we also run the analysis without weights. Results, which are available upon request, are similar.
whereyitis the specific measure of productivity (days of leave or index of objective productivity) for individuali at timet,T REAT M EN Ti is a dummy variable that has the value of 1 if individuali has been assigned to the treatment group and is 0 if he/she belongs to the control group,P OSTtis a dummy variable equal to 1 if the observation refers to the time of treatment period and 0 otherwise, T REAT M EN Ti∗P OSTtis the interaction term which measures the treatment effect of our interest, δi capture the individual fixed effects andεitis an error term. To assess the impact of the treatment in each specific month of intervention, alternatively toP OSTtwe introduce dummies for each month of the treatment (from 1 to 9) and interact each of them with the treatment dummy.
6 Results
We present results according to the three dimensions we investigate: productivity, well-being and work-life balance.
6.1 Productivity
The first dimension we consider is productivity. Table5provides estimates of equation1. For each outcome variable, the first column reports the average treatment effect and the second one includes control variables. The coefficients of the control variables are shown in Appendix B. Table5Panel a, columns 1-2 show a significant decrease of days of leave for the treated group after the treatment.
Considering the average decrease per month in the entire post-treatment period, the treatment re- duces the number of days of leave by 0.2 standard deviations on average each month. Given the standard deviation of 30.5 days per month and the 9 months period, this implies 0.67 fewer days of leave per month. If this decrease were solely driven by the smart-working days, which are 4 days per month, then 16.75% (0.67 of 4) of smart-working days would have otherwise been days of leave. Columns 3-4 show a significant increase of the index of objective productivity calculated as an average over the 9 months of the treatment. This increase amounts to 0.25 standard deviations per month, which correspond to an increase of 0.0625 standard deviation per day of smart work (4 days per month). In case workers were allowed to use smart-work every day (20 days a month), in absence of other factors, the productivity would increase by 1.25 standard deviations. Obviously, this is a hypothetical situation, as many other variables influencing productivity may change in
parallel and the increase of productivity may not be the same when smart-working days increase.
Panel b of Table5shows results of estimating equation1obtained by using as dependent variable the four measures of self-reported productivity described in section 4.2: output production, efficiency, proactivity, and compliance with deadlines. The average treatment effect is positive and significant for all measures except production, and remains significant for proactivity and meet deadlines if control variables are included. The effect is sizeable: the treatment increases by around 0.4 standard deviations the coefficient of self-assessed proactivity and respect of deadline.
Panel c of Table 5 provides estimates of equation 1 using as the dependent variable the same four outcomes while instead using the answers of the supervisor of each worker. Results confirm that smart-workers increase their compliance with deadlines compared to the control group; this finding also holds if workers are assessed by supervisors and the magnitude of the effect increases up to 0.57 standard deviations. We note that the number of observations in this analysis is smaller because supervisors did not always respond.
In Table6we estimate Equation2. We measure the increase of objective productivity by exploiting the availability of monthly data and controlling for possible changes in the firm demand each month.
We first run a panel data regression with pooled observations over the 9 months and we regress our objective productivity measures on the treatment dummy and the interaction between treatment and the post period (columns 1 and 4). We then add monthly time dummies and individual fixed effects (column 2 and 5). We finally interact the treatment dummy with a dummy for each month (columns 3 and 6). Results show that days of leave decrease significantly for the treated group after the treatment in 5 out of 9 months. While our index of objective productivity does not seem to be significantly affected by the treatment when we consider the treatment period together, column 6 shows a significant increase in months 7 and 8.
Figure5summarizes our results on productivity. It shows the estimated difference between treated and control workers per month. The figure visually shows the significant decrease of days of leave per month and the significant increase of the index of objective productivity in month 7 and 8. This higher productivity likely occurs because smart-workers can better organize their time than non- smart-workers and are less in need of asking for leave due to sickness or other reasons (e.g., if they need to visit a doctor or have to pick up children from daycare centers or assist elderly parents, etc.).
6.2 Well-being
The second dimension we consider is well-being. We measure well-being in two ways. First, workers are asked to self-assess on a scale from 1 to 7 their personal satisfaction with respect to seven variables: income, health status, home, work, social life, free time, and life in general. Second, they are asked whether they are able to deal as usual on a scale from 1 to 5 (where 1 corresponds to
“much less than usual” and 5 to “much more than usual”) with seven aspects of their life: staying focused, losing of sleep due to any concerns, feeling that they play a useful role in their work life, being able to make decisions, appreciating the daily activities in a regular day, feeling stressed, and feeling unable to overcome difficulties.
Panel a of Table 7 shows the results of estimating equation 1 using as the dependent variable seven different measures of satisfaction, while Panel b shows results for seven “satisfaction as usual”
measures of well-being. Smart-working increases the individual satisfaction with social life, free time and life in general. When we include control variables, positive and significant effects are also observed for satisfaction with health and home. The size of the effects ranges between an increase by 29% (satisfaction with life in general) to 46% (satisfaction with free time).
Moreover, smart-workers are more capable than usual of dealing with all aspects of their lives (apart from playing a useful role): in Panel b of Table 7, the coefficients of treatment are positive and significant and sizeable.
6.3 Work-life balance
The third dimension we consider is the work-life balance, measured by four variables that correspond to satisfaction with four aspects: working hours, balance between working life and personal/family life, the amount of household activities (cleaning and housekeeping) per day and the amount of time dedicated to taking care of others (children, elderly, or other family members).
Panel c of Table 7 reports estimates of equation 1, where for each column the dependent variable is one of the above 4 measures of work-life balance. The table shows that treatment is associated with more time being dedicated to household and care activities. When we include control vari- ables, positive and significant effects are also observed for the balance between working life and personal/family life.
6.4 Heterogeneous effects by gender
A possible consequence of the introduction of flexible work is the reduction of gender gaps (Goldin, 2014), which follows two main channels. First, although smart-working does not target women, it may be particularly promising for women’s employment because it promotes work-family balance, which is a major concern for employed women, who typically bear the double burden of work and family/care responsibilities. This is particularly true in Italy, where, according to the most recent data of the Italian National Institute of Statistics (Istat, 2018), women spend 3 hours per day more than men in domestic and unpaid care work, and more than 4 hours if we consider couples with children. The country exhibits the highest asymmetry in time use within couples across all Eu- ropean countries. Second, by promoting work-life balance and a more efficient allocation of time, smart-working may increase the participation of men in housework and childcare.
In this section we examine heterogeneous effects for men and women in our sample. Gender was registered as a critical variable for our experiment. Our balance tests for the covariates by gender, presented in Table 8, confirm that the subsamples of men and women are randomly divided, and thus our analysis by gender is expected to be informative.
Table 9shows that our measures of objective productivity are not differently affected by the treat- ment according to the gender of the worker (panel a)22. However men self-report significantly higher increase of proactivity than women (panel b) and supervisors, who are mostly men, report a higher capacity to meet the deadlines for men than for women (panel c).
Table 11 shows that treated women have a higher satisfaction with life in general with respect to men. Considering the self-assessed comparison with the usual conditions, there is an additional effect for treated women to the perception of having a useful role (table 11, Panel b). Interest- ingly, considering the indices of work-life balance (table11, Panel c), we observe that the treatment significantly increases the time all workers spend in housework and care activities, without a signif- icant difference by gender. In other words, against the stereotype that men may use job flexibility for performance purposes and women for work-family balance, we find causal evidence that smart- working increases participation also of men in household and care activities. There is no evidence
22In parallel with Table 6 we also estimate equation 2 in Table 10 and find no significant heterogeneous effects by gender. Note that in column 2 and 4 we capture heterogeneous effects by using a triple interaction between post, treatment and gender. No significant effects are detected. By introducing a triple interaction for each month - not reported in the Table- we also do not identify significant result in any month
of a reduction of gender gaps in household and care activities, but not even of an increase of them.
This result suggests that smart-working should be particularly appealing to workers with children.
As the treated and control groups are balanced with respect to the number of children (see Table D.1 in Appendix D) in addition to other factors, we investigate heterogeneity between workers with and without children. We observe no heterogeneous effects in productivity. The results seem to suggest that smart-working significantly increases household and care activities of workers (see Table D.4 in Appendix D).23
6.5 Heterogeneous effects by team
Since smart-working changes not only the interaction of workers with their supervisors, but also the interaction between workers in a team, the increase of productivity may be driven by workers not in team. As already explained, our regressions include a dummy which captures whether the worker works in team or not. However this does not exclude a potential concern that smart-working creates negative spillover effects from treated workers to control coworkers in the same team. The literature, though focused mainly on low-skill jobs, suggests that workers who observe their peers increase their efforts and productivity (Mas and Moretti, 2009). Thus, smart-working, by introducing one day of remote and flexible working, may produce a negative effect on productivity of control group’s workers of the same team. This negative spillover effect emerged also in research on telecommuting.
Given that smart-working is used only one day per week, we expect these negative spillover effects to be limited. However we need to better investigate.
We first consider working in a team as a dimension of heterogeneity. We know whether each worker – both in the treated group and in the control group – works in a team and are able to identify the coworkers in the same team. Approximately 70% of workers work in teams. The characteristics of workers in the two subgroups – of those working in teams and of those not working in a team – are balanced across the treated and control groups (see Table 12). Working in a team does not seem to be significantly related to productivity measures. However, we are interested in possible differential effects of smart-working for workers in teams and workers not in a team. In Table 13, we add the interaction between team and treatment, which turns out to be significant for the days
23We also performed heterogeneous effects by age, although we do not have clear expectations on them. Results are available upon request.
of leave (although the effect has a limited magnitude) and non significant for the index of objective productivity, nor for the self-reported productivity or the productivity reported by the supervisor.
To better understand this effect, Table 14 uses the panel data dimension of our observations with individual and month fixed effects and introduce a triple interaction of team, treatment and post.
Smart-working does not seem to affect differently our measures of productivity of workers in teams and workers not in a team, showing that there are no significant spillover effects of productivity on team workers.24 We also do not identify heterogeneous effects by team in the dimension of well-being and work life-balance (Table 15 ). In Appendix E we report additional analyses which confirm that spillover effects by team can be excluded.
7 What drives the increase of productivity? Into the mechanism
Our results suggest that smart-working is associated with an increase of productivity under several dimensions and ensure that none of them register a decrease. Similarly, well-being of workers in- creases, as well as work-life balance. Differently from the results on telecommuting, our findings are established in a sample of non-routine workers, who appreciate the additional flexibility associated with smart-working. What drives these effects? Can we identify specific effects of the flexibility introduced by smart-working, different from the traditional telecommuting?
Our first interpretation of the results is that workers simply value the new work environment and enjoy the flexibility they have.
A possible interpretation is that the increase of productivity of smart-workers and the increase of their well-being can be related to the time saved in commuting, which could allow workers to be less tired and more focused during the day. The longer the commuting time, the stronger this effect, which works equally for telecommuting and smart-working. We first note that the distance from the workplace in kilometers is included as a control variable in our analyses, without affecting their significance. Commuting time was playing a very important role inBloom et al. (2014). We argue that, if the commuting costs is what explains the results, the difference between telecommuting and smart-working is limited. If instead the reduction in commuting costs is not the key driver of our results, then we should expect smart-working and telecommuting to be different, and the
24In parallel with columns 3 and 6 of Table 6, we also introduce monthly dummies and the triple interactions between month, treatment and team. Results, which are available upon request, show no significant effects.