To transfer the model to the data, we use the French division into administrative districts and exploit the heterogeneity of the treatment effect between districts. We argue that the impact of the tariff on the variables of interest depends on the relative importance of cereals in the county economy, which we substitute for their share of employment. Murphy (2015) and Daudin, Franck and Rapoport (2019) explore the determinants of French fertility in the 19th century.
The country had experienced its industrial revolution by mid-century, but the economy remained predominantly agricultural. In France, a notable exception is the development of the beet sugar industry in the 1850s and 1860s.
4 Modelling education and fertility decisions
A quantity-quality trade-off model .1 Technologies and preferences
- Solving the model
The first constraint gives the parent's consumption, where is the parent's income; We abstract from such a decision in order to focus on the main aspects of the model. This equation captures, as in Galor and Weil (2000), the fact that investment in education in children depends on how it affects the expected income of the offspring.
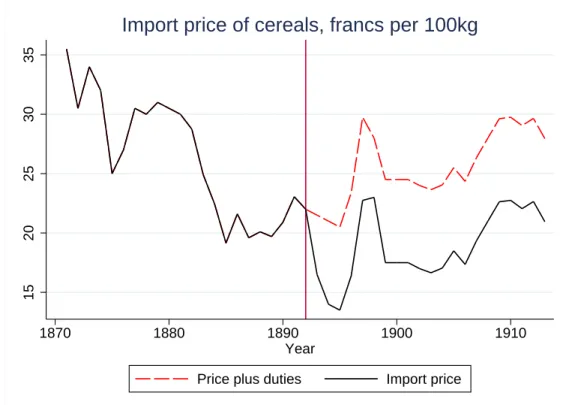
For every world price of att+ 1, the domestic price of agricultural products will be higher than it would be in the absence of the tariff. The tariff simply results in annt (et) that is higher (lower) than that implied by the trend in world agricultural prices without the tariff.
Child labour
These only differ from our previous results in the cost of children (which are now lower because they increase household income) and thus imply the same comparative statistic as before, with the effect of the rate determined by parents' expectations of relative returns in the two sectors. In this setup, the tariff does not influence household decisions in the manufacturing sector; it will nonetheless reduce average educational attainment and increase average fertility, both through its impact on agricultural household decisions and the proportion of households currently employed in each sector. In the appendix we consider the case where the utility function has the form Ut−1 = (1−γ) lnct+γlnnt.
Assuming that children are productive in agriculture but not in manufacturing, parents will make different choices in the two sectors. In the case of Becker's model, this effect is stronger in departments with higher relative productivity of agriculture, which is associated with a higher (pre-tariff) share of employment in agriculture.
5 Empirical specification
The educational decisions of each type of household are unaffected by the tariff, but average education will change with ηt, since a higher tariff implies more agricultural workers and thus a higher proportion of households choosing not to educate their children. In summary, the different scenarios that we have considered all imply that the introduction of a tariff tends to increase fertility and reduce education. The model of child labor implies different behavior of parents across sectors, and therefore the effect of the policy is stronger where the share of agricultural employment is higher.
The latter will be determined by the relative productivity of agriculture and manufacturing. they respond with a lag because wages may be slow to adjust and having and educating children take time, but also because both variables are influenced by social norms derived from past behavior that can slow policy responses. We introduce Mt∗Expt, which is not interacted with Ci in this specification because it is collinear with neither annual fixed effects nor county-specific time trends.30.
6 The data
Education and birth rates
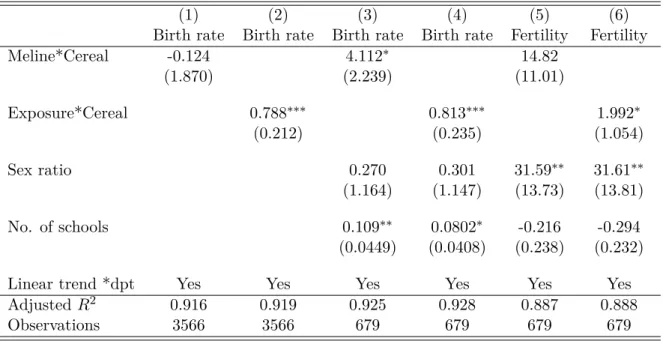
The sex ratio is often seen as a determinant of fertility and birth rates as it is a measure of the tightness of the marriage market, with a higher ratio reducing the restrictions on female marriage and/or the age at which women marry and thereby increasing the number of children; see Angrist et al. (2002), Angrist et al. (2005) and Becker et al. We therefore calculate the sex ratio defined as the number of men aged 15 to 45 divided by the number of women of the same age. We also calculate the number of primary schools per 1000 children aged 6 to 13 and use this as a control in our regressions.32 Given the expansion of education that took place over the period, we can use this variable to control for the supply of schools that could have influenced education investment.
However, it is possible that the increase in the number of schools is a response to greater demand. Although our reading of the policy discourse at the time is that the increase in the number of schools was largely supply-driven, we will nevertheless also consider specifications in which this variable is not included.
Policy variables and descriptive statistics
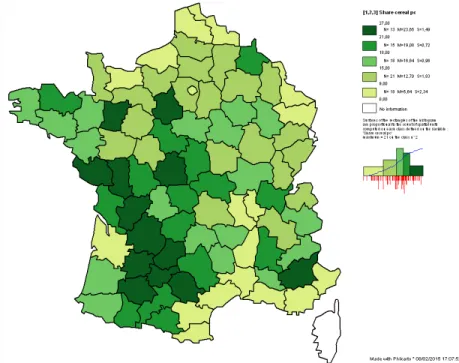
Data on the share of employment in grain production are not available, so we use as a proxy the product of the share of agricultural employment in total employment in 1891, obtained from the census, and the share of the value of grain production in total agricultural output in 1892. As a result, some (though not all) northern departments that produced large amounts of grain but where agriculture accounted for only a small portion of total employment, show low values of the share of grain. Reading of the legend: In the 13 departments in forest green, the share of employment in cereals is between 21%-27%, with an average of 23.6%.
The share of employment in grain production is represented by the product of the share of agriculture in employment and the share of grain in agricultural production. Just over half of the national population was employed in agriculture, the employment share rose to 79%.
7 Empirical results
- Birth rates and fertility
- Education
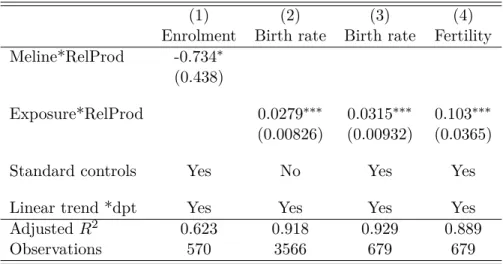
- Alternative measure: Relative productivity
- Confounding factors
- The timing of the shock
- Exploring potential mechanisms
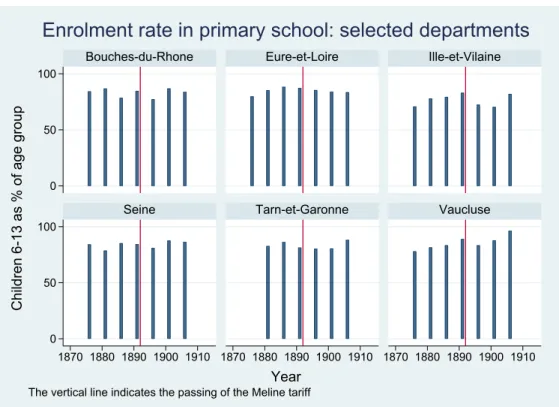
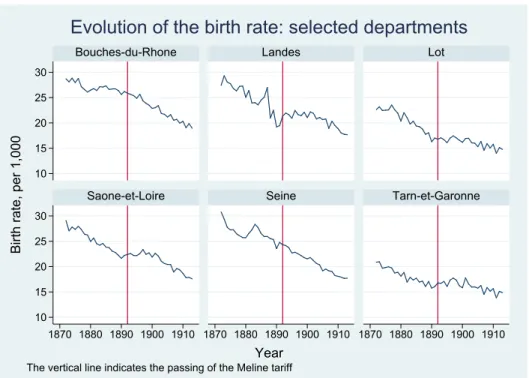
The second column therefore looks at the impact of the number of years that the policy has been in place (Exposure). In both specifications, the coefficients on the rate interacting with the share of employment in the cereal sector are positive, and are more significant when we take into account an increasing effect over time, which, as before, indicates a growing effect of the policy. To visualize the differential impact of the rate, figure 5 shows the evolution of the birth rate in 6 selected departments.
As we can see, the introduction of the tariff indicated by the vertical line did not coincide with any disturbance in the time trend of fertility. Further specifications were explored which showed that the effect of the tariff on education was immediate, so column (1) is our preferred specification. In fact, estimates of enrollment rates nationally confirm the large impact of the tariff.
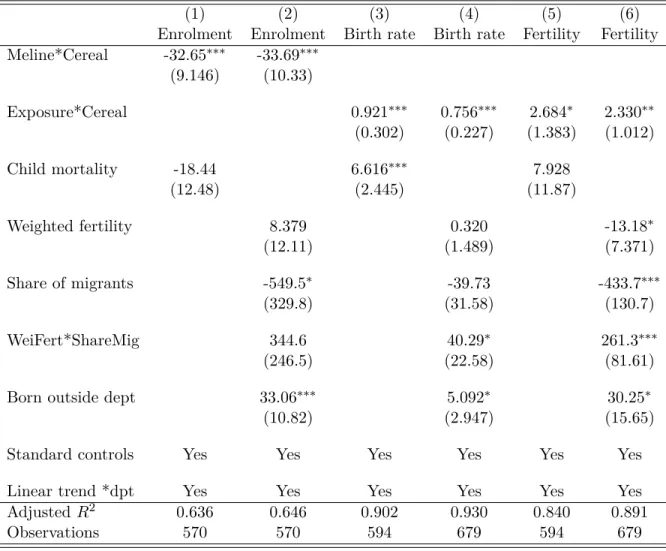
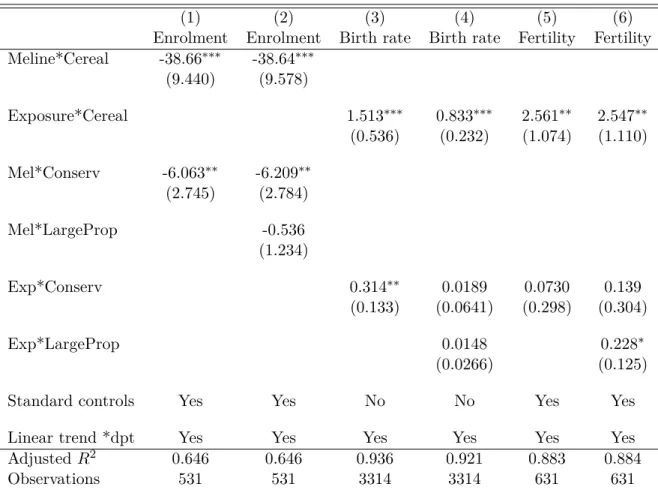
We therefore collected data on both the part of the population born in France but outside the department and on those born abroad (see the appendix for the details). The impact of the tariff does not depend significantly on the structure of agricultural properties, except for fertility rates. For fertility rates, the coefficients just miss the 10% significance threshold, with the results for this variable being more satisfactory when we measure the intensity of the shock with relative productivity rather than with the grain share (see Table A.5 in the appendix).
In fact, evaluated against the average of the gender employment share, male employment produces slightly stronger effects of the tariff. Nevertheless, we have two consistent observations, for 1896 and 1906, both after the introduction of the Méline tariff. We can then calculate the rate of attendance, defined as the ratio of the number of pupils present to the number of pupils registered.
8 Conclusions
The dependent variables are the enrollment rate for all children, the birth rate and the fertility rate. The dependent variables are the enrollment rate for all children, the birth rate and the fertility rate. The dependent variables are the share of agricultural employment in total employment, the enrollment rate of all children, the birth rate and the fertility rate.
Year fixed effects are included in all regressions, standard errors are pooled in the random effects model. The dependent variables are religious and secular school enrollment rates for all children, boys and girls.

Appendix
- The historical context A1.1. Protectionism in the media
- Proofs of the model
- Dataset construction and sources
- Additional figures and tables
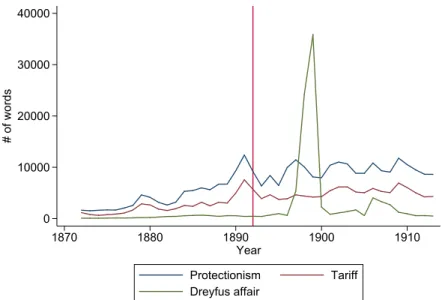
One of the components of our composite measure, rate, is also reported and shows a similar pattern. In contrast, both our composite measure of protectionism and the word tariff remain in newspaper articles for the two decades following the introduction of the tariff. We then regress the number of words on a trend and on a dummy equal to one during the period after the gap year as given by the result of the Wald test.
This result is consistent with the idea that media pressure continued, but at a slower pace, after the tariff was passed, something that suggests a new regime for discussing protectionist policy in the public debate. In the following sections we detail the construction of this demographic and educational exposure. Low-input agriculture is consistent with the period we are considering, given that France was a laggard in fertilizer use in the late 19th century, see Dormois (1996).
We then use the maximum caloric yield of the three crops as the potential grain yield for the ward. Franck and Galor (2020) show that this distance is an exogenous predictor of the ability to industrialize in the second half of the 19th century. The data were digitized as part of the ICPSR project (https://www.icpsr.umich.edu/).
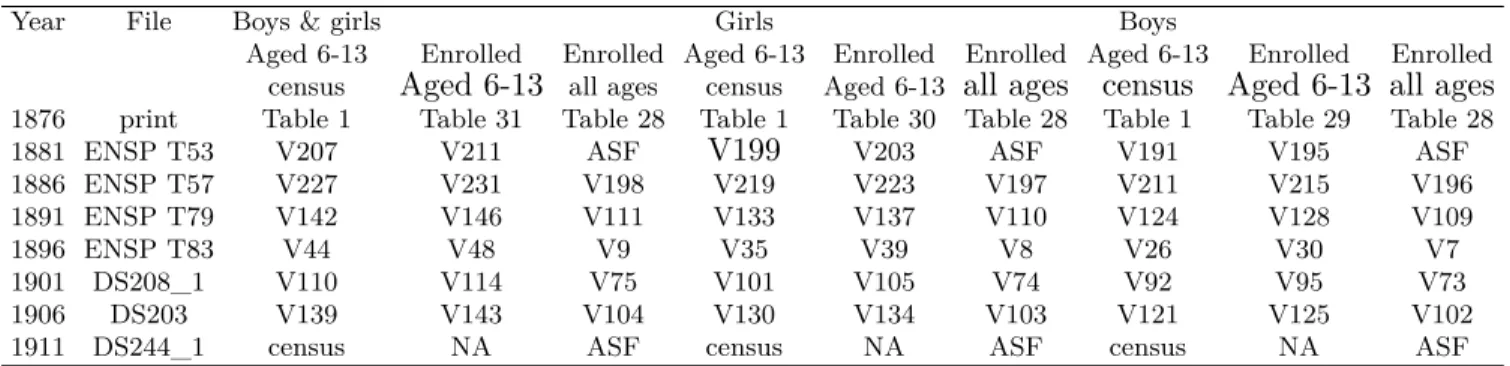
Fertility: The fertility rate is calculated as the ratio of the number of births to the total population of women aged 15 to 45. At each point in time, we construct a measure of the birth rate in the country of origin relative to France and calculate the average relative birth rate for foreigners, weighted by the size of each nationality among the department's foreign population. TableOA.1 gives the name of the file and the names of the three variables used to calculate the enrollment rate.
They are obviously miscalculated, so we went back to the data published in the French Government Statistical Yearbook from 1884, which retrieved the number of pupils enrolled in 1881 (Annuaire statistique de la France, 1884, p. 261). In most departments for almost the entire period, a department was linked to Paris and Fresnes by train (which was the cheapest transport technology).
The role of technology and institutions for growth: Danish creameries in the late nineteenth century. Old habits die hard (sometimes): What the Department's heterogeneity can tell us about French fertility decline. The Myth of Free Trade Britain and Fort France: Tariffs and Trade in the Nineteenth Century.
Fertility, schooling and the economic contribution of children of rural India: An econometric analysis. Family and Sexuality in French History, chapter "Motivations and Technology in the Decline of French Fertility".
Online Appendix: The toll of tariffs
V stands for variable, ASF stands for Annuaire statistique de la France, see text for details. All regressions include year and department fixed effects and the proportion of women (men) working in agriculture over total employment, columns (3) to (6) also include Exposure.