Behind the Differentiation of Suburban Development in the Hinterland of Bratislava, Slovakia*
MARTIN ŠVEDA, MICHALA MADAJOVÁ and PETER PODOLÁK**
Institute of Geography, Slovak Academy of Sciences, Bratislava
Abstract: Several tendencies seem to indicate that in the hinterland of Bratisla- va specifi c new residential zones are forming with a different socio-economic structure. This article analyses the hinterland of Bratislava from various per- spectives of suburban development. The selection of variables covers the ori- gin of in-migrants and their economic activity, education, and family status.
Indicators of land use, housing construction, and property prices supplement these data. The data are processed based on a factorial ecology approach, which tries to discover the basic dimensions of the socio-spatial structure, and cluster analysis. Using these methods the authors identify similar clusters and categorise individual municipalities into relatively homogeneous units—sub- urban development types. The results lead to a number of very interesting fi ndings. The same types of suburban municipalities are not arranged in con- centric zones, which means that the factor of distance from the city does not play a prominent role. The prevailing factor is the sectorial structure, which refl ects the different levels of attractiveness municipalities hold for different socio-economic groups of in-migrants. This article seeks to identify key factors that affect the formation of individual suburban zones and thus contributes to a better understanding of the processes that decisively shape the socio-spatial organisation of hinterlands in post-socialist cities today.
Keywords: suburban development, socio-spatial differentiation, regional ty- pology, Bratislava, Slovakia
Sociologický časopis/ Czech Sociological Review, 2016, Vol. 52, No. 6: 893–925 DOI: http://dx.doi.org/10.13060/00380288.2016.52.6.290
Introduction
Suburbanisation has become the predominant mode of urban growth in post- socialist metropolitan areas [Sýkora and Stanilov 2014]. Slovakia is no exception to this phenomenon, which fully developed in the hinterland of Bratislava—a region usually overlooked in work on the urban development of major Central
* This article was prepared as part of work on Project No. 1/0082/15 and Project No.
2/0101/15 funded by the VEGA Grant Agency (Scientifi c Grant Agency of the Ministry of Education and the Slovak Academy of Sciences).
** Direct all correspondence to: Martin Šveda, Institute of Geography, Slovak Academy of Sciences, Štefánikova 49, 814 73, Bratislava, Slovakia, e-mail: [email protected].
East European cities [cf. Hamilton et al. 2005; Gentile et al. 2012; Sýkora and Bou- zarovski 2012; Stanilov and Sýkora 2014]. Numerous studies on the hinterland of the capital have discussed the ‘urban-rural continuum’, in which the effects of suburbanisation decrease with the increasing distance from the city. This was further supported by the development of several basic indicators such as net migration [Podolák 2007; Slavík et al. 2011; Novotný 2016], the number of con- structed dwellings [Šveda 2014], and the share of built-up areas [Šveda 2011], the value of which was highest in the immediate hinterland of the city and gradually decreased towards the periphery. In the context of an unregulated market and limited legal constraints for developing, suburbanisation could fully develop not only in the sense of land comsumption [Šveda 2011; Pazúr et al. 2015] but also in the frame of social (demographic, ethnic) differentiation [cf. Kok and Kovács 1999; Ouředníček 2007; Tammaru et al. 2013]. Suburban processes are indeed the results of market-based location choices and of the individualisation and plurali- sation of lifestyles in the post-socialist period [Wiessner 1999: 46].
Several studies considered migration patterns on a city-suburban scale, where migration fl ows of different directions and composition were observed [Tammaru 2001; Leetmaa and Tammaru 2007; Krišjāne and Bērziņš 2012]. The hinterlands of post-socialist cities are thus formed by various processes, of which suburbanisation is only one, albeit a dominant, component. Suburbanisation as intraregional deconcentration of the population from the urban core towards the hinterland is only one stream, supplemented by the processes of centripetal migration and tangential movements within the hinterland, respectively. In this regard it is indispensable to distinquish between suburban development—as a wider notion for all the transformation processes ongoing in the city hinterland—
and suburbanisation, which is only one of these transformation processes [see Ouředníček 2007]. In this view suburban development represents a useful um- brella term for a variety of migration movements and settlement transformations.
The etymology of the word ‘suburban’ emphasises the location’s links to the city, but the character of development (transformation processes) varies depending on the particular conditions in every part of the hinterland (the distance from the urban core, population structure, infrastructure, natural conditions, cultural background, etc.). Suburban areas may still be confi gured in terms of depend- ency on a large city centre, but it is not just suburbanisation that matters.
Different patterns of suburban development (expansion) can be associ- ated with specifi c environmental conditions, transportation, and social and de- mographic selectivity of suburbanites [Ouředníček 2007; Kährik and Tammaru 2008; Krišjāne and Bērziņš 2012; Tammaru et al. 2013]. In addition, the hinterland of Bratislava is becoming a destination not only for migrants from the capital itself, but with its prominent position attracts migrants from all regions of Slo- vakia. This gives rise to a very colourful mosaic of varying settlement forms of residential construction; from compact residential areas as integrative extensions of already established settlements to solitary units scattered in suburban space.
Several tendencies seem to indicate that in the hinterland of Bratislava specifi c new resindential zones are formed that have different socio-economic structures.
Some of them are easily identifi able (e.g. on the basis of visual attributes—luxu- rious residential zones in an attractive environment and in the close vicinity of Bratislava). The character of other zones seems to be defi ned by indirect indica- tions only.
A fundamnetal question arises: what is behind the differentation of subur- ban development? To support the claim that the socio-economic pattern in the hinterland of Bratislava has shaped itself in a certain way and to reveal the hid- den relations between residential construction, the structure of in-migration, and physical conditions, the article seeks to answer the following research questions:
What is the pattern of suburban migration and residential intermixing in the hin- terland of Bratislava? What are the key factors that condition the formation of individual types of suburban development? Does the differentation follow an assumed relationship with the distance from the city? Is the origin of newcomers an important factor in shaping the pattern of residential structures?
Methodologically, the paper analyses the hinterland of Bratislava from the perspective of in-migration, housing construction, property prices, and land use within the analytical frame of factorial analysis and cluster analysis. The contri- bution is based on the factorial ecology approach [see Davies 1984], which repre- sents a relatively sophisticated method for identifying and describing the main elements of socio-spatial structure, whose outputs depend substantially on the nature of the data input (e.g. from censuses). First, we briefl y describe our meth- odological background and the rationale behind it. Second, we focus on a brief description of the data and methodology leading towards the identifi cation of the individual suburban development types. Relying on several differential as- pects of residential suburbanisation, we try to identify key factors that condition the formation of individual types and thereby identify and characterise similar confi gurations. The paper concludes with a discussion of key fi ndings and with an overall assessment of limitations and suggestions for future investigation.
Studying socio-economic differentiation in the suburban zone of the post-socialist city
Since the collapse of socialism in Central and East Europe (CEE), researchers have explored the underlying processes that contribute to metropolitan transfor- mation, such as suburbanisation. The character of suburban trends has in some respects become comparable to the driving forces in Western countries [see Sze- lényi 1996], but as Leetmaa et al. [2009] noted, the concept of ‘Western suburbani- sation’ is not sufficient to understand post-communist intra-metropolitan migra- tion [see also Timár and Váradi 2001; Nuissl and Rink 2005; Hirt 2007; Borén and Gentile 2007]. The traditional view on residential suburbanisation, as urban
families’ fl ight into the suburbs for better living conditions, does not suffi ciently explain the divergent trends in the metropolitan transformation of the post-so- cialist city. There has been a great effort in literature to better comprehend the variety of forms of suburban development in the inherited socio-spatial context of post-socialist metropolitan areas. Some scholars point to the different direc- tions and composition of development [Kok and Kovács 1999; Ouředníček 2007;
Hirt 2007; Kährik and Tammaru 2008], others present evidence of various moti- vations contributing to suburban in-migration. As Kährik and Leetmaa [2009]
observed, less is known of the demand-side mechanism shaping suburbanisa- tion—that is, residential preferences and satisfaction with living in new suburban areas. Post-communist migrants have diverse socio-economic backgrounds; some people move to suburban areas in search of a better quality of life (the dream of owning a detached house in the countryside), while others leave the cities to fi nd cheaper housing [Kok and Kovács 1999; Hirt 2007; Leetmaa and Tammaru 2007].
The decentralisation of the population to some extent has taken place in a context of economic decline and was often motivated by the ‘survival strategy’ of poor households [Smith 2000]. There are still people who migrate into the hinterland from rural areas in order to fi nd jobs in the cities, which became a positive pole of growing social and economic polarisation in the course of transition. Futhermore, the motivations for migration into suburban areas are not exclusively related to current changes, they are rooted in the legacy of housing construction and ur- banisation during the socialist period [Krišjāne and Bērziņš 2012]. As Sýkora and Stanilov [2014] noted, a starting point for the exploration of post-socialist subur- banisation is the juxtaposition of the trajectories, patterns, and underlying forces of urbanisation and suburbanisation under socialism and capitalism.
Along with environmental and economic aspects, a clear ethnic dimension to suburbanisation has been revealed by studies conducted in Western Europe- an countries and the United States [e.g. Bolt et al. 2008; Clark 2006]. Whereas in the US suburbanisation was typically a ‘white fl ight’ into racially and socially homegeneous suburbs, less is known about the ethnic dimensions of post-social- ist suburbanisation, despite the existence of numerous minorities in many CEE countries (the Russian minority in the Baltic states or the Hungarian minorities in Slovakia and Romania). This topic is underrepresented in research on CEE sub- urbanisation, and the exception is the analysis of the Russian minority in Estonia, where Tammaru et al. [2013] show that ethnic minorities are much less likely to move to the suburbs than the majority population, and minorities are less likely to move to rural municipalities in the suburban ring of a city.
Given the above-mentioned background, the result is a colourful composi- tion of in-migrants moving into the hinterland of the post-socialist city, not only in terms of their source destinations, but also with respect to their different social and cultural backgrounds and differentiated motivations. As Brade et al. [2009:
234] noted, the wide range of old and new residential areas—from suburban areas with exclusive residences to housing parks, old and newly erected second-
residence communities, and private homes built with modest fi nancial means in the surrounding regions—indicates the need for a more differentiated view on the suburban space of transformation cities.
But where to look for more differentiated views—synthetic methods—for studying suburban differentiation? Methodologically, much inspiring work has already been done in revealing differentiated patterns of suburban development in CEE contries. Empirical analysis based on bivariate or multivariete methods were employed to analyse the patterns of suburban migration [Leetmaa and Tammaru 2007; Kährik and Tammaru 2008], motivations for migration [Kährik and Leetmaa 2009; Krišjāne and Bērziņš 2012], commuting [Tammaru 2005], and the ethnic dimension of suburbanisation [Tammaru et al. 2013]. Evidently, the question of suburban development is increasingly attracting attention in spatial policy; however, this topic is mostly viewed from a quantitative demographic perspective; synthetic approaches involving a more complex framework (in terms of geographical synthesis) are still rather rare [e.g. Kährik and Tammaru 2008].
A vast source of inspiration is the commonly used method of factorial ecol- ogy, by which geographers and others analyse the residential patterning of cities.
The factorial ecology methodology originated in studies of intra-urban spatial variations [Davies 1984], but it has been applied much more widely. Although the theoretical framework of this approach has received considerable criticism, from a methodological perspective we see it as an extremely fruitful direction of research whose basic objectives (to identify dimensions of socio-spatial dif- ferentiation) and analytical tools (factorial analysis, cluster analysis, etc.) could be inspiring in our effort to understand the nature of suburban development and differentiation.
Setting the scene: migration and housing construction in the hinterland of Bratislava
The fi rst signs of suburban development started during the inter-war period as signifi cant fl ows of urban dwellers moved into the agricultural hinterland of Bra- tislava. This process was soon stalled by the socialist regime. The ensuing forty- year period was very similar to that in other socialist countries in CEE. The sur- rounding areas were underdeveloped due to the strong role of the state in urban planning and the housing system and the concentration of all important socio- economic activities in urban cores [Stanilov and Sýkora 2014]. After the sudden change of political system, the scale, pace, and depth of post-socialist transfor- mation were not uniform [Nuissl and Rink 2005; Pichler-Milanovič et al. 2007;
Marcińczak et al. 2015]. Whereas the transition in the Czech Republic, Poland, and Hungary proceeded more or less smoothly (not to mention the intense im- pact of West Germany on the former East Germany after unifi cation—Wiessner [1999]), the political instability in Slovakia during the 1990s caused a slowdown
in the transformation to neoliberal policies, which inevitably led to the later arriv- al of economic, social, and cultural changes [see Drahokoupil 2009; Šuška 2012].
In the fi rst phase of the existence of an independent Slovakia (1993–1998) internal migration was characterised by a complicated and unclear situation [Michálek and Podolák 2011]. As in other CEE countries, urban development in Slovakia was concerned with the issues of urban regeneration, economic crisis, and deindustrialisation, increasing socio-spatial polarisation [cf. Szelenyi 1996;
Niussl and Rink 2005]. Migration played only a minor role in the regional ad- justment to the new economic situation in Slovakia during these years [Fidrmuc 2004]. The development of centrally planned large estate projects ended and in- dividual housing construction was very modest, as the prices of new houses were very high in relation to population income. There was no help in the form of mortgage fi nancing because it was not available until the end of decade [cf. Roy 2008]. The fi rst more signifi cant migration fl ows from the city to the hinterland had already begun occuring by the middle of the 1990s (Figure 1). The shift in the migration balance of the municipalities in the hinterland of the cities is one of the most typical traits of the changes that were manifested in the population’s spatial movement in Slovakia in the new socio-economic conditions. This is the period (1996–1999) particularly connected with the fi rst phase of the suburbanisation processes. Residential suburbanisation was characterised by the construction of single-family homes (some of them in the form of castle-like villas) located in the immediate vicinity of Bratislava. However, the volume of housing construction in the hinterland of Bratislava was low—around 400–800 dwellings per year during Figure 1. Net migration rate in the Bratislava Functional Urban Region
Source: Based on data from SOSR (2011).
-5.00 0.00 5.00 10.00 15.00 20.00
Net migration rate
Bratislava Hinterland analysed period
1991
1999 1998 1997 1996 1995 1994 1993
1992 2000 2015
2014 2013 2012 2011 2010 2009 2008 200
7 2006 2005 2004 2003 2002 200
1
the second half of the 1990s compared to 2000–3000 in the decade that followed (Figure 2).
Economic reforms introduced in the late 1990s bore fruit some years later and the country then experienced a period of distinct economic progress, includ- ing relatively high GDP growth. By the 2000s there appeared factors that stimu- lated suburban growth: the creation of a mortgage market, the clarifi cation of the ownership structure of suburban land, and the overall increase in income in-equalities in the region [Gerbery 2010]. In these conditions the motivations be- hind moves into suburban areas (along with environmental and aesthetic prefer- ences) were amplifi ed by the practical considerations of residential property pric- es. Living beyond the city border became a pragmatic solution for many of those dwellers who could not afford to live in Bratislava [Šveda 2016; cf. Kährik et al.
2012]. The connection between migration and economic development strength- ened during the later phases of the post-socialist transformation [Novotný 2016].
Statistics from the 2011 National Census reveal that more than 45 000 in- habitants moved into the municipalities in the hinterland of Bratislava between 2000 and 2011. The annual net migration rate peaked in 2005–2008 at 19.3 ‰ (Fig- ure 1). People migrating from Bratislava made up 36% of all in-migrants into the hinterland, while 28% migrated from other hinterland municipalities and 29%
from other regions of Slovakia. The share of people who moved to the suburbs from Bratislava out of the total number of people who moved into the individu- al municipalities during the monitored period was 26.7–92.3%. This fi gure was above 50% in just 18 out of 111 analysed municipalities (Figure 3). However, it is Figure 2. Dwelling construction in the Bratislava Functional Urban Region
Source: Based on data from SOSR (2015).
0 1000 2000 3000 4000 5000
1997
Number of constructed dwellings
Bratislava Hinterland analysed period
2000 1999
1998 2001 2002 20032004 2005 2006 2007 20082009 2010 2011 2012 2013 20142015
Figure 3. Migration to the hinterland of the Bratislava Functional Urban Region
Number of in-migrants 2000–2011
50 100 500 1 000
Number of in-migrants from Bratislava 2000 – 2011
10 100 500 1 000
Share of in-migrants from Bratislava in total municipality in-migration 2000 – 2011 (‰)
0.0 – 15.00 15.1 – 30.00 30.1 – 40.0 40.1 – 50.0 50.1 <
Total population change
2000 – 2011 (‰) 0.0 – 10.00 10.1 – 20.00 20.1 – 30.0 30.1 – 60.0 60.1 <
Bratislava Bratislava FUR Military area 0 5 10 15 20 Km
Source: Based on data from SOSR.
Figure 4. Dwelling construction and property prices in the hinterland of the Bratislava Functional Urban Region
Source: Based on data from SOSR and the Institute for Financial Policy (2015).
Number of constructed dwellings (2003 – 2011)
100 500 1 000
Property prices*
(€/m2 of floor area) 1100 –1200 1000 –1100 900 –1000 800 – 900 700 – 800 >700
The average selling price of a flat in the real-estate market during the period 2011–2012. The value of 70 m2 and 110 m2 of floor area is considered.
*
Bratislava Bratislava FUR Military area
0 5 10 15 20 Km
important to bear in mind that this fi nding may be biased to a certain extent by the more complex migration trajectory of many inhabitants. Numerous migrants who (according to the statistical evidence) moved into the hinterland of Bratislava from other regions of Slovakia had lived for several years in the city, but had never registered their permanent residence there (living in rented housing); they therefore refl ect behavioural patterns that are more like those of the inhabitants of the capital rather than those of their original place of residence. Consequently, the reliability of migration statistics is limited as evidently the record of migra- tion to the hinterland of Bratislava is incomplete [Šveda and Podolák 2014]. Given the above-mentioned limitations of the data, the real movement of the population cannot be precisely monitored. For the same reason it is suitable to complete the migration statistic with the data on housing construction.
The monitored period of 2003–2011 may be considered signifi cantly dy- namic from the perspective of the volume of housing construction as the scope and form of this construction is unprecedented in Slovakia as a whole. In the nine-year period 44 000 dwellings were constructed throughout the Bratislava Functional Urban Region, 20 000 of them in the hinterland. Housing construction had a rising tendency and peaked in 2007–2009, when 6000 dwellings were being built annually. After 2009, housing construction slowed because of the economic crisis and the consequent economic uncertainty of the population and the stake- holders in the real estate market (investors and banks). This decline did not last long and it has been replaced in recent years by an even more intense pace of dwelling construction, as growth in the hinterland has come to outperform that in the urban core (Figure 2).
As far as spatial distribution is concerned (Figure 4), the biggest volume of housing construction in the hinterland of Bratislava was located in the cities of the studied region (Pezinok, Stupava, Senec), which attract suburban migrants by combining ‘rural living’ in an urban area with a suffi cient infrastructure of amenities. The most intensive housing construction took place in municipalities within the immediate vicinity of Bratislava. We can observe a continuous decline in housing construction with increasing distance from Bratislava. The same ap- plies to property prices differentiation. The only exception is the territory in the north-eastern direction from the city, where the prices have remained at the same high level (despite the increasing distance from Bratislava), refl ecting the attrac- tivity of these areas (Figure 4).
Data and methods
Before we introduce the methodology used in this study, we shall briefl y describe the spatial frame and data. The spatial frame is defi ned by the Bratislava Func- tional Urban Region (FUR), identifi ed by Bezák [2014] on the basis of daily urban systems. The construction of FUR refl ects the complex spatial and functional re-
lationships between the city and its hinterland and it is therefore an appropriate spatial framework for monitoring suburban processes. The hinterland consists of 111 municipalities, the largest is the city of Pezinok, with 21 000 inhabitants, and the smallest is Kyselica, with just 140 inhabitants. There are six more small cities with a population ranging from 6000 to 17 000 inhabitants, and 104 municipalities with an average population size of 1400. The population (in 2011) of the whole region is 650 000 (430 000 in the city core; 220 000 in the hinterland).
The analysis is based on four data sets: migration records, housing con- struction, property prices, and the land use database.
Migration records: The fi rst data set is based on anonymous microdata from the Population Census 2011 [SOSR 2011]. Data on 45 000 in-migrants who moved to the hinterland of Bratislava during the period of 2000–2011 were analysed. In terms of suburban development, this twelve-year period can be considered out- standingly dynamic and extraordinary in the context of the wider demographic and housing development in Slovakia [Šveda 2014; Novotný 2016].
It should be noted that we do not investigate the hinterland of Bratislava as a complex spatial system. The aim of this study is to reveal the hidden territorial structure of the Bratislava hinterland in terms of ongoing processes, which are represented by ‘suburban fl ight’, along with migration fl ows of various direc- tions and intensity. This is refl ected in our approach, which does not include the work with commonly used data for municipalities, but rather uses the data based on individual migrant records, where the age structure, education, family status, nationality, economic activity, and source destination are recorded. Although the dataset contains unique migrant records, it lacks the relevant characteristic of Figure 5. The value of Moran’s Index for new suburban settlement: the example
of two municipalities (left: Ivanka pri Dunaji; right: Malinovo) Older settlement New settlement
Moran I – 0.38 Moran I – 0.78
social and economic status, which we consider indispensable. Direct data on the incomes and savings of residents—though they might be very useful in this con- text—are not available in Slovakia.1
Housing construction: The second set of data consists of the number and size of constructed dwellings during the period of 2003–2011. These data are direct records from the construction permission procedure at the municipality level. Because the new houses are built in various forms, we used an indicator of the spatial arrangement of new built-up areas, which is represented by the Morans’ Index.2 We can thus distinguish highly concentrated large-scale devel- opment sites from the more dispersed development of individual constructors (Figure 5).
Property prices: The empirical data are based on the average sales of dwell- ings (houses) in the real estate market during the period of 2011–2012 [Institute for Financial Policy 2015]. This dataset is based on a regression model, which works with the specifi c characteristics of the dwellings (fl oor level, construction material, does the dwelling has an elevator, a balcony, or a terrace, etc.), and local- ity. It should be noted that prices are the response of market supply and demand forces, and they do not necessarily refl ect the real selling price. Futhermore, resi- dential property is reported as the most valuable asset people own and therefore has the potential to be used as a measure of socio-economic status. The pattern of price distribution is remarkably useful in identifying the socio-economic ‘upper end’ and ‘lower end’, and it helps to create a more complete picture of suburban development.
Environment—land use: Out of the numerous pull factors of (suburban) mi- gration, the crucial role is played by the attractiveness of the environment. Obvi- ously, the municipalities at the foothills of the Little Carpathian (Malé Karpaty) Mountains or localities on the waterfront offer a more attractive environment than the fl at, monofunctional agricultural landscape with predominantly arable land. Differences in the attractiveness of a location for development are refl ected in the real-estate market, where the building plots at the foothill sites near forest areas or vineyards sell for prices several times higher than sites in the agricultural lowland areas. The considerable heterogeneity of the natural environment in the hinterland of Bratislava thus provides a variety of conditions for suburban devel- opment. In addition to the migration data and data from housing construction,
1 The Statistical Offi ce of the Slovak Republic collects data on the incomes, expenditures, and consumption of private households in a sample survey, but these Household Budget Surveys are ultimately available only for individual regions of Slovakia. In addition, there are data on the average monthly wage in Slovakia, but this is available only at the district level.
2 Moran’s Index is a measure of spatial autocorrelation [Cliff and Ord 1973]. A perfectly concentrated arrangement of units would give a value that is close to 1. A random dis- persed arrangement of units would give a Moran’s Index value that is close to 0.
we have therefore included the land use data from the Aggregated Areas of Land Types Database [2011].
Selected variables do not capture all signifi cant attributes; we can, however, consider them suffi ciently relevant for our attempt to capture decisive processes infl uencing the socio-spatial differentiation of Bratislava’s hinterland. A list and defi nitions of the initial set of variables are presented in Table 1.
Methods: To investigate the differentiation of suburban development and to reveal hidden forces and dependencies we tried to develop a regional typology of suburban development. The main objective was to characterise similar con- fi gurations and thereby to identify the key factors that condition the formation of individual types. The aim is to disaggregate the municipalities into several subsets in such a way that the objects in one cluster will be as alike as possible and simultaneously the degree of association between municipalities in differ- ent categories will be minimal. One of the hierarchical agglomerative methods of cluster analysis—Ward’s method—was chosen to class municipalities into a system of categories characterised by their typical features.
Regarding the conditions of this method (independent variables), our pri- mary objective was to monitor the character of the relations between indicators.
A statistically signifi cant relationship was proven between several variables.
These pairs of indicators had to be either eliminated from the analysis or the en- try variables had to be transformed into new independent hypothetical variables.
A multidimensional statistical technique that can be used for this is Factor Analy- sis (FA), which makes it possible to describe the same volume of information in the set of several correlated variables with a smaller number of new variables while losing the least amount of information [Field 2005]. It makes it possible to identify certain dimensions (factors) that explain the relationship between vari- ables with suffi cient accuracy.
From the data set it was possible to defi ne 22 separate variables, but ini- tial analyses aimed at removing redundancies and multicollinearity led to a fi - nal selection of 12 variables. Partial adequacy measures of the variables and the computed communalities showed that indicators related to age structure, sin- gle in-migrants, less-educated in-migrants, in-migrants on maternity leave, the size of new dwellings, in-migrants from the hinterland of Bratislava, and land use—vineyards had inadequate values and therefore they were excluded from the FA. This does not mean that these indicators are not important. They are just not suitable for FA and can be considered individually in other analyses. The remaining 12 indicators capture the maximum of information about the original set, and based on Bartlett‘s test of sphericity, the overall KMO measure of 0.7, par- tial measures of variable adequacy, and the explained variability can be deemed suitable for a factor analysis. The parameters of the FA model were estimated using the principal component method, based on applying principal component analysis. The principal axis method was tested and both methods offered almost identical solutions. The number of statistically signifi cant factors was determined
Table 1. Initial set of variables—part one
Variable name Variable defi nition
Migration
Migration rate The share of in-migrants in the total population of municipality in the period 2000–2011
Highly educated in-migrants
Percentage of university graduates among in-migrants to the municipality in the period 2000–2011
Less educated in-migrants Percentage of high school graduates among in-migrants to the municipality in the period 2000–2011
Married in-migrants Percentage of married among in-migrants to the municipality in the period 2000–2011
Single in-migrants Percentage of unmarried (singles) among in-migrants to the municipality in the period 2000–2011
Employed in-migrants Percentage of employed in-migrants In-migrants on maternity
leave
Percentage of in-migrants on maternity leave
Young in-migrants Percentage of age category 0–14 among in-migrants to the municipality in the period 2000–2011
In-migrants of working age A
Percentage of age category 15–49 among in-migrants to the municipality in the period 2000–2011
In-migrants of working age B
Percentage of age category 50–64 among in-migrants to the municipality in the period 2000–2011
Elderly in-migrants Percentage of age category 65+ among in-migrants to the municipality in the period 2000–2011 In-migrants of Hungarian
nationality
The share of in-migrants of Hungarian nationality out of the the total number of in-migrants to the municipality in the period 2002–2011
In-migrants from Bratislava
Percentage of in-migrants from Bratislava in the period 2002–2011
In-migrants from the hinterland of Bratislava
Percentage of in-migrants from Bratislava region (except Bratislava itself) in the period 2002–2011
In-migrants from other regions of Slovakia
Percentage of in-migrants from Slovakia (except Bratislava region) in the period 2002–2011
Construction
Dwelling construction The number of constructed dwellings per 1000 inhabitants in the period 2003–2011
The size of new dwellings The average fl oor area of constructed dwellings per 1000 inhabitants in the period 2003–2011 Moran‘s Index Measure of spatial autocorrelation of new houses
constructed in the period 2002–2012
using the criterion of an eigenvalue (the amount of information captured by a fac- tor) higher than 1. This led us to identify four components, which explain almost 80% of the variability of the variables. The original matrix of factor saturation was rotated using orthogonal Varimax rotation (it preserves the independence of original factor dimensions; the variance of the loadings is maximised) in order to reduce the number of signifi cant saturations to the minimum in each line of the factor matrix and for better interpretability of results. A pure factor solution, where each variable has a signifi cant saturation in just one component, was ob- tained (Table 2).
The fi rst component differentiates municipalities on the intensity of in-mi- gration and the volume of housing construction. Furthermore, the nature of the spatial distribution of new houses, highly-educated in-migrants, and in-migrants from Bratislava constitute this dimension. This hypothetical variable can be re- ferred to as the ‘factor of construction and migration’. The second dimension brings together three variables that capture fl at prices, the source destination of the in-migrants, and their nationality. This is commonly referred to as the ‘factor of property prices and in-migrant’s origin’. The third dimension is saturated by variables of land use (the component positively correlates with the share of arable land; the share of forests and bodies of water appears as the opposite pole). This dimension is interpretable as the ‘factor of the natural environment’. The fourth and last dimension explains only 10.4% of the total variability of the data set and brings together two variables representing employed and married in-migrants.
This hypothetical variable can be referred to as the ‘factor of the in-migrant struc- ture’.
Based on the component score computed for each municipality in the above-mentioned factorial solutions we tried to fi nd similar groupings using
Variable name Variable defi nition
Property prices
Property prices The average selling price (€/m2 of fl oor area) of fl ats in the real-estate market during the period 2011–2012. The value for 70m2 and 110 m2 of fl oor area is considered.
Environment
Land use – arable land Percentage of arable land in the total cadastral area of the municipality (2011)
Land use – forests and water bodies
Percentage of forests and water bodies in the total cadastral area of the municipality (2011)
Land use – vineyards Percentage of vineyards in the total cadastral area of the municipality (2011)
Table 1. Initial set of variables—part two
Ward’s method of cluster analysis. After verifying the statistical signifi cance be- tween each pair of correlation coeffi cients and after standardising the variables, only fi ve indicators (out of the 14 variables considered—the 10 indicators and 4 components omitted from the FA) could fi nally be entered into the cluster anal- ysis: four components and ‘land use—vineyards’. Several alternatives were tested before we chose the appropriate number of clusters. To meet the objectives of the research, the procedure fi nally chosen was the one whose results best suit a certain intuitive vision of a suitable classifi cation of municipalities into separate clusters. Although there are some methodological limitations to the suburban development typology in the hinterland of Bratislava presented here, we believe that the resulting set of municipalities fairly refl ects the intensity, arrangement, and nature of ongoing suburban processes.
Table 2. Rotated Component Matrix*
Component
Variable
Factor of construction
and migra- tion
Factor of property prices and in-migrant’s
origin
Factor of natural en-
vironment
Factor of in-migrant’s
structure
Dwelling construction .932
Migration rate .924
In-migrants from
Bratislava .741
Moran’s Index .707
University-educated
in-migrants .692
In-migrants from other
regions of Slovakia .877
In-migrants of Hungarian
nationality .798
Property prices -.739
Land use – forests and
water bodies -.953
Land use – arable land .951
Employed in-migrants .882
Married in-migrants .840
Note: Rotation Method: Varimax with Kaiser Normalisation (rotation converged in 5 iterations).
Regional typology of suburban development
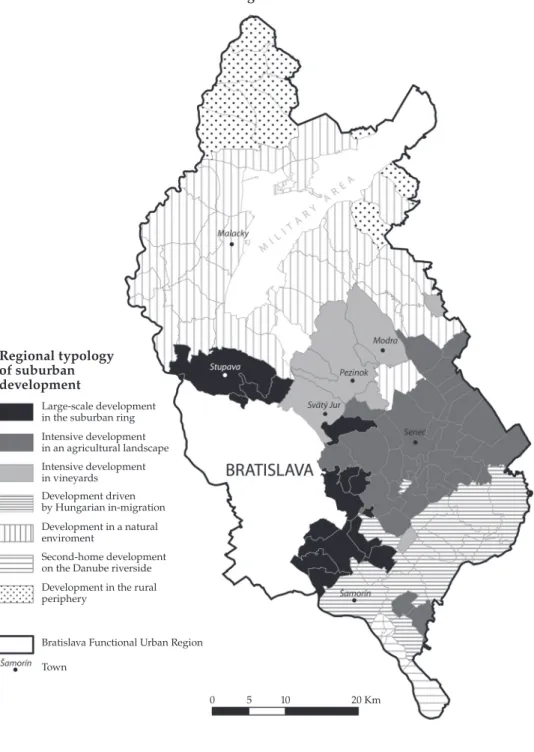
The statistical procedure mentioned above produced a series of hybrid variables (factors), each successively accounting for a proportion of the total variance in the input data and each statistically independent of one another. By applying the cluster analysis (Ward’s method) on the set of 111 municipalities constituting the hinterland of Bratislava, we identifi ed seven suburban development types that may be considered for suffi ciently numerous and spatially compact categories.
An interesting pattern in the spatial expression of these suburban devel- opment types appears (Figure 6). The identifi ed types represent a remarkably high degree of spatial compactness despite the clustering procedure did not con- tain any additional conditions regarding the spatial association of the clustered Table 3. Cluster centroids of individual indicators for the regional typology of
suburban development in the hinterland of Bratislava Fuctional Urban Region
Type no.
Suburban type Factor of construc- tion and migra-
tion
Factor of property prices and in- migrant’s
origin
Factor of natural environ- ment
Factor of in- migrant’s
structure
Land use – vine-
yards
1 Large-scale development in the suburban ring
2.17 –0.34 –0.16 –0.11 –0.36
2 Intensive development in an agricultural landscape
–0.25 –0.36 0.90 0.45 –0.13
3 Intensive development in vineyards
0.10 –0.66 –0.51 0.36 3.05
4 Development with Hungarian in-migration
0.04 1.35 0.70 –0.26 –0.17
5 Development in a
natural environment –0.61 –0.64 –0.65 0.17 –0.25
6 Second-home development on the Danube riverside
0.15 1.62 –1.88 0.75 –0.43
7 Development in
the rural periphery –0.63 0.67 –0.59 –1.85 –0.43
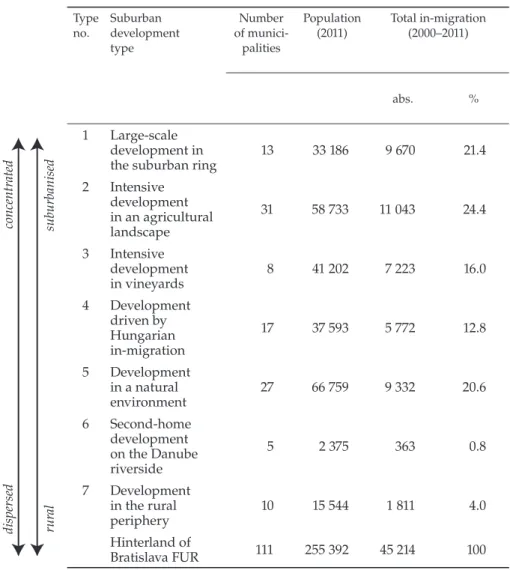
Table 4. Selected features of regional typology of suburban development in the hinterland of the Bratislava Fuctional Urban Region—part one
Type no.
Suburban development type
Number of munici-
palities
Population (2011)
Total in-migration (2000–2011)
abs. %
1 Large-scale development in the suburban ring
13 33 186 9 670 21.4
2 Intensive development in an agricultural landscape
31 58 733 11 043 24.4
3 Intensive development in vineyards
8 41 202 7 223 16.0
4 Development driven by Hungarian in-migration
17 37 593 5 772 12.8
5 Development in a natural environment
27 66 759 9 332 20.6
6 Second-home development on the Danube riverside
5 2 375 363 0.8
7 Development in the rural periphery
10 15 544 1 811 4.0
Hinterland of
Bratislava FUR 111 255 392 45 214 100
General characteristic of suburban development dispersedconcentrated ruralsuburbanised
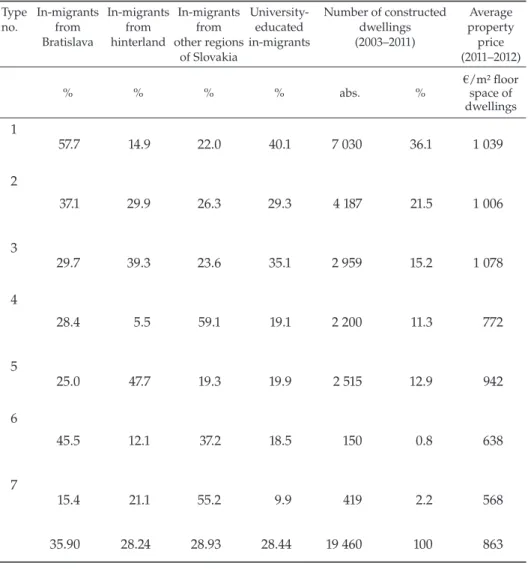
Type no.
In-migrants from Bratislava
In-migrants from hinterland
In-migrants from other regions
of Slovakia
University- educated in-migrants
Number of constructed dwellings (2003–2011)
Average property price (2011–2012)
% % % % abs. %
€/m² fl oor space of dwellings 1
57.7 14.9 22.0 40.1 7 030 36.1 1 039
2
37.1 29.9 26.3 29.3 4 187 21.5 1 006
3
29.7 39.3 23.6 35.1 2 959 15.2 1 078
4
28.4 5.5 59.1 19.1 2 200 11.3 772
5
25.0 47.7 19.3 19.9 2 515 12.9 942
6
45.5 12.1 37.2 18.5 150 0.8 638
7
15.4 21.1 55.2 9.9 419 2.2 568
35.90 28.24 28.93 28.44 19 460 100 863
Table 4. Selected features of regional typology of suburban development in the hinterland of Bratislava Fuctional Urban Region—part two
Figure 6. Regional typology of suburban development in the hinterland of the Bratislava Functional Urban Region
Regional typology of suburban development
Large-scale development in the suburban ring Intensive development in an agricultural landscape Intensive development in vineyards Development driven by Hungarian in-migration Development in a natural enviroment
Second-home development on the Danube riverside Development in the rural periphery
Bratislava Functional Urban Region Town
0 5 10 20 Km
units (municipalities). The basic characteristics for the individual suburban types are listed in Table 4, which states the number of municipalities per type and the summary values of selected variables.
Before we proceed to the description of individual suburban development types, we would like to briefl y comment on their nomenclature. The typology used in this study adopts a context-sensitive strategy. We investigate the local geographies of residential development and we introduced a typology of sub- urban neighbourhoods based on the most signifi cant features. The basis for the interpretation of individual types is the value of the cluster centroids listed in Table 3. The ordering of suburban types is also relevant as it refl ects the posi- tion of a particular type on an axis that runs from the most suburbanised to the most rural, and from the most concentrated to the most dispersed character of new residential construction, respectively (Table 4). Findings resulting from the logical examination of the problem, previous univariate analysis of the variables, as well as the authors’ long-term experience with research in this area played a signifi cant role.
Type 1—Large-scale development in the suburban ring. The location of munici- palities within this type in the immediate vicinity of Bratislava predetermines them to become the area of the most intensive in-migration and housing con- struction. More than 9000 inhabitants moved in and 7000 dwellings were com- pleted in the municipalities of this type during the reviewed period. The source of the migration is the decisive factor for identifying the processes ongoing in the city hinterland. The migrants from Bratislava constitute a majority (58%) in this type. If residential suburbanisation is understood as the relocation of the popula- tion from the core city to new construction in the city hinterland then this type is its spatial demonstration. Besides originating from Bratislava, the migrants into this zone have the highest share of university-educated people. Although we lack more detailed characteristics of social structure, we may assume that the high prices of real estate in the municipalities of this type have a signifi cant selective effect on migration. This factor as well as other research [Šveda 2016] indicate that a typical migrant into this zone is a university-educated inhabitant of Bratislava with a higher societal status seeking to increase his/her quality of housing (to live in a proprietary house, move from a fl at to a house) and at the same time maintain ties to the city3.
The city population brings a whole spectrum of specifi c features into the ru- ral hinterland, which manifest themselves mostly in forms of housing (the dense construction with a high degree of visual separation is more reminiscent of an ur-
3 These fi ndings are based on original data from a questionnaire survey in the selected suburban localities in the hinterland of Bratislava [Šveda 2016]. The results of the vast questionnaire survey, carried out on a sample of 500 respondents, imply that living in this suburban type is rather a pragmatic solution to housing issues rather than a dream-come- true of living in the countryside in the city hinterland.
Figure 7. An example of large-scale development in the hinterland of Bratislava, the case of Chorvástky Grob municipality—Čierna Voda locality (top: 2003, bottom: 2015)
Source: Google Earth.
ban environment than a rural one). A high concentration of housing construction is a characteristic feature of this type, often translated in the form of large-scale residential development with specifi c urbanism (an amorphous street network, blind and irregular alleys). In most cases, these new housing units are the result of big development projects, which prepare the infrastructure for individual con- struction works and/or build standardised houses. Although these areas usually tie in with the existing settlement network, they are usually connected with the rest of the municipality through the bottleneck of a single road.4 New residential development with signifi cant signs of separation is emerging primarily in locali- ties with an aesthetic environment (the slopes of the Little Carpathian Moun- tains) and with high property prices (Marianka, Záhorská Bystrica, Limbach).
New residential localities in the middle of agricultural fi elds and with little con- nection to the infrastructure and service networks are found only to a limited extent. The largest suburbium with greenfi eld development is localised in the municipality of Chorvátsky Grob (Figure 7). The incompetent and ineffi cient ap- proach of the local government (also supported by the unclear legal situation) has allowed investors to build a suburb with inadequate infrastructure and lack- ing any spatial links. The spontaneous and unrestrained construction work has generated a number of problems, which have degraded the quality of life in this locality. In the 2001–2011 period the population of the municipality more than doubled (from 1571 to 3932 inhabitants) and more than 1400 new dwellings were constructed. Due to this extensive construction, the municipality of Chorvátsky Grob has become a symbol of suburban development (urban sprawl) that has both positive and negative impacts.
Type 2—Intensive development in an agricultural landscape. The second subur- ban type is formed by municipalities with an agricultural character, where arable land dominates the land-use structure (the factor of the natural environment).
This suburban type consists of a diffusion of several migration fl ows. The vol- ume of migration fl ows from the core city, the hinterland, and outer parts (of the city) are about equal in size (see Table 4). Although the share of migrants from Bratislava (37%) may be underestimated (as a result of incomplete evidence), the volume of tangential migration is signifi cant (30%). The processes and motiva- tions underpinning the tangential migratory fl ows, however, are not clearly iden- tifi able and would require separate research to identify them. We can assume that important factors causing this movement include, alongside family-related motivations, the wish to live closer to one’s workplace or to enhance the quality of one’s housing.
4 During sales the closed nature of the streets is presented as an advantage providing silence and security. The need for isolation from the surroundings along with stability in social and material areas contribute to creating the ontological safety of suburbia [cf. Gid- dens 1990].
This type makes up the largest number of municipalities and inhabitants in the overall volume of migration. Despite the large volume of construction in this zone (4000 new units), compact suburbia are not being created and the pre- vailing form of construction is houses built by individual owners with the aid of small contractors. Larger settlements (Senec, Bernolákovo, Ivanka pri Dunaji) are, however, an exception, as they tend to feature larger projects for new residential zones. Despite this, a characteristic feature of this zone is its fragmented and dis- persed spatial pattern. The visual appearance of some new residential areas in this suburban type closely resembles the suburbia listed under Type 1. It should be noted that suburban housing with architectural and aesthetic features are not just associated with migrants from big cities, but are a refl ection of broader cul- tural trends. Residential suburbanisation can be viewed as a certain consumption pattern that is being reproduced regardless of the source or motivation of subur- ban migrants.
Type 3—Intensive development in vineyards. The municipalities on the south- eastern slopes of the Little Carpathian Mountains offer ideal conditions not only for vine growing, but also for residential construction (3 000 new units). This sloped landscape has become an extremely attractive area of high aesthetic value.
The fragmented ownership structure of the vineyards has resulted in construc- tion that has a very selective spatial character reminiscent of a mosaic, where the former vineyards areas alternate with smaller residential projects, solitary villas, or the abandoned vineyards. The total number of in-migrants reached 7000 in the reviewed period. The fact that this area has the second-largest share of universi- ty-educated migrants suggests that it has become a destination for residents from a higher social class. The selective effect is amplifi ed by the high prices of the plots. Prices are driven up not just by the ever decreasing number of free plots, but also by speculative purchases of abandoned vineyards in the hope that they will be reclassifi ed as construction plots. One of the distinctive features of this zone is that it contains as many as three cities (Svätý Jur, Pezinok, Modra), which increase the attractiveness of the area by offering better access to amenities and a specifi c wine culture.
Type 4—Development driven by Hungarian in-migration. The fourth suburban type is a rather compact zone in the south-eastern part of the FUR. This zone, exclusively rural in character, is a space with smaller scale of suburban develop- ment and is mainly shaped by the second component (the factors of the in-mi- grant’s origin and property prices). The source destination of migration is located outside the city region (59%) and a characteristic feature is the increased share of migrants of Hungarian nationality. This fact is not surprising as historically the municipalities in this region have had a larger share of inhabitants from the Hun- garian ethnic minority, thus creating a familiar environment for migrants from the southern regions of Slovakia.
The small share of in-migrants with university education and employed in-migrants may imply that this zone is becoming an area for ‘blue-collars’ who
want to live near the capital, where the largest number of job opportunities are concentrated for this social group in the construction industry and similar eco- nomic activities. However, this is just a hypothesis not supported by more de- tailed research. Nevertheless, the concentration of migrants with lower social sta- tus in this particular area is driven by the fact that this is the area with the most affordable real-estate prices in the hinterland of Bratislava. The fl ight of residents from the provincial periphery to the metropolitan areas—typical for the socialist period—apparently continues [cf. Stanilov and Sýkora 2014]. Job motives may be an important factor for migrants moving into the metropolitan region from elsewhere and a signifi cant feature of the rural urbanisation process [cf. Kok and Kovács 1999].
Type 5—Development in a natural environment. This type of development re- lates to the municipalities located on the north-west slopes of the Little Carpathi- an Mountains or in the vicinity of the alluvial forests of the Morava River, which features a large share of forest area and bodies of water. The 26 municipalities identifi ed as belonging to this type have become the new home for more than 9000 in-migrants in the reviewed period. Despite the relatively large volume of in-migration, the intensity of residential construction has remained below aver- age. This suburban type is free from large development projects and more than 2500 housing units were built, mainly in the form of detached houses that do not create signifi cant spatial concentrations. Given the favourable morphology, the natural environment, and the relatively good transport connection (a highway to the Czech Republic), this part of Bratislava’s hinterland is not the site of such intensive development as in Types 2 and 3. This may have to do with the origin of the in-migrants, whose source destination is the hinterland themselves (48 %), and who are willing to live in older (reconstructed) houses—the total number of in-migrants in this type exceeds the capacity of constructed dwellings there, which may indicate that the migrants are moving not just into new residential localities, but also into older housing stock.
Type 6—Second-home development on the Danube riverside. As far as the num- ber of inhabitants is concerned, these municipalities are the smallest, accounting for just 1% of migration and 1% of housing construction located in 5 municipali- ties with (a total of) 2400 inhabitants. The reason for designating this less popu- lous case of development as a specifi c type lies in its specifi c conditions, which manifested itself in multivariate analysis. This type comprises several munici- palities on the banks of the Danube River. The river acts as an important feature that affects the nature of the land use (a large share of bodies of water and ripar- ian forests—the 3rd component), but at the same time it acts as a serious traffi c barrier (the river can only be crossed by ferry). The low property prices, isolated character of the area, and attractive natural environment create favourable condi- tions for recreational houses and second-home living. This is indicated not only by the character of the new construction but also by the migrant structure, which prevailingly consists of migrants from Bratislava (45%) and of an older age (50+).
The phenomenon of owning a second home has a long tradition in CEE countries (e.g. Estonia, the Czech Republic). While during the state-socialist period second homes were the result of a need for individual recreation, currently they repre- sent more a form of (long-term) investment.
Type 7—Development in the rural periphery. As the name of this suburban type suggests, it refers to a periphery of FUR, where the infl uence of the core city is so low that it is diffi cult to estimate whether the minimal volumes of in-migration and housing construction are the result of suburban development or rather the outcome of natural population transfers due to job or marital status changes.
This peripheral type has the lowest intensity of in-migration, the smallest share of university-educated in-migrants, and the in-migrant structure factor with the lowest value. The minimal amount of housing construction in this area suggests that the migrants are moving into already existing houses. The character of some reconstructions points to the fact they are used as second homes.
Discusssion
The typology presented above provides us with a better understanding of the dependencies and hidden forces behind the differentiation of suburban develop- ment and forms a basis on which we can discuss our research questions. Using the analytical frame of factorial analysis we sorted the key factors that condition the formation of individual types of suburban development. The intensity and spatial arrangement of housing construction, the intensity of in-migration, in- migrant origin, the share of well-educated in-migrants, and property prices can be identifi ed as the most signifi cant factors. Other factors played a less important role in the scale of consideration (see Table 2).
Our analysis confi rms the results of other studies in the CEE region showing that people who are well educated and belong to well-off social groups are the typical actors in suburbanisation [cf. Kok and Kovács 1999; Hirt 2007; Kährik and Tammaru 2008; Krišjāne and Bērziņš 2012; Špačková and Ouředníček 2012]. These people prefer localities in the vicinity of the city, while people with primary and secondary education are more likely to move to more remote residential areas.
The formation of a better-educated and well-off ‘suburban ring’ (Type 1) contrib- utes to socio-economic clustering in the suburban space. This selective character of migration is reinforced by the different sources (origins) of the newcomers, where only less than half of new suburban residents originate from the core city. The rest of the new residents come from outer parts or move within the hinterland.
Suprisingly, the age structure does not play a role in the spatial differentia- tion of migration. One would expect that housing in more remote suburban areas would be more available to younger and medium-income households, but all that we can identify is a partial migration fl ow of older urban dwellers moving to second-home-like localities in Type 5 and 6. As Kährik and Tammaru (2008) observed in Tallin, young people are most likely to take risks and move directly to