MORAVIAN
GEOGRAPHICAL REPORTS
VOLUME 17 NUMBER ISSN 1210 - 8812
1
2009
Fig. 2: Block accumulation on the right bank of Dyje River not far from the state border under the Býčí Hora Mt., Locality 58. An example of exposed accumulation.
(Photo L. Kubalíková)
Illustrations related to the paper by L. Kubalíková
Fig. 1: Dyje River valley in the western corner of the Podyjí National Park. The frost-riven cliff „Na Vyhlídce“ in the front, the ridge of Ledové sluje (Ice caves) in the background.
(Photo L. Kubalíková)
Fig. 3: Traffic saddle in the centre of Zlín (Photo P. Dohnal 2009)
Illustrations related to the paper by O. Hájek et T. Siwek Fig. 1: Promotion postcard issued in the autumn of 1918 by the Association of German National Socialists illustrates the ideas of supreme German political circles about the division of Czech lands into new unilingual countries within Austria-Hungary. The concept was soon given up upon the vision of creating independent national states of Czechoslovakia and German Austria. However, the land division and the claim for German language enclaves persisted. Territorial claims recorded here are much greater than as they were applied later (included were Czechspeaking areas in the regions of Pilsen, Budějovice Olomouc and Brno). Source: BULÍN, H.: Jiskry a plameny. Own edition, Brno, 1930, 170 pp. Illustrations related to the paper by R. Jašš et M. Fňukal Fig. 2: Traffic congestion on the road crossing Zlín-Malenovice (Photo O. Hájek 2008)
Articles:
Zbigniew DŁUGOSZ, Sławomir KUREK
POPULATION AGEING AND ITS PREDICTIONS FOR 2030 IN THE MAŁOPOLSKIE VOIVODSHIP COMPARED TO POLAND AND EUROPE . . . . 2 (Stárnutí populace a prognóza vývoje populace do roku 2030 v Malopolském vojvodství ve srovnání s vývojem v Polsku a Evropě)
Katja VintaR Mally
BALANCING SOCIO-ECONOMIC DEMANDS AND ENVIRONMENTAL PRESSURES:
MISSION IMPOSSIBLE? . . . . 19 Vyrovnávání socio-ekonomických požadavků
a environmentálních tlaků: nemožný úkol?) Oldřich HÁJEK, tadeusz SiWEK
THE PERCEPTION OF PUBLIC CITY TRANSPORT (CZECH REPUBLIC) IN ZLÍN AS AN ALTERNATIVE TO INDIVIDUAL TRANSPORT BY ITS POTENTIAL USERS ACCORDING TO THE LEVEL OF THEIR INCOME . . . . 30 (Vnímání městské hromadné dopravy ve Zlíně (Česká re- publika) jako alternativy k individuální dopravě z hlediska příjmových skupin jejich potenciálních uživatelů)
Richard Jašš, Miloš FňUKal
THE GERMAN LINGUISTIC ENCLAVES OF BRNO, OLOMOUC AND JIHLAVA DURING
GERMAN-AUSTRIAN IRREDENTISM
IN THE AUTUMN OF 1918 . . . . 40 (německé jazykové ostrovy Brno, Olomouc a Jihlava v německo-rakouské iredentě na podzim 1918)
Reports:
lucie KUBalíKOVÁ
BLOCK ACCUMULATIONS IN THE WESTERN PART OF THE PODYJÍ NATIONAL PARK (CZECH REPUBLIC): PRELIMINARY ANALYSIS OF THEIR DISTRIBUTION . . . . 49 (Blokové akumulace v západní části národního parku Podyjí (Česká republika): předběžná analýza jejich rozšíření)
Review:
Milan KOnEČný
VYSOČINA REGION . THEMATIC ATLAS . . . . 56 (tematický atlas kraje Vysočina)
MORAVIAN GEOGRAPHICAL REPORTS
EDITORIAL BOARD
Bryn GREER-WOOttEn, york University, toronto andrzej t. JanKOWSKi, Silesian University, Sosnowiec Karel KiRCHnER, institute of Geonics, Brno
Petr KOnEČný, institute of Geonics, Ostrava ivan KUPČíK, Univesity of Munich
Sebastian lEntZ, leibniz institute for Regional Geography, leipzig
Petr MaRtinEC, institute of Geonics, Ostrava Jozef MlÁDEK, Comenius University, Bratislava Jan MUnZaR, institute of Geonics, Brno Philip OGDEn, Queen Mary University, london Metka šPES, University of ljubljana
Milan tRiZna, Comenius University, Bratislava Pavel tRnKa, Mendel University, Brno
antonín VaiSHaR, institute of Geonics, Brno Miroslav VySOUDil, Palacký University, Olomouc arnošt WaHla, University of Ostrava
Jana ZaPlEtalOVÁ (editor-in chief), institute of Geonics, Brno
Georgette ZRinSCaK, University Sorbonne, Paris
EDITORIAL STAFF
Bohumil FRantÁl
tomáš KREJČí, technical editor
Zdeněk nOVOtný, technical arrangement Martina Z. SVOBODOVÁ, linguistic editor
PRICE
280 CZK (excluding Vat) per copy plus the postage 800 CZK (excluding Vat)
per volume (four numbers per year) plus the postage
PUBLISHER
Czech academy of Sciences
institute of Geonics, v. v. i., Branch Brno Drobného 28, CZ-602 00 Brno
identification number: 68145535
MAILING ADDRESS
MGR, institute of Geonics aSCR, v. v. i.
Drobného 28, 602 00 Brno Czech Republic
(fax) 420 545 422 710 (e-mail) [email protected] (home page) http://www.geonika.cz Brno, March, 2009
nOVPRESS s.r.o., nám. Republiky 15, 614 00 Brno
© inStitUtE OF GEOniCS, v. v. i. 2009 ISSN 1210-8812
POPULATION AGEING AND ITS PREDICTIONS FOR 2030 IN THE MAŁOPOLSKIE VOIVODSHIP
COMPARED TO POLAND AND EUROPE
Zbigniew DŁUGOSZ, Sławomir KUREK Abstract
the demographic situation and future perspectives related to the level and pace of population ageing in Małopolskie Voivodship (a province located in southern Poland, with its capital in Krakow), is compared to the situation in Poland and other European countries (i.e., not only those making up the EU-25). the analysis is based on official empirical materials derived from World Population Prospects, Eurostat and the Central Statistical Office in Warsaw. the results showed that Małopolskie Voivodship, seen in the context of the rest of Poland and Europe, is and could be one of the demographically youngest areas.
this does not mean that the level and dynamics of ageing in all parts of the region are low. it must be remembered that, while in West European countries population ageing has reached an advanced level and its pace is slowing down, the processes are only now gaining momentum in East European countries, including Poland.
Shrnutí
Stárnutí populace a prognóza vývoje populace do roku 2030 v Malopolském vojvodství ve srovnání s vývojem v Polsku a Evropě
Cílem článku je prezentovat současnou situaci a perspektivy stárnutí obyvatel v Malopoském vojvodství (území v jižním Polsku s centrem Krakov) ve srovnání se situací v Polsku jako celku a dalších evropských zemích, nejen členů EU-25. analýza vychází z oficiálních empirických materiálů odvozených z populační prognózy světa, Eurostatu a Centrálního statistického úřadu ve Varšavě. Výsledky ukazují, že Malopolské vojvodství, viděno v kontextu celého Polska a Evropy, je a může být jedním z demograficky nejmladších regionů. To neznamená, že stupeň a dynamika stárnutí je nízká ve všech částech regionu. Je třeba pamatovat, že stárnutí obyvatelstva v západoevropských zemích dosáhlo pokročilého stupně a jeho rychlost zde klesá, zatímco ve východoevropských zemích včetně Polska je stále na vzestupu.
Key words: population ageing, territorial distribution, Europe, Poland, Małopolskie Voivodship
1. Introduction
One of the most serious problems of our time, though not new in Europe, is that of population ageing. It has already occurred in some countries with varying intensity, yet never has it been so widespread across our continent as it is at present. Historically, various criteria have been adopted in order to assess the status and trends related to population ageing.
General typological assumptions developed in the early 19th century by Sundbärg (1899) in the form of age pyramid have not lost their validity. Yet some of the later attempts to assess the situation related to demographic age and classification standards created in this respect inter alia by J. Clarke (1965), or by the leading Polish demographer E. Rosset (1959), have not stood the test of time and do not fully reflect the
present-day situation, at least in Europe. Nowadays the situation is determined both by demographic factors and by a wide range of social and economic conditions.
On the one hand, rising life expectancy, dropping birth rate, foreign migration, wave-like transition of post- war baby boomers and their echoes (compensating for the loss of life during World Wars I and II) and, on the other hand, the changing life style and family model, improved social and economic conditions, wealth, comfort, growing emancipation and increased professional activity of women, as well as the resultant fall of fertility rate, are just some of the direct and indirect causes of population ageing (Długosz 1996;
Grundy 1996; Golini 1997; Kurek 2003; Kurek 2004;
Rowland 2003; Kinsella and Philips 2005; Długosz and Kurek, 2006). These developments have been termed the „Second Demographic Transition“ by Van
de Kaa (1987, 1999, 2003) and Lesthaeghe (1995, 2000).
Main driving mechanisms underlying the transfor- mations of demographic behaviour are family-related changes including an increase in the acceptance of non-family living arrangements, the postponement of marriage, increased births outside marriage as well as increased divorce rates. A fertility decline below replacement level, which is the main indicator of SDT, occurred in western and northern Europe in the 1960s, then it diffused to southern Europe. In post-socialist countries, the demographic changes have progressed during the era of profound societal transformation, marked by the introduction of market economy (Kotowska, 1999; Sobotka, Zeman, Kantorova, 2003).
Naturally, a direct relation between the demographic situation and social and economic conditions over a short period of time cannot be derived. The latter, developing over a long period, stimulate a new quality and potential, thus creating a new picture of the society. In practical terms, obtaining knowledge about the level and scale of the rate of population ageing has two very important aspects.
One layer of perceiving the problem can be reduced to the economic aspect – i.e. who is going to provide resources for pensions and disability allowances of the non-working population and how. On the other hand, the problem can be seen in the context of a number of social and medical securities for the oldest population, which is often no longer self-sufficient. It is difficult to assess which component of population growth contributes more to the level and dynamics of population ageing.
Van de Kaa (1999) broadened the concept of Second
Demographic Transition (SDT) incorporating into it trends in international migrations and mortality particularly at older ages. Advanced industrialised countries have become countries of immigration and the magnitude of migration increased after the opening of labour markets for new EU members, including Poland. The effect of migration has stronger effect on the population age structure in smaller populations. In turn, a permanent increase in life expectancy, especially at advanced ages has an important impact on ageing (Preston, Himes, Eggers, 1989; Caselli, Vallin, 1990;
Kinsella, Philips, 2005).
In Poland, one of the demographically younger region is Małopolska (Little Poland) with its capital of Krakow, although it is spatially diversified with rural and agricultural areas in the north, industrial zone in the middle (along the transportation route from Silesia to the Ukrainian border) and its southern part with the developing tourism. Małopolska is characterised by high birth rates as well as by the natural population growth.
On the other hand, the southern part of the region is historically the area of massive population emigration to America. However, the population loss caused by this out-migration was compensated by high fertility.
Therefore, the aim of this article is to present the situation and perspectives related to the level and pace of population ageing in the Małopolskie Voivodship, as compared to Poland and other European countries, not only those making up the EU-25. The analysis dwells on official empiric materials. For Poland, the data derive from the outcomes of the 1988 and 2004
Fig. 1: administrative division of Poland according to voivodships
Fig. 2: administrative division of the małopolskie voivodship according to powiats censuses and forecasts for the year 2030, while that
for Europe include Eurostat data for 1991 and 2004 and forecasts for 2030. Due to the lack of comparable materials, the analysis of the share of persons aged 85 and over and the index value construed on it were based on the 2002 census data for Poland, while for the European projections, data for 2030 originate from World Population Prospects; United Nations (2006). Thus, the materials gathered cover a similar cross-section of time and refer to comparable territorial units. The analysis for Europe excludes Turkey (often considered a part of the European continent on account of its candidature for the EU) and the Vatican – due to its being a specific type of state. In terms of territorial distribution, the analysis for Poland is based on the present-day administrative division of the country (in effect since 1 January 1999) into 16 regions (voivodships; Fig. 1), while the analysis for the Małopolskie Voivodship dwells on the official division into towns and gminas. Only the territorial distribution forecasts for the region are presented according to poviats (Fig. 2), as such forecasts have not been drafted for gminas and towns. As a result, the territorial distribution, as presented in the figures, is generalised. Besides, it must be noted that, in order to facilitate the comparison of the parameter values assumed for territorial cross-sections and timeframes involved, common class groups have been adopted to present how the population ageing has proceeded and will proceed in the future.
2. Methodology
In order to present a full picture of the situation, the analysis is mostly based on generally accepted indicators used to assess the magnitude and dynamics of population ageing. Thus, the analysis uses both static measures: the proportion of persons aged 65–
85 and over, and the ageing index (ISD), and dynamic measures, i.e. the dynamic ageing index (WSD).
(1) ISD
=
P65+/ P0-14× 100, where:ISD – ageing index; P65+ – population aged 65 and over;
P0-14 – population aged under 15
(2) WSD = [P(0-14)t− P(0-14)t+n] + [P(≥65)t+n −P(≥65)t] where:
WSD – dynamic ageing index
P(0-14) – share of population aged 0–14 at the beginning of the period studied
P(0-14)t+n – share of population aged 0 – 14 at the end of the period studied
P(≥65)t+n – share of population aged 65 and more at the end of the period studied
P(≥65)t – share of population aged 65 and more at the beginning of the period studied.
P65+ – population aged 65 and over P85+ – population aged 85 and over P50-64 – population aged 50 – 64
3. Population according to the proportion of persons aged 65 and over
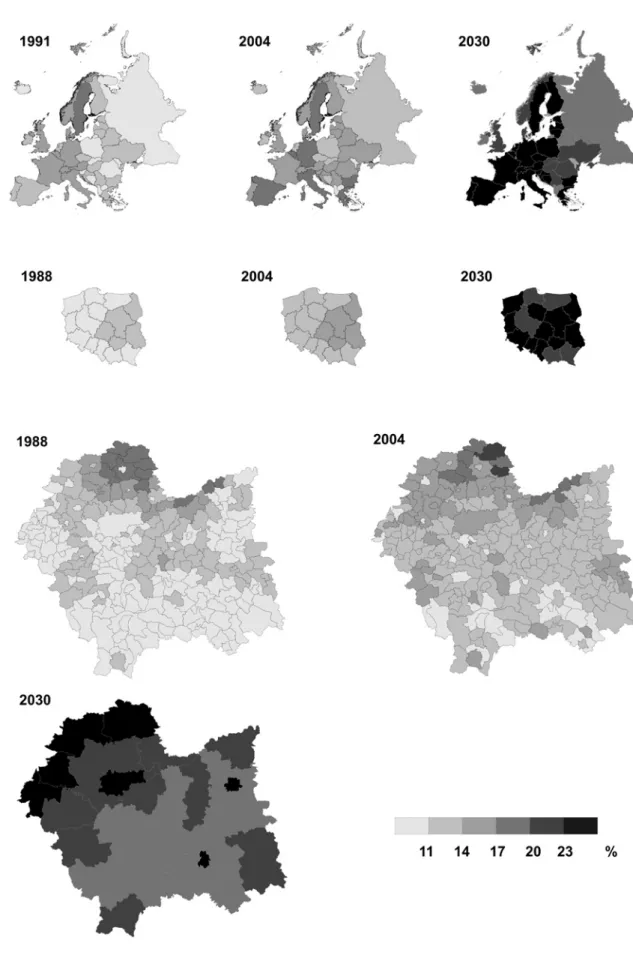
The first symptom of population ageing is a growing proportion of persons considered old, i.e. those aged 65 and over – usually taken as a definition age limit for the socio-demographic category of “seniors”. Sixty- five years of age are also in the most of EU countries a legal (regular) age limit for retirement (for obtaining full, unreduced pension). In retrospective terms (Fig. 3), the highest proportion of this age group in the Małopolskie Voivodship in 1988 (with the regional average of 10.1%) was registered in the northern, rural and agricultural gminas of the voivodship (with the values exceeding 18 per cent; Tab. 1). Compared to the rest of Poland (average 9.8%), such high levels were not recorded in any other region. In Europe (1991), the most aged countries were Monaco and Sweden. The lowest proportion of population aged 65 and over was observed mainly in small- and medium-sized towns of the Małopolskie Voivodship (between 5 and 7 per cent).
A positive value of the index of percentage changes in the age structure indicates the ongoing process of population ageing in the given unit in the period analysed, and the higher the value of the index, the more advanced this process is. By analogy, the negative value of the index highlights the fact that the population is becoming younger.
The analysis also uses measures presenting the relations between old and younger generations, the latter being expected to provide “economic support”
(potential support ratio – WPW,not to be confused with the burden index expressed by reverse relation), as well as “social support” (parent support ratio – WWM).
(3) WPW = P15-64/ P65+,
(4) WWM = P85+/ P50-64× 100 where:
WPW – potential support ratio WWM – parent support ratio P15-64 – population aged 15 – 64
EUROPE
(countries) POLAND
(voivodships) MAŁOPOLSKIE
(gminas and poviats)
1991 1988
Monaco 22.2 Łódzkie 12.2 Racławice - rural (Miechowski) 19.9
Sweden 17.8 Świętokrzyskie 11.6 Kozłów - rural (Miechowski) 19.2
Norway 16.3 Lubelskie 11.5 Książ Wielki - rural (Michowski) 18.8
Macedonia 8.1 Lubuskie 8.0 Andrychów - urban (Wadowicki) 6.2
Bosnia and Hercegovina 7.2 Warmińsko-Mazurskie 7.3 Olkusz - urban (Olkuski) 6.0
Albania 5.4 Zachodniopomorskie 7.3 Chełmek - urban (Oświęcimski) 5.2
2004
Monaco 22.4 Łódzkie 14.8 Książ Wielki - rural (Miechowski) 20.7
Italy 19.2 Świętokrzyskie 14.7 Racławice - rural (Miechowski) 20.0
Germany 18.0 Mazowieckie 14.5 Słaboszów - rural (Miechowski) 19.6
Macedonia 10.7 Warmińsko-Mazurskie 11.4 Dobczyce - urban (Myślenicki) 9.0
Moldova 10.3 Lubuskie 11.6 Muszyna - rural (Nowosądecki) 8.8
Albania 8.3 Pomorskie 11.7 Łabowa - rural (Nowosądecki) 8.8
2030
Andorra 29.3 Śląskie 26.1 Tarnów (urban) 27.9
Germany 27.5 Dolnośląskie 25.6 Kraków (urban) 26.3
Italy 27.2 Łódzkie 25.5 Chrzanowski (rural) 25.8
Ireland 18.4 Wielkopolskie 22.3 Myślenicki (rural) 18.8
Albania 17.3 Małopolskie 22.2 Limanowski (rural) 17.6
Moldova 14.9 Podkarpackie 22.0 Nowosądecki (rural) 17.3
tab. 1: the extreme values of the percentage of population aged 65 and over in Europe, Poland and Małopolskie voivodship.
Source: own elaboration based on data from Eurostat and Central Statistical Office in Poland
Fig. 3: the level and projections of the percentage of population aged 65 and over.
Source: own elaboration based on data from Eurostat and Central Statistical Office in Poland
The lowest figures among rural areas were registered in the southern part of the region. This part of the Małopolska region is traditionally characterised by high fertility. In Poland, the regions with the lowest proportion of 65+ population included northwestern regions of the country, while at a European level, the lowest proportion of 65+ populations can be seen in southeastern countries.
In 2004, the area in the Małopolskie Voivodship inhabited by high proportions of persons aged 65 and over increased and comprised central and northern areas, with the highest values in the northern gminas (above 20%), by far exceeding both the regional (13.2%) and the national averages (13.0%). Compared to the rest of Europe, the figures were nearly as high as those for Monaco and Italy. On the other hand, the lowest level in 2004 was registered mainly in the gminas located in the south. The lowest levels for Poland, though a class scale higher, were seen in the northwestern voivodships. Similar lower levels in Europe were seen in some Balkan countries.
What could be the situation like in 2030 in terms of the share of persons aged 65 and over in the population structure? Forecasts for poviats of the Małopolskie Voivodship (the average = 22.2%) suggest that the highest proportions of this age group should be seen
in the largest city poviats of the region and also in the northwestern poviats. Similar levels will also be recorded in most other regions (voivodships) of Poland and in many European countries. In all years under study, the proportion of the elderly varies from country to country, but the greatest contrast is probably between eastern and southeastern Europe (former socialist - transition countries) and western, northern and southern European countries.
4. Population according to the index of ageing
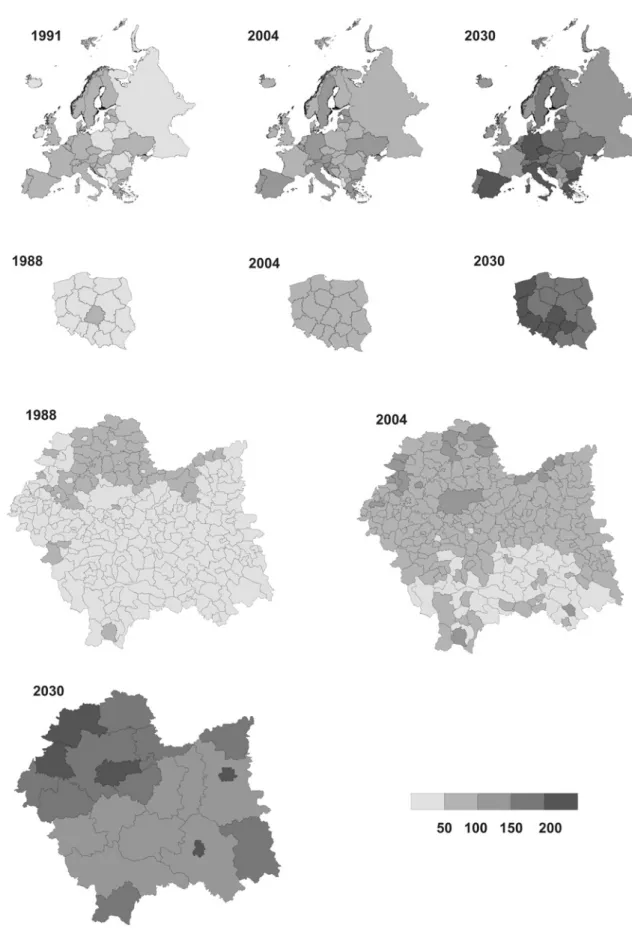
Another measure of assessing demographic age is offered by the index of ageing (ISD), also referred to as elderly dependency burden. The ratio of the oldest (65+) to the youngest (aged 0–14) persons in the Małopolskie Voivodship ranged from 18 to 93 per 100 persons in 1988 (Fig. 4). Apart from the towns of Wieliczka and Zakopane, relatively high values (with the average in the region amounting to 39%), were registered in the rural gminas located north and west of Kraków (Tab. 2). In Poland (with the national average of 38), the highest value was recorded in the area of Łódź, while in Europe it was in the northern, western and southern parts of the continent. On the other hand, the lowest figures within the Małopolskie Voivodship were registered in middle-sized towns and in gminas located in the south of the region. Values
EUROPE
(countries) POLAND
(voivodships) MAŁOPOLSKIE
(gminas and poviats)
1991 1988
Monaco 172 Łódzkie 54 Racławice - rural (Miechowski) 93
Sweden 99 Mazowieckie 48 Kozłów - rural (Miechowski) 86
Italy 93 Świętokrzyskie 46 Książ Wielki - rural (Michowski) 85
Bosnia and Herzegovina 31 Lubuskie 29 Limanowa - rural (Limanowski) 20
Moldova 31 Zachodniopomorskie 27 Łabowa - rural (Nowosądecki) 20
Albania 17 Warmińsko-Mazurskie 26 Chełmek - rural (Oświęcimski) 19
2004
Monaco 145 Łódzkie 97 Książ Wielki - rural (Miechowski) 131
Italy 136 Mazowieckie 90 Słaboszów - rural (Miechowski) 120
Greece 128 Świętokrzyskie 89 Krzeszowice - urban (Krakowski) 113
Macedonia 51 Wielkopolskie 67 Krynica - rural (Nowosądecki) 36
Moldova 50 Pomorskie 66 Słopnice - rural (Limanowski) 35
Albania 31 Warmińsko-Mazurskie 62 Łabowa - rural (Nowosądecki) 33
2030
Andorra 257 Śląskie 240 Kraków - urban 279
Italy 237 Dolnośląskie 235 Tarnów - urban 260
Slovenia 223 Łódzkie 228 Nowy Sącz - urban 213
Ireland 106 Pomorskie 175 Myślenicki - rural 124
Albania 89 Małopolskie 171 Nowosądecki - rural 105
Moldova 79 Podkarpackie 168 Limanowski - rural 104
tab. 2: the extreme values of the percentage of an ageing index in Europe, Poland and Małopolskie voivodship Source: own elaboration based on data from Eurostat and Central Statistical Office in Poland
Fig. 4: the level and projections of the ageing index
Source: own elaboration based on data from Eurostat and Central Statistical Office in Poland
of this order across Poland were registered in the northwestern part of the country, whereas in Europe, the lowest values, highly divergent from the national average, were registered only in Balkan countries.
In 2004, the values in the towns and gminas in most northern and central parts of the Małopolskie Voivodship ranged from 50–100. Higher values were mainly observed in units located in the northwestern part of the region, where the proportion of the elderly was higher than the share of children. The regional average (74) was similar as the national average (76), while the highest values across Europe were registered in Mediterranean countries. On the other hand, the lowest rates within the same timeframes were seen in the southern areas of the Małopolskie Voivodship, while such low figures elsewhere in Europe for 2004 were observed only in Albania.
The forecasts for the 2030 index are very similar to those concerning proportions of the population aged 65 and over. In the Małopolskie Voivodship, the highest figures of the old-age dependency ratio in 2030 could be observed in the largest cities of the region. Across Poland, similar values should be observed in the west and in some of central regions. Compared to Europe, the rates will correspond to those registered in “the most aged” Mediterranean countries and Germany. Against this background, the population of the Małopolskie Voivodship could be one of the youngest populations among Polish voivodships. A particularly low ratio in the Małopolskie Voivodship should be observed in the southern poviats, yet it will still be higher than the national average for Moldavia and Albania, and will be close to the level of Ireland and Luxembourg.
According to the index of ageing, differences between
EUROPE
(countries) POLAND
(voivodships) MAŁOPOLSKIE
(gminas and poviats)
1991–2004 1988–2004
Bosnia and Herzegovina 13.3 Opolskie 14.8 Gorlice - urban (Gorlicki) 20.5
Russia 11.3 Dolnośląskie 14.7 Olkusz - urban (Olkuski) 19.7
Romania 10.7 Zachodniopomorskie 14.5 Andrychów - urban (Wadowicki) 18.4
Monaco -2.4 Mazowieckie 10.7 Racławice - rural (Miechowski) 3.8
Norway -2.5 Łódzkie 10.0 Radziemice - rural (Proszowicki) 3.8
Denmark -2.6 Wielkopolskie 10.0 Kozłów - rural (Miechowski) 3.0
2004–2030
Andorra 19.5 Zachodniopomorskie 17.5 Nowy Sącz - urban 21.5
Liechtenstein 16.3 Śląskie 17.5 Tarnów - urban 21.5
Albania 15.9 Lubuskie 17.4 Chrzanowski - rural 17.7
Moldova 6.3 Lubelskie 14.1 Miechowski - rural 13.8
Luxembourg 6.1 Małopolskie 13.9 Proszowicki - rural 12.2
Monaco 4.6 Mazowieckie 13.2 Limanowski - rural 11.5
tab. 3: the extreme values of a dynamic ageing index in Europe, Poland and Małopolskie voivodship Source: own elaboration based on data from Eurostat and Central Statistical Office in Poland
eastern and western Europe are going to blur because of substantial and sharp decline in fertility in the former in 1990s which exceeded the low values in northern and western countries.
5. Ageing expressed in terms of the dynamic ageing index
The situation presented above will be determined by changes in the proportion of population aged 0–14 and 65+ in the society. The intensity of these changes is presented through a territorial analysis of population distribution according to the dynamic population ageing index (WSD), which, unlike the indexes discussed previously, is a dynamic measure, illustrating the speed of the process. Values calculated for Poland for the period 1988–2004 (Fig. 5) indicate that the Małopolskie Voivodship saw a steady acceleration of the population ageing process (on average 12.3). The fastest ageing areas within the Małopolskie Voivodship comprised mainly towns with values ranging between 16 and 20 (Tab. 3). None of the concerned European countries reached the same level, with the highest rates registered only in Bosnia and Herzegovina and in Russia. It has to be stressed here that in 1988–2004, there was not a single territorial unit that would show a rejuvenating age structure (the slowest ageing rate was seen in the northern, rural gminas). However, in some countries of the continent, a reverse trend was actually seen, i.e.
Scandinavian countries and in some mini-states.
According to the forecasts for the poviats of the Małopolskie Voivodship, the highest ageing rate in the years 2002–2030 is expected to be seen in urban poviats and in western poviats, which will be close to the figures for the regions (voivodships). At a European
level, the figures (for 2004–2030) will be comparable to countries considered relatively young at the turn of the century (mainly central-eastern and southeastern countries). Forecasts for the period before 2030 also suggest that the lowest ageing rate in the Małopolskie Voivodship could be seen in agricultural poviats (with the values between 13 and 14), while across the country, in the central and eastern voivodships. In Europe, the lowest pace before 2030 will be recorded in countries considered demographically oldest at the beginning of the 21st century. Thus, many of these countries are expected to reach the same or even higher shares of
the elderly in 2030 than expected in the western and northern countries of Europe.
6. Population according to the share of persons aged 85 and over
The situation presented above reflects, with certain exceptions, the territorial distribution of the population aged 85 and over (Fig. 6). Knowledge of the situation in this respect is very important, as it may serve as a foundation for planning social policy for this group of people, namely in the field of medicine and social care.
Fig. 5: the tendencies of ageing according to the dynamic ageing index WSD
Source: own elaboration based on data from Eurostat and Central Statistical Office in Poland
As mentioned before, due to the lack of comparable data, the analysis for Poland and Europe was based on data from different years, i.e. 2002 and 2004 respectively.
The forecasts used are for 2030 and 2025 respectively.
In 2002, gminas with high proportions of persons aged 85 and over were mostly concentrated in the north of the Małopolskie Voivodship (Tab. 4). The highest values in Poland, yet a class lower, were recorded in central and eastern voivodships. A clearly higher proportion of the oldest persons (85+) in Europe was observed in 2004 in countries with the relatively high life expectancy, unlike in East-Central Europe. The
lowest shares of population aged 85 and over in the Małopolskie Voivodship (with the average of 0.9%) in 2002 were seen in gminas belonging in the southern poviats. Across the whole country, similar values were recorded in the north and western voivodships, while in Europe in Balkan countries.
As shown by forecasts for 2030, high proportions of the population aged 85 and over in the Małopolskie Voivodship should be expected in poviats surrounding the largest cities of the Małopolskie voivodship, in the north-west and some in the south. According to estimates for the entire country, such high proportions Fig. 6: the level and projections of the percentage of population aged 85 and over
Source: own elaboration based on data from Eurostat, World Population Prospects 2006 and Central Statistical Office in Poland
should be seen in most of the voivodships. In Europe, particularly high shares are expected in southern, western and northern countries. The lowest share could be recorded in Małopolska in southern poviats (1.5–1.6%); in Poland – in northern and western voivodships. In Europe, remarkable differences should be still visible between its western and eastern parts.
EUROPE
(countries) POLAND
(voivodships) MAŁOPOLSKIE
(gminas and poviats)
2004 2002
Monaco 3.2 Podlaskie 1.1 Radziemice - rural (Proszowicki) 2.1
Sweden 2.4 Mazowieckie 1.1 Kozłów - rural (Miechowski) 2.1
Italy 2.0 Łódzkie 1.1 Racławice - rural (Miechowski) 1.9
Albania 0.5 Warmińsko-Mazurskie 0.6 Uście Gorlickie - rural (Gorlicki) 0.5
Moldova 0.4 Zachodniopomorskie 0.6 Łabowa - rural (Nowosądecki) 0.5
Macedonia 0.4 Lubuskie 0.6 Czorsztyn - rural (Nowotarski) 0.5
2025 2030
Italy 3.9 Śląskie 2.6 Tarnów - urban 3.1
Germany 3.9 Podlaskie 2.4 Kraków - urban 3.0
Greece 3.7 Mazowieckie 2.3 Nowy Sącz - urban 2.5
Macedonia 1.3 Lubuskie 1.9 Myślenick - rural 1.6
Moldova 0.9 Warmińsko-Mazurskie 1.8 Limanowski - rural 1.6
Albania 0.6 Wielkopolskie 1.8 Nowosądecki - rural 1.5
tab. 4: the extreme values of the percentage of population aged 85 and over in Europe, Poland and Małopolskie voivodship.
Source: own elaboration based on data from Eurostat and Central Statistical Office in Poland
7. Population according to the potential support index
The above trends give rise to questions concerning the economic and social situation of elderly persons in the future. A preliminary answer may be obtained through the application of the following measures – potential
EUROPE
(countries) POLAND
(voivodships) MAŁOPOLSKIE
(gminas and poviats)
1991 1988
Albania 11.4 Zachodniopomorskie 9.1 Chełmek - urban (Oświęcimski) 12.7
Bosnia and Herzegovina 9.6 Warmińsko-Mazurskie 8.7 Skawina - urban (Krakowski) 11.0
Macedonia 8.4 Lubuskie 8.0 Olkusz- urban (Olkuski) 10.7
Norway 4.0 Lubelskie 5.5 Słaboszów - rural (Miechowski) 3.1
Sweden 3.6 Świętokrzyskie 5.4 Gręboszów - rural (Dąbrowski) 3.1
Monaco 2.9 Łódzkie 5.3 Racławice - rural (Miechowski) 2.9
2004
Albania 7.9 Warmińsko-Mazurskie 6.2 Dobczyce - urban (Myślenicki) 7.9
Moldova 6.7 Lubuskie 6.2 Muszyna - urban (Nowosądecki) 7.7
Macedonia 6.5 Pomorskie 6.0 Alwernia - urban (Chrzanowski) 7.6
Greece 3.6 Lubelskie 4.8 Wietrzychowice - rural (Tarnowski) 3.2
Italy 3.5 Łódzkie 4.7 Książ Wielki - rural (Miechowski) 3.1
Monaco 2.8 Świętokrzyskie 4.7 Racławice - rural (Miechowski) 3.1
2030
Moldova 4.4 Wielkopolskie 2.9 Nowosądecki - rural 3.4
Albania 3.7 Podkarpackie 2.9 Limanowski - rural 3.3
Macedonia 3.5 Małopolskie 2.9 Myślenicki - rural 3.1
Monaco 2.2 Dolnośląskie 2.5 Chrzanowski - rural 2.1
Germany 2.2 Opolskie 2.5 Kraków - urban 2.1
Andorra 2.0 Śląskie 2.4 Tarnów - urban 2.0
tab. 5: the extreme values of the potential suport ratio in Europe, Poland and Małopolskie voivodship Source: own elaboration based on data from Eurostat and Central Statistical Office in Poland
Fig. 7: the level and projections of the potential support ratio (WPW)
Source: own elaboration based on data from Eurostat and Central Statistical Office in Poland
EUROPE (countries) POLAND (voivodships) MAŁOPOLSKIE gminas and poviats)
2004 2002
Monaco 15.4 Podlaskie 7.4 Radziemice - rural (Proszowicki) 13.7
Sweden 12.2 Mazowieckie 6.5 Mędrzechów - rural (Dąbrowski) 13.4
Norway 11.4 Świętokrzyskie 6.5 Racławice - rural (Miechowski) 11.9
Slovakia 4.0 Lubuskie 4.0 Andrychów - urban (Wadowicki) 3.2
Moldova 3.0 Dolnośląskie 4.0 Jordanów - urban (Suski) 3.2
Macedonia 2.3 Zachodniopomorskie 3.6 Skawina - urban (Krakowski) 3.1
2030
Germany 21.6 Podlaskie 11.8 Tarnów - urban 14.0
Switzerland 21.2 Śląskie 11.7 Kraków - urban 12.6
Sweden 20.4 Lubelskie 10.8 Nowy Sącz - urban 11.5
Macedonia 6.9 Warmińsko-Mazurskie 9.1 Myślenicki - rural 7.9
Belarus 6.7 Lubuskie 9.0 Myślenicki - rural 7.8
Russia 6.2 Wielkopolskie 8.4 Nowosądecki - rural 7.8
tab. 6: the extreme values of the parent support ratio in Europe, Poland and Małopolskie voivodship
Source: own elaboration based on data from Eurostat, World Population Prospects 2006 and Central Statistical Office in Poland
support index and parent support ratio. The former shows the number of persons aged 15–64 per one person aged 65 and over. In theory, the values of this ratio can help assess the potential of the professionally active population expected to work for the benefit of retired persons. The situation in Poland and in some East-Central Europe countries is still relatively more favourable in this respect than in West European countries.
In the Małopolskie Voivodship in 1988 (Fig. 7), the most favourable situation occurred in southern and western towns and gminas as well as in suburban zones of the largest cities. The highest values of the region (with regional and national averages of 6.4 and 6.9 respectively) were recorded in towns (Tab. 5). Similar values for the same period were recorded exclusively in the northern and western Poland, while across Europe in Balkan countries.
The least favourable situation, i.e. the lowest proportion of persons considered to be at working age per a hypothetical retiree, occurred in the northern rural areas of the voivodship. Across the whole country, the lowest values were observed in central-eastern voivodships, while across Europe – in southern and northwestern countries. The situation changed significantly in 2004.
Although Małopolska, seen within a similar territorial structure, i.e. divided into towns and villages, saw similar disparities in the potential support ratio, with an average of 6.4. The highest ratios across the whole country (with a national average of 5.4) were observed in northwestern voivodships, while in Europe, in central-eastern and southeastern countries. The least favourable situation in the Małopolskie Voivodship
in 2004 was registered again in rural gminas of the Miechowski Poviat in the north; across the country the situation was still the worst in central and eastern voivodships; while in Europe – again in southern and northwestern countries.
The noticeable changeability in the indicator values in years 1988–2004, as well as the forecasts, indicates the worsening of economic intergenerational relations. It is estimated that the 2030 values of the potential support ratio for the Małopolskie Voivodship at a poviat level will not exceed four professionally active persons per one retiree. The most favourable situation is expected to occur in southern poviats. In Poland (with an average of 2.7%), the situation should be relatively positive in the Podkarpackie, Wielkopolskie and Małopolskie voivodships, which will correspond to the values for Moldavia, Albania, Macedonia and Ireland.
The least favourable situation in the Małopolskie Voivodship could occur in the big city poviats. Across the whole country, the lowest values should be observed mainly in the Upper Silesia, while in Europe the disparities between east and west will become less distinguished.
8. Population according to the parent support ratio (W
WM)
Another measure illustrating the situation of the elderly is the parent support ratio, which expresses the number of persons aged 85 and over per one person at the age of their children (50–64 years old), i.e. those who can provide direct support to their parents, in particular
through taking direct care of them. The data available for 2002 suggest that the situation in the Małopolskie Voivodship in this respect was quite complex in terms of the territorial distribution (Fig. 8).Although most of gminas showing the highest indicator values were those located in the north of the voivodship, also the other parts of the voivodships showed extreme values (with respect to a regional average of 5.7). At a national level, voivodships that recorded values above the average (5.2%) in this respect included central-eastern regions.
In Europe (2004), the highest values were registered in the part of the continent at a higher stage of economic development (Tab. 6). Lower indicator values were recorded in urban areas of the Małopolskie Voivodship, which corresponded to the result in the western part
of Poland. In Europe, a similar situation was seen in its eastern part.
According to the forecasts for 2030, the average indicator value for the Małopolskie Voivodship could rise to 10.2. This means that it will be higher in the major cities of the region. Compared to the rest of Poland, these values will correspond to values for the Podlaskie and Śląskie voivodships. Still they will be much lower as compared to the situation in Europe.
The highest values should be recorded in 2030 in most EU-15 countries.
The projection shows that lower values of this ratio in the Małopolskie Voivodship in 2030 could occur Fig. 8: the level and projections of the parent support ratio (WSD)
Source: own elaboration based on data from Eurostat, World Population Prospects 2006 and Central Statistical Office in Poland
in southern poviats, while in Europe – in eastern countries, due to the relatively lower life expectancy.
9. Conclusions
The above analysis allows us to draw some general conclusions. In the nearest future, the Małopolskie Voivodship, seen in the context of the rest of Poland and Europe, is and will be one of the demographically youngest areas, which results not only from the relatively low proportions of persons aged 65+ and 85+.
This does not mean that the level and rate of ageing in all parts of the region are relatively low. It must be remembered that, while in West European countries the population ageing has reached an advanced level and its pace is slowing down, the processes are only now gaining momentum in East European countries, including Poland. Thus, following the general national trend, the rural areas of the Małopolskie Voivodship, which traditionally have a large proportion of the elderly, will soon be joined by towns and cities of the region, which have been “protected” against old age by young immigrants.
How far and how dynamically the trends will proceed in Poland and in the Małopolskie Voivodship depends largely on the fertility rate among the echo generations of the post-war baby boomers. As recent studies showed, replacement migration is not a solution to offset population ageing (United Nations, 2000; K.
Saczuk, 2003; J. Bijak et al., 2005). In Poland, at a local level, however, policy-makers should develop measures aimed at balancing the shortage of labour force resulting from the selective emigration of young people. Nonetheless, in the long run, the policies should aim at increasing fertility, by creating a family supportive and friendly environment for individual decisions concerning childbearing.
In view of the second demographic transition concept it must be concluded that a major cause of the pace of population ageing are fertility trends. At an international level, the slow-down of ageing in Western and Northern Europe is largely attributable to relatively higher fertility rates, moderately below the replacement level. This childbearing pattern has been achieved by the introduction of new social and economic policies aimed at providing greater support to families with children. Furthermore, the delayed births have been recuperated as women have reached their late twenties and thirties. In addition, the increasing size of immigrant populations with higher fertility rates has also played an important role in the observed rise in the TFR in some northwestern countries.
In Southern Europe and in German-speaking countries, the low levels of TFR resulted from the
postponement of births with a notably smaller recuperation among women at the age of thirty or more. In Central and Eastern Europe, including Poland, the early childbearing pattern was until the beginning of the 1990s replaced by the late pattern with a profound reduction of birth rates. In Poland, the overall number of births dropped by 37% between 1989 and 2003; however, a slight increase was observed in recent years. As a result, the former Eastern block countries, although with the lowest level of ageing so far, have experienced a rapid increase in the ageing dynamics. The reason of such a pronounced shift in family formation has been explained by socio-economic crises connected with transition from central planned to free market economy, as well as by the diffusion of western norms, values and attitudes.
The former includes a difficult situation on the labour market and increased unemployment, a decline in social functions and child-related services provided by the state, the rapid increase of participation in tertiary level of education, high costs of housing, as well as the availability of a range of career opportunities, consumer attractions and leisure activities (Kotowska et al., 2008). The latter shows in the late formation of marriage union and its increasing instability, in the substantial increase of divorce rates and out-of- wedlock births, and in the increased use of modern contraception.
At national and local level, the spatial variation of population ageing measures was strongly connected with the birth rates and migration, both past and present.
Northern and western voivodships have been relatively younger so far because of post-war immigration of young people while the eastern rural regions have shown high levels of ageing due to high emigration to urban areas and abroad. The disparities in fertility rates apart from urban/rural division resulted also from the distribution of local ethnic groups, i.e. the Kashubians in the north and highlanders in the south of the Małopolskie voivodship recorded high fertility rates which contributed to low ageing levels. Underlying causes of the rapid ageing in urban areas in recent and projected years include a decline of migration rates and shifts in the dominant direction of population movements from rural-urban to urban-rural, especially to suburban zones.
General trends related to demographic ageing translate into a dramatic change in the situation related to economic security as the level of public pensions expenditures is increasing (Council of European Union, 2003; European Commission, 2006).
An urgent policy challenge in Europe is to reform the pay-as-you-go pension systems that should be replaced
References:
BIJAK J., KUPISZEWSKA D., KUPISZEWSKI M., SACZUK K. (2005): Impact of international migration on population dynamics and labour force resources in Europe.
CASELLI G., VALLIN J., (1990): Mortality and population ageing. In: European journal of population, Vol. 6, p. 1–25.
CEFMR Working Paper 1/2005, Warsaw, 78 pp.
CENTRAL STATISTICAL OFFICE, Warsaw, www.stat.gov.pl.
CLARKE, J. I. (1965): Population geography. Pergamon Press, Oxford, 164 pp.
COUNCIL OF THE EUROPEAN UNION (2003): Joint report by the Commission and the Council on adequate and sustainable pensions, 7165/03, Brussels.
DŁUGOSZ, Z. (1996): Zróżnicowanie struktury wieku na świecie a metody jej klasyfikacji, Przegląd Geograficzny, Vol. 68, No. 1–2, p. 151–165.
DŁUGOSZ, Z., KUREK, S. (2006): Demographic ageing of European Union countries. In: Komornicki, T., Czapiewski, K. [eds.]:
Regional periphery in Central and Eastern Europe, Europa XXI, 15, Polish Academy of Sciences, Stanisław Leszczycki Institute of Geography and Spatial Organization Centre for European Studies, Polish Geographical Society, Warszawa, p. 185–198.
EUROPEAN COMMISION (2006): Adequate and sustainable pensions, Synthesis Report, http://ec.europa.eu/employment_
social/spsi/docs/social_protection/2006/rapport_pensions_final_en.pdf.
EUROPEAN FOUNDATION FOR THE IMPROVEMENT OF LIVING AND WORKING CONDITIONS (2005): Employment in social care in Europe, http://www.eurofound.europa.eu/pubdocs/2005/125/en/1/ef05125en.pdf.
EUROSTAT, Population and Social Conditions, http://epp.eurostat.ec.europa.eu.
GOLINI, A. (1997): Demographic trends and ageing in Europe. Prospects, problems and policies, Genus, Vol. 53, No. 3–4, p. 33–
74.
GRUNDY, E. (1996): Population ageing in Europe. In: COLEMAN D., [ed.], Europe's population in the 1990s. New York, Oxford University Press, p. 267–296.
HRYNKIEWICZ, J. (2003): Polityka społeczna wobec procesu starzenia się ludności. In: Kowaleski J. T., Pietruszek M [eds.], Wybrane problemy współczesnej demografii, p. 83–118.
KINSELLA, K., PHILLIPS, D. R. (2005): Global aging: the challenge of success. Population bulletin, Vol. 60, No. 1, p. 3–40.
KOMORNICKI, T., CZAPIEWSKI, K. [eds.] (2005): Regional periphery in Central and Eastern Europe. Europa XXI, Vol. 15, Polish Academy of Sciences, Stanisław Leszczycki Institute of Geography and Spatial Organization Centre for European Studies, Polish Geographical Society, Warszawa, p. 185–198.
KOTOWSKA, I. (1999): Przemiany demograficzne w Polsce w latach 90. w świetle koncepcji drugiego przejścia demograficznego.
Monografie i Opracowania, Vol. 461, Szkoła Główna Handlowa w Warszawie.
KOTOWSKA, I. JÓŹWIAK, J., MATYSIAK A., BARANOWSKA A. (2008): Poland: Fertility decline as a response to profound societal and labour market changes? Demographic Research, Vol. 19, No. 22, p. 795–854, [on-line] http://www.demographic- research.org/Volumes/Vol19/22/.
KRZYSZKOWSKI, J. (2006): Usługi opiekuńcze dla ludzi starych w miejscu zamieszkania w Polsce I innych krajach UE. In:
Kowaleski J. T., Szukalski P. [eds.]: Starość i starzenie się jako doświadczenie jednostek i zbiorowości ludzkich, Łódź, p. 150–
155.
with solutions based on individual savings throughout the working life rather than on generation transfer.
Poland, which is working its way up, may have serious problems facing the challenges of retirement security, namely in view of the incoming retirement of baby boomers and the high emigration rates among young people. The situation is likely to affect the oldest citizens, i.e. those aged 85 and over, whose proportion will be rising due to the increasing life expectancy.
Despite the traditionally strong bonds between generations in Poland and the provision of care for the elderly by their children, we can increasingly witness a departure from the traditional family
behaviour, esp. towards the infirm and ill, for which Poland, unlike developed countries, is not suitably prepared either in terms of infrastructure or economy (European Foundation for the Improvement of Living and Working Conditions, 2005; Hrynkiewicz, 2003;
Krzyszkowski, 2006).
In view of the above, it can be seen that the inevitable process of population ageing involves a number of risks and challenges both for the national and local government, which have to face these problems and take suitable steps in due course.
Authors’ addresses:
Prof. dr. hab. Zbigniew DŁUGOSZ
Pedagogical University of Cracow, Institute of Geography, ul. Podchorążych 2, 30-084 Kraków, Poland
e-mail: [email protected] Dr. Sławomir KUREK
Pedagogical University of Cracow, Institute of Geography, ul. Podchorążych 2, 30-084 Kraków, Poland
e-mail: [email protected]
KUREK, S. (2003): The spatial distribution of population ageing in Poland in the years 1988-2001, Bulletin of Geography No. 2, UMK Toruń, p. 65–76.
KUREK S. (2004): The population ageing process against vital statistical changes in Polish towns, Bulletin of Geography No. 3, UMK Toruń, p. 83–96.
LESTHAEGHE, R., (1995): The second demographic transition - An interpretation. In: Mason, Karen O., Jensen, An-Magritt [eds.]: Gender and family change in industrial countries. Oxford, Clarendon Press: p. 17–62.
LESTHAEGHE, R., (2000): Europe’s demographic issues: fertility, household formation and replacement migration. In:
Working paper, United Nations expert group meeting on Policy responses to population ageing and population decline.
New York, 16–18 October 2000. New York: United Nations.
PRESTON, S. H., HIMES C., EGGERS M., (1989): Demographic conditions responsible for population ageing. Demography, Vol. 26, No. 4, p. 691–703.
ROSSET, E. (1959): Proces starzenia się ludności. Studium Demograficzne, PWN, Warszawa, p. 763.
ROWLAND, D. T. (2003): Demographic methods and concepts. Oxford University Press, New York, 546 pp.
SACZUK, K. (2003): Development and critique of the concept of replacement migration.
CEFMR Working Paper 4/2003, Warszaw, 25 pp.
SUNDBÄRG, G. (1899): Sur la répartition par âge et sur les taux de la mortalité, Bulletin de l'Institut International de Statistique, Vol.12, p. 89–94.
UNITED NATIONS (2000): Replacement migration: is it a solution to declining and ageing populations? United Nations Population Division, New York.
UNITED NATIONS (2006): World population prospects: The 2006 revision, population division. Department of Economic and Social Affairs, http://www.un.org/esa/population/publications/wpp2006/wpp2006.htm.
VAN DE KAA, D. J., (1987): Europe’s second demographic transition. In: Population Bulletin, Vol. 42, No. 1, p. 1–59.
VAN DE KAA, D. J., (1999): Europe and its population: the long view. In: van de Kaa, D. J., Leridon, H., Gesano, G., Okólski M. [eds.]: European populations: Unity in diversity. Dordrecht etc., Kluwer Academic Publishers, p. 1–194.
VAN DE KAA, D. J., (2003): The idea of a second demographic transition in industrialized countries. In: The Japanese Journal of Population, Vol. 1, No. 1, p. 1–34. http://www.ipss.go.jp/webj-ad/WebJournal.files/population/2003_4/Kaa.pdf.
BALANCING SOCIO-ECONOMIC DEMANDS AND ENVIRONMENTAL PRESSURES:
MISSION IMPOSSIBLE?
Katja VINTAR MALLY Abstract
the majority of European countries are quite successful in achieving a high level of human development in terms of longevity, education, and income. However, the consumption of natural resources and ecological services in Europe is disproportionately high and causes not only local and regional, but also global environmental problems. Consequently, the measurement of development achievements should include not only economic and social “benefits”, but also environmental “costs”. this article explores linkages between the socio-economic development, on the one hand, and its accompanying environmental pressures on the other hand. to this end, a new alternative measure of overall development is introduced – the development balance index. its calculation combines the human development index, quantifying socio-economic achievements, and the ecological footprint, evaluating the environmental pressures. the development balance index enables researchers to evaluate the level of the general balance of economic, social, and environmental development. Subsequently it strongly modifies our deep-rooted images of the overall development and general well-being in the world.
Shrnutí
Vyrovnávání socio-ekonomických požadavků a environmentálních tlaků: nemožný úkol?
Většina evropských zemí je v dosahování vysoké úrovně lidského rozvoje poměrně úspěšná, což potvrzují ukazatele jako jsou délka života, vzdělání nebo příjem. Nicméně evropská spotřeba přírodních zdrojů a ekologické služby jsou nepřiměřeně vysoké a způsobují nejen lokální a regionální, ale také globální problémy v životním prostředí. V důsledku toho by měření rozvojových úspěchů mělo kromě ekonomických a sociálních “zisků” zahrnovat také environmentální “náklady”. tento příspěvek proto zkoumá vazby mezi socio-ekonomickým rozvojem na straně jedné a s ním spojené environmentální tlaky na straně druhé. Za tímto účelem představuje autorka nový alternativní ukazatel k měření celkového rozvoje – index vyváženého rozvoje. Jeho výpočet kombinuje index lidského rozvoje, kvantifikované socioekonomické zisky a ekologickou stopu (ta hodnotí environmentální tlaky). Index vyváženého rozvoje nám umožňuje hodnotit úroveň obecné vyváženosti mezi ekonomickým, sociálním a environmentálním rozvojem. Dále pak výrazně modifikuje naši hluboce zakořeněnou představu o celkovém rozvoji a všeobecném blahobytu na světě.
Key words: sustainable development, methods, ecological footprint, human development, development balance index
1. Introduction
In the last decades, the growing evidence of environmental degradation and (un)natural disasters have contributed to the determination, that sustainable development has to become a new global, regional, and local development paradigm. Sustainable development as a phrase and paradigm was first discussed by the World Conservation Union in its World Conservation Strategy (1980). Although the document focused on environmental issues, it also recognized the interrelationship between the environment, social concerns and economic activities. However, only twenty years ago, due to the Brundtland Commission (i.e. World
Commission on Environment and Development) report Our common future (1987), the emphasis on the human side of sustainable development became equal to the emphasis on environmental and economic sustainability (Hardi and Barg, 1997). Over the years, its definition of sustainable development as “development that meets the needs of the present without compromising the ability of future generations to meet their own needs”
(Our common future, 1987) remained the most popular and widespread description, often being misused and criticized, though (see Greer-Wootten, 2004, for a brief review of critics). The Brundtland definition not only called for an environmentally sound economic development within the planets ecological limits but