KL-01
FROM GUM ELASTOMERS TO FILLED VULCAN- IZED RUBBER: RHEOLOGICAL MODELING OF THE NON-LINEAR BEHAVIOR
FABIO BACCHELLI, and SALVATORE COPPOLA ENI - POLIMERI EUROPA, Centro Ricerche Elastomeri via Baiona 107, 48100 Ravenna, Italy,
Processing of rubber compounds involves the application of rapid and large deformations in both shear and elongation.
This indicates that transient flow and a large degree of stretch- ing are actually prevalent. Nevertheless, the analysis of unit operations is usually performed on the basis of the rheological response to steady state, mild shear flow. Moreover, com- monly used constitutive equations for rubber elasticity do not point out the contribution of the raw elastomer in the vulcani- zate response.
Commercial rubbers possess more complex structures with respect to model polymers and the non-linear rheology of a compound is strongly affected by changes in the relaxa- tion time spectrum of its polymer matrix as a consequence of variations in molar mass distribution or branching patterns, together with filler loading and filler dispersion.
Up to now, there is a lack of a comprehensive theory, which can simultaneously describe the rheology of the raw elastomer, the response of filled rubber and its behavior in the final cured state. Then, the problem of describing and model- ing the nonlinear behavior of rubber at different processing stages should be approached by collecting various theoretical and experimental contributions.
The non-linear behavior of the polymer matrix can be described using micro-rheological models accounting for reptation together with the contribution of chain stretch and dissipative convective constraint release. The time-dependent response of the filled polymer with a particle loading above the percolation threshold can be approached by introducing terms describing the filler-polymer dynamics under flow.
Rheological modeling can be extended to the post-cure state to describe Mullins stress-softening-hysteresis and other as- pect of the vulcanizate with a very limited number of parame- ters.
A commercial high-cis-polybutadiene (cis-BR) was in- vestigated in the present work (Neocis BR40, Polimeri Eu- ropa), characterized by a 1,4-cis content of 97 %. The poly- mer, nearly linear, has an average molecular weight of 420 000 g mol−1 and a polydispersity index of 3.8. Carbon black compounds (N990, N330) were prepared in a Brabender Plasticorder with a filler volume fraction of 0.2. A Rheomet- ric Scientific ARES A11 was used to determine the dynamic properties of cis-BR and related cured and uncured com- pounds.
Elongational measurements on cured and uncured rubber were performed with a detachable commercial fixture for rotational rheometers, which incorporates dual wind-up drums
to ensure a truly uniform extensional deformation during uni- axial extension. A SER-HV-P01 (ref.7) platform was hosted by a Anton Parr Physica MCR 501. Uncured cylindrical specimens with an effective length of 12.7 mm were prepared by means of a Göttfert Rheograph 6000 capillary rheometer and relaxed for at least three days. Flat specimens were used for vulcanized rubber.
The linear viscoelastic behavior of a typical high-cis-BR is reported in Fig. 1. The crossover point was not observed in the investigated frequency range, accounting for the presence
KEY LECTURES
10-3 10-2 10-1 100 101 102
104 105
T=23°C
G', G'' [Pa]
ω aT [rad/s]
Fig. 1. Linear viscoelastic data of a nearly linear cis-BR at 23 °C
1 1 0 1 0 0
105 106 107 108 109
0 .32 s- 1 0.1 6 s- 1 0.08 s-1 0.04 s- 1
0 .02 s-1 L MS F
D E -IA A Q MS F
c is -B R , 2 3oC
η E
+ [Pa s]
t [s ]
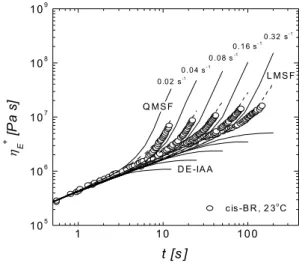
Fig. 2. Startup flow of a nearly linear cis-BR in uniaxial extension at 23 °C. Lines represent the linear (LMSF) and quadratic (QMSF) form of the Molecular Stress Function theory and the prediction of the Doi-Edwards theory under the assumption of independent alignment (DE-IAA)
of very long relaxation dynamics affecting many important processing parameters.
Data were used to access micro-rheological models for the prediction of the nonlinear response to different kinds of deformation. These models prove essential for understanding, for example, the important contribution of the strain harden- ing associated with the elongation of the polymer matrix in a compound. The extensional behavior of cis-BR at room temperature is reported in Fig. 2 for different Hencky strain rates.
Data are compared with the model known as Molecular Stress Function, accounting for reptation together with the contribution of chain stretch. An extended version of this generalized tube model with strain-dependent tube diameter was considered, to include the CCR contribution3,5. The pre-
diction of the Doi-Edwards theory based on pure orientational contribution is also reported4.
Industrial filled polymer compounds represent highly concentrated suspensions with complex interactions between filler particles and the polymer. Unlike the concentrated sus- pensions with low viscosity matrices the rheological behavior of rubber compounds can be described in terms of a single medium approach, though with complicated properties, be- cause the high viscosities of the polymer matrices make the typical two-phase effects, such as internal rotations of the particles, presumably insignificant.
In comparison with the rheology of polymer melts and solutions, filled polymers display very long relaxation phe- nomena which reflect the processes of structurization (flocculation and aggregation) of particles in the medium.
10-3 10-2 10-1 100 101 102 103
104 105 106 107
cis-BR / N330
cis-BR / N990
cis-BR
T=23°C
G' (Pa)
ω (rad/s)
Fig. 3. Elastic modulus of cis-BR and related carbon black com- pounds at 23 °C. Dashed lines represent the model prediction
0.1 1 10 100 1000
105 106 107 108
0.001 s-1 0.01 s-1
0.1 s-1 1 s-1
cis-BR T = 23°C
ηE
+ [Pa s]
t [s]
Fig. 4. Startup flow of cis-BR in uniaxial extension at 23 °C and Hencky strain rates of 1, 0.1, 0.01 and 0.001 s−1. Lines represent the prediction of the Leonov’s model
10-2 10-1 100 101 102 103
104 105 106 107
cis-BR / N990 T=23°C
G', G'' (Pa)
ω (rad/s)
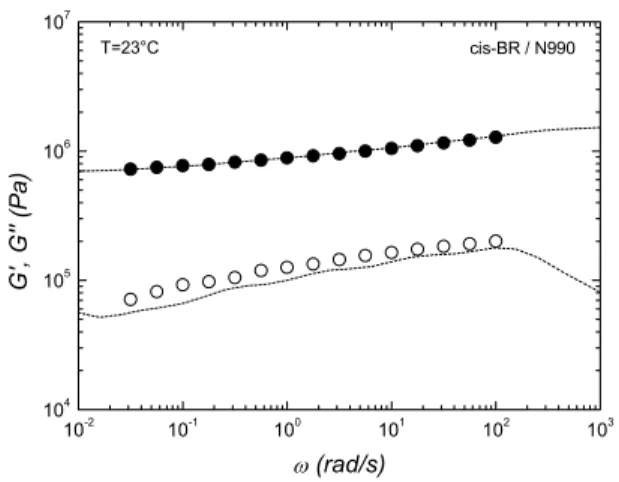
Fig. 5. Dynamic moduli of vulcanized carbon black filled cis-BR (N990) at 23 °C. Dashed lines represent the model prediction
10-1 100 101 102 103
105 106 107 108 109
.
0.001 s-1 0.01 s-1 0.1 s-1
1 s-1
cis-BR / N990 T = 23°C σE+ / ε [Pa s]
t [s]
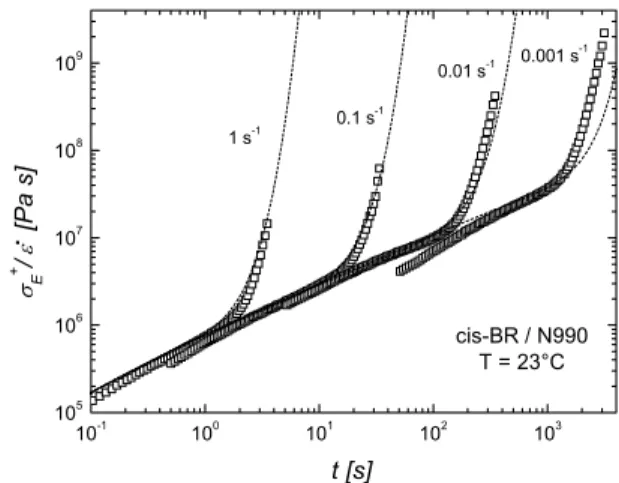
Fig. 6. Startup flow of carbon black filled cis-BR in uniaxial ex- tension at 23 °C and Hencky strain rates of 1, 0.1, 0.01 and 0.001 s−1. Lines represent the prediction of the Leonov’s model
Tube models are not suitable for describing the relaxa- tion dynamics of filled, uncured rubbers. Also the typical continuum mechanics approach commonly used for the mod- eling of polymer melts (K-BKZ, rubber-like liquid2) results largely unsatisfactory.
A set of thermodynamically consistent and stable consti- tutive/kinetic equations was proposed by Leonov and cowork- ers1,6 to describe manifestations of particle-matrix interactions and polymer viscoelasticity.
Though not being a first-principles theoretical approach, the Leonov’s model proves valid in describing almost the whole phenomenology of polymer nonlinear viscoelastic be- havior. The model is based on two tensorial differential equa- tions accounting for the stress carried by the free and trapped chains, respectively. A scalar kinetic equation is also neces- sary to describe the process of bonding/debonding of the polymer chains on the filler particles. Besides a discrete spec- trum of relaxation times for the linear Viscoelastic behavior, the model just needs the determination of 4 parameters, two of them for describing the nonlinear viscoelasticity and two structural/kinetic parameters for the filler-matrix interaction.
Fig. 3 shows the dynamic elastic modulus for cis-BR and related uncured carbon black compounds. As expected, a significant effect of the different filler surface area (N330>N990) is observed in terms of linear Viscoelastic re- sponse for these compounds with the same filler loading. The linear Viscoelastic spectrum is extracted for each material from dynamic moduli. With an appropriate choice of the pa- rameters for the nonlinear viscoelasticity, the strain hardening behavior in uniaxial extensional flow start-up is very well described for the pure polymer (Fig. 4). A similar procedure has been applied to the uncured compounds and to the vulcan- ized rubber (Fig. 5).
The Leonov’s model predictions for filled uncured com- pounds were successfully compared with experimental data in in Fig. 6.
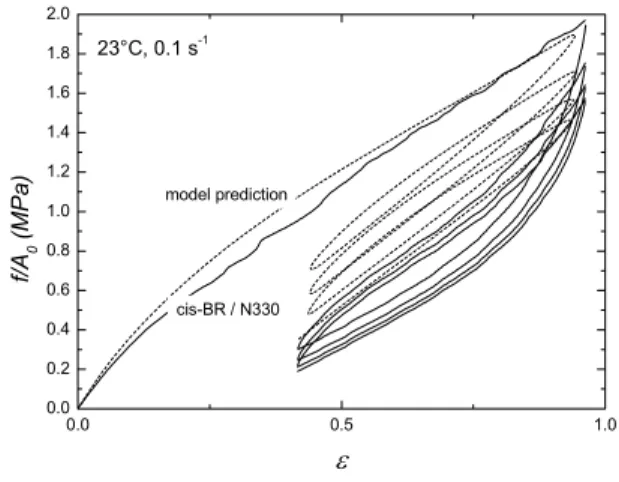
The application of the Leonov’s model to the vulcanized compound is reported in Fig. 7, 8 in terms of Mullins stress-
softening-hysteresis measured at constant Hencky strain rate.
The model is able to predict the thixotropy effects of cyclic extensional deformations and results are in satisfactory agree- ment with model predictions. Interestingly, the Mullins effect predicted by the Leonov’s model is reduced with respect to the experimental data. This suggests that filler-filler interac- tions, not modeled by Leonov’s approach, cannot be fully neglected for these cis-BR/CB compounds.
The approach presented in this paper could be extended for capturing a wide range of rheological behavior of filled elastomers in a wide range of stresses and strain rates, for the description of various unit operation in rubber processing.
REFERENCES
1. Joshi G. P., Leonov A. I.: Rheol. Acta 40, 350 (2001).
2. Larson R. G., in: Constitutive Equations for Polymer Melts and Solutions. Butterworth, Boston 1988.
3. Wagner M. H., Rubio P., Bastian H.: J. Rheol. 45, 1387 (2001).
4. Doi M. Edwards S., in: The Theory of Polymer Dynam- ics, Oxford Science Publications, 1986.
5. Ianniruberto G., Marrucci G.: J. Non-Newtonian Fluid Mech. 65, 241 (1996).
6. Leonov A. I.: J. Rheol. 34, 1039 (1990).
7. Sentmanat M. L.: Rheol. Acta 43, 657 (2004).
0.0 0.5 1.0
0.0 0.2 0.4 0.6 0.8 1.0 1.2 1.4 1.6 1.8 2.0
23°C, 0.1 s-1
model prediction
cis-BR / N330
f/A0 (MPa)
ε
Fig. 8. Mullins stress-softening-hysteresis of vulcanized carbon black filled cis-BR (N990) at 23 °C and |Hencky strain rate of 0.1 s−1. Dashed lines represent the Leonov’s model prediction
0.0 0.5 1.0
0.0 0.2 0.4 0.6 0.8 1.0
23°C, 0.1 s-1
cis-BR / N990 model prediction
f/A0 (MPa)
ε
Fig. 7. Mullins stress-softening-hysteresis of vulcanized carbon black filled cis-BR (N330) at 23 °C and |Hencky strain rate of 0.1 s−1. Dashed lines represent the Leonov’s model prediction
KL-02
AUTOMOTIVE APPLICATIONS OF THERMOPLASTIC ELASTOMERS JIŘÍ GEORGE DROBNY
Drobny Polymer Associates Merrimack, NH 03054 USA
Thermoplastic elastomers (TPEs) are rubbery materials with fabrication characteristics of conventional thermoplastics and many performance properties of thermoset (vulcanized) rubber. TPEs can be processed by the same methods such as injection molding, extrusion, blow molding, rotational mold- ing, thermoforming as most thermoplastic materials, includ- ing polyethylene, polypropylene, and polyvinyl chloride. On the other hand, their basic properties are very similar to those of vulcanized rubber materials based on natural rubber, SBR, EPDM, NBR, and polychloroprene. Thermoplastic elastomers offer a variety of practical advantages over vulcanized rubber, such as simple processing with fewer steps, shorter fabrica- tion times, and the possibility of recycling of production and post-consumer scrap. These and other advantages are the main reasons why the applications of TPEs in the automotive industry have been growing at a constantly increasing rate during the past two decades and currently automotive applica- tions represent the largest single market for these materials.
This contribution will discuss properties of the thermoplastic elastomers that are widely used in automobiles and their spe- cific applications as well as the most recent developments.
The author of this contribution is an international con- sultant and university educator. His book “Handbook of Ther- moplastic Elastomers” was published by Plastics Design Li- brary/William Andrew Publishing in 2007.
KL-03
RUBBER REINFORCEMENT BY CARBON NANOTUBES BETWEEN MYTH AND REALITY N. DURENT, M. OWCZAREK, and B. HAIDAR Institut de Chimie des Surfaces et Interfaces, ICSI-CNRS UPR 9069, Université de Haute Alsace, Mulhouse, France [email protected]
Carbon nanotubes have attracted much attention for their unique structure, as well as for their excellent mechanical, electrical and thermal properties. Most properties of carbon nanotubes are closely related with its anisotropic structure, their form factor and their nano-scale size are critical for un- derstanding their behavior in solutions as well as in polymer composites. However, in the case of polymer-based compos- ites, polymer/solid interactions, rubber adsorption, chain con- formation… are just a few of numerous factors affecting the development of the interphase which controls the overall mac- roscopic behavior of such materials. Polymer-carbon nano- tube, NTC's, blends are no exception of this frame but with an additional specific factor that has to be considered. In fact, when the scale of the solid surface approaches the scale of
a polymer chain, or its segment, the opportunity of an effi- cient adsorption ought to be different from those identified on quasi-infinite even surfaces. Only when the length of the chains is significantly smaller than the tub radius, the curved surface is approximately even on a local scale so that the con- cept for flat surfaces can be applied. However, such consid- erations should not apply for significantly curved nanotube surfaces.
Stable physisorption, at a given temperature, is known to be achieved thanks to a high number of weak physical adsorp- tion sites. Such mechanism is conceivable with even surfaces, or any surface considered as such. The establishment of stable polymer-nanotube links depends also on the number of inter- action sites between the two partners that depends, on its turn, essentially on the polymer chain conformation. The goal of this work is to tempt an experimental measurement of the adsorption enthalpy on NTC's of macromolecules with vari- able natures and sizes, MW's.
In the present work three series of a commercial PDMS with different and distributed molecular weights (MW in the 4000 to 420 000 g mol−1 range), a polybutadiene, PB, of dif- ferent molecular weights (in the 3,000 to 120,000 g mol−1 range) but of identical microstructure (1,2-PB content equal to about 80 %) and a polyethylene HDPE with different Melt Flow Index were selected. The chosen CNT's belong to the multi-walls carbon nanotubes family were purchased from Nanocyl (France). Rubbers adsorption measurements were performed from solution a flow micro calorimetric technique, FMC. Adsorption can be monitored by the determination of the amount of adsorbed polymer and the measurement of its heat (enthalpy) of adsorption.
Results show that for linear amorphous polymer adsorp- tion takes place exclusively in a relatively small window of MW's; adsorption, in this case, is permanent and associated with a substantial amount of heat. Outside this window, ad- sorption is reversible and heat exchange is low. High MW's molecules do not adsorb presumably because of their failure to wind around the nanotube and low MW's because of their incapacity to yield a sufficient number of adsorption contact- points to insure permanent adhesion and to overcome thermal agitation, kT. Only intermediate MW's are short enough to be unfolded over the surface without too much entropic penalty but with enthalpic gain which still high enough to link these intermediate chains permanently to the nanotube surface.
Semi-crystalline polymers adsorption on NTC's was found to depend on the same molecular forces, the adsorption stability in this case, however, is achieved by adsorption nucleating crystal growth and the formation of the so-called nano hybrid
“shish-kebab”.
Results are discussed in term of entropic penalty, enthal- pic gain, polymer to tube scale-matching and radius of curva- ture of the NTC's surfaces.
KL-04
POWDER INJECTION MOULDING FOR AUTOMOTI- VE APPLICATIONS - AN ALTERNATIVE TO TRADI- TIONAL PROCESSING ROUTES
BERENIKA HAUSNEROVÁ
Polymer Centre, Faculty of Technology, Tomas Bata Univer- sity in Zlin, TGM 275, 762 72 Zlin, Czech Republic [email protected]
The possibility to use a forming method for plastics − injection moulding − to produce metallic and ceramic parts is still not widely spread information within polymer processing society.
Powder Injection Moulding (PIM) technology is a state of art process allowing the large-number production of rela- tively small parts of complex shapes with reduced cost and increased efficiency by avoiding the use of extra processes comparing to traditional metallurgical processes as machining or investment casting.
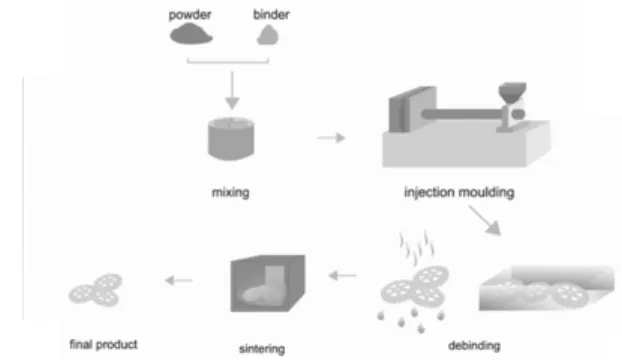
During the process (Fig. 1), powder is mixed with suit- able polymers (called binder) into a homogeneous compound.
In the next step, compound in the form of granules is formed in conventional injection moulding machines for thermoplas- tics into the final shape. This stage is followed by debinding, where the binder is extracted from the green part. Finally, compact is sintered so as to obtain the final part, which is purely metallic (Metal Injection Moulded − MIM) or ceramic (Ceramic Injection Moulded − CIM).
PIM process concerns several steps, and therefore the number of process variables is very high and their interactions are only partially understood. In this presentation, the impor- tant factors of the particular steps to the successful PIM proc- essing will be briefly discussed.
Step 1: Mixing. During mixing the powder selected for the particular application is mixed together with a suitable polymer binder. Binder has usually a multicomponent charac- ter for the two reasons: good adhesion to powder at reason- able price during moulding, and different decomposition tem- peratures or chemical stability of its components during de- binding.
Thermoplastics based binders predominate, but usage of thermosets, water based and gellation systems have been also
reported1; for examples see Fig. 2. The major part of a thermoplastic binder is typically low molecular weight poly- mer − a wax. However, due to its low viscosity, the shear forces necessary to disperse the particles and break up ag- glomerates may not be sufficient.
Additionally, as a consequence of the non-polar charac- ter, wax (when used alone) tends to migrate from the feed- stock during moulding due to its poor adhesion to powder as we have demonstrated for cemented carbides compounds2.
The other binder components, containing higher- molecular-weight polymers and additives, should provide suitable interactions with powder, and thus prevent the sepa- ration from powder during the flow. Block copolymers are often used for this purpose since they can be made of polymer blocks soluble in the dispersion medium and blocks with high affinity to powder imparting steric stabilisation of a com- pound. When we compared three types of polymer binders differing in the block copolymer used3 (ethylene-butyl acry- late, ethylene-vinyl acetate, ethylene-acrylic acid) the influ- ence of the flow properties of the particular binder composi- tion diminished as the volume concentration of a solid com- ponent increased to 30 vol. %.
Mixing is carried out under high shear forces in order to break up agglomerates and disperse polymer binder effi- ciently on the powder surface as demonstrated in Fig. 3.
The crucial point during mixing is an adjustment of opti- mal loading (powder-binder ratio). Optimal loading refers4 to powder concentration for which compound exhibits good flow properties (viscosity less than 103 Pa s) as well as homoge- neity and stability in the shear rate range from 102 to 105 s−1. It occurs slightly below a maximum (critical) packing fraction
EVA wax LDPE stearate wax epoxy resin
Fig. 2. Examples of polymer binder compositions
Fig. 3. SEM of pure carbide powder and carbide powder-based PIM compound
Fig. 1. PIM processing steps
attainable for a given system; according to Dihoru et al.4 it should be set 6−14 % lower than the maximum value.
In order to obtain maximum packing fraction for the particular powder/binder system, relative viscosity (ratio of the mixture viscosity to the viscosity of pure polymer) as a function of volume fraction of solids is often employed.
The method is based on the assumption that powder particles stay mobile only to some filling degree (a cluster model). As the particles loading reaches the maximum a melt is confined among powder particles and the motion of the compound is made impossible, which results in a sharp increase of viscos- ity beyond all limits due to the friction between small hard powder particles5.
The value of the maximum packing fraction depends strongly not only on the materials properties, but also on the packing conditions. Nielsen6 proposed that the value of maxi- mum packing ranges from 0.601 to 0.637 for random packed spheres, Chong et al.7 used the value 0.605 for monodispersed glass beads in PIB matrix, e.t.c.
More than hundred empirical and theoretical relations have been proposed in order to obtain the value of maximum packing fraction from the viscosity data. Often a simple em- pirical Maron-Pierce relation8 is employed to calculate maxi- mum loading level for PIM compounds. In cases, where the Maron-Pierce model departs from experimental data, as shown e.g. by Jorge et al.9 for the description of alumina powder and PEG/PE wax binder, its modification proposed by German and Bose1 offers the good accordance with experi- mental data, predicting the maximum loading degree value with high accuracy.
Recently, we tested10 a set of most often recommended relations in the PIM literature and found that the values pre- dicted with the models were rather overestimated or underes- timated, when compared to the experimental data. Further, the predicted values of the maximum volume fraction of the same powder varied with the model used (Table I) even though the maximum loading levels of PIM compounds, established using these models, followed well the powder characteristics:
the highest value of maximum loading belonged to the pow-
der with the broadest distribution of particle sizes, while the lowest value was attained for powder with high portion of small particles.
Another rheological method to obtain critical powder volume concentrations has been proposed by Barreiros and Vieira11, which employed torque rheometry to set optimal compositions of feedstocks based on powders having non- conventional characteristics for PIM. The optimal particle loading was evaluated as the highest value resulting from the intersections of the adjustment of linear functions of the mix- ing torque as a function of powder loading plots. The product coming from the feedstock selected by this method showed high density and flexural strength.
Recently, Dihoru et al.4 demonstrated a possibility to determine optimal solid loading by the help of neutral net- work modeling. Consequently, they proposed an idea of com- bining neural networks with knowledge-based systems to optimize PIM process.
It should be mentioned that volume fraction of particles also slightly varies due to pressurization, because of a great discrepancy between bulk moduli of powder and binder5. Except of the pressure affected flow behaviour of PIM com- pounds reported by Hausnerova et al.12 for the system consist- ing carbide powder and three-component binder (polyethylene, polyethylene based copolymer, paraffin wax), the effect of pressure is still omitted in the rheological charac- terization of filled polymers.
Step 2: Injection Moulding. Moulding of PIM com- pounds does not essentially vary from the processing of pure polymer melts. Both the screws and the barrels should be made from a wear resistant material. The screws are equipped with a non-return valve13, which prevents feedstock’s pressing backwards into the barrel.
Temperature is the most important variable – too high temperature can lead into the binder separation from the melted compound, on the other hand insufficiently high tem- perature would cause freezing of the feedstock before the mould filling or creation of weld lines. Computer aided engi- neering (CAE) gives the predictions of pressure, velocity and temperature profiles throughout the flow region via commer- cially available PIMSolver (Cetatech, South Korea), which is a 2.5D FEM software package developed for the simulation of the injection moulding process14.
Nevertheless, a key to successful injection moulding lies in understanding of their rheological properties. A priori ap- plication of the fundamental theories on the suspensions in predicting the flow properties of PIM compounds should be taken with an extreme caution, because it brings a number of obstacles and limitations.
The rheology of such an extreme type of filled polymers has been documented in a far from sufficient manner. Major- ity of researchers concentrated on the effect of binder compo- sition on rheological properties of feedstocks, but the role of the particular binder components and their interrelationship remain still unclear. One of the rare systematic investigations has been presented by Hsu and Lo15. They used McLean- Anderson statistic method16 to study fluidity (inverse of vis- cosity) and pseudoplasticity (in terms of power-law index) of 15 binder formulations and presented contour maps showing how these two rheological variables vary with binder compo- nents at a constant value of the fourth.
Model Maximum volume fraction of powder, φm
UNI 1 UNI 2 BI
Eilers 0.60 0.56 0.63
Chong 0.60 0.56 0.62
Fedors 0.68 0.60 0.70
Frankel-Acrivos 0.60 0.53 0.61
Quemada 0.64 0.58 0.66
Graham 0.58 0.53 0.59
Krieger - Dough- erty
0.66 0.57 0.59
Sengun - Prob- stein
0.71 0.70 0.61
Table I
Predicted values of maximum volume fraction of solids for three carbide powders (UNI 1, UNI 2, BI) differing in their powder characteristics10
PIM compounds generally show high sensitivity to variations in shear rate. Newtonian plateau becomes reduced or even disappear in the measured range of shear rates. It has been widely accepted that the change into non-Newtonian flow arises from the disruption of agglomerates formed by particles17.
Depending on the type of the dispersed particles, espe- cially on their particle size, yield point may appear for highly concentrated compounds at low shear rate as an indication of particle network structure within the melt, which is relatively stable at lower shear rates, e.g.18. At higher shear rates, how- ever, this structure is broken, and the viscosity is dominated by hydrodynamic interactions19 resulting in shear thinning as particles and polymer orientate and order in the flow direction to allow interparticle motion.
At still higher powder loading, with further rise of shear rate, volume increases because particles cannot form layers and slide over each other20. Then, depending on the binder wetting characteristics, shear thinning may turn into dilatant flow, as shown in Fig. 4.
There is still considerable uncertainty about the source of such behaviour. An increase in viscosity with shear rate may be indicative of particle disordering20 or dilation.
The mechanism proposed by Barnes21 is that with in- creasing shear stress (rate) the layers formed in the pseudo- plastic flow region becomes disrupted, and at a certain (critical) shear stress or rate are fully eliminated and the flow turns into dilatant. It implies that each highly concentrated suspension exhibits dilatant flow at the proper flow conditions depending on filler concentration, particle size distribution, and also viscosity of a polymer component.
Finally, highly concentrated compounds (about 50 vol.%
solids and higher) may exhibit a radical change on their flow curves accompanied by distortions of the extrudate surface called melt flow instabilities. Hausnerova and coworkers2,22 recorded flow instabilities of a “pressure oscillations” type for carbide compounds and showed that temperature is the key factor limiting their onset almost independently of the filler concentration. At higher temperatures the formation and ref- ormation of particles mat at the capillary entrance is enhanced by lower binder viscosity, which supports the mechanism of filtration effect, as a possible explanation.
Phenomenon considered as typical to occur during flow of highly concentrated suspensions is wall slip. Mooney method is a common approach to detect presence of wall slip during rheological measurements. The later approach to evaluate wall slip given by Hatzikiriakos and Dealy23 is based on the slip velocity dependence on the wall normal stress.
For cemented carbides in a three-component binder (PEG, PMMA, stearic acid) the existence of a crisscross slip has been reported by Chunkrerkkul et al24. It is phenomenon occurring typically for clays in water, where the flow occurs on sets of slip bands (mobile binder) formed on planes near to the planes of maximum shear tress. The slip bands are com- posed of aligned particles layers of a plate shape, which slip one past another, lubricated by water. The authors propose a “slip band model” resulting in equation similar to the em- pirical relations of Maron-Pierce8 or German and Bose1 bear- ing relative viscosity to the volume fraction of filler.
Step 3: Debinding. Debinding is the most time consum- ing stage, depending mainly on the compact thickness and binder composition. A typical wall thickness of a PIM parts ranges from 2 to 3 mm, generally down to 0.1 mm (ref.25).
The binder has to be extracted from the pores as a fluid without distorting or contaminating the compact. There are two general ways of debinding (Fig. 5) − thermal and solvent, which are often combined in order to accelerate the process1. The first one proceeds by degradation and evaporation or liquid extraction. Thermal debinding in gaseous form is run under low (diffusion) or high pressure (permeation). Liquid extraction is carried out at a temperature high enough for the binder to reach sufficiently low viscosity to flow out of the compact into the pores of the wick material. The other type of debinding, solvent debinding, involves immersing the com- pact in a fluid that selectively dissolves some components of the polymer binder, thereby leaving an open pore structure for subsequent debinding by evaporation5.
In general, thermal debinding should be carried out by sequential diffusion of the binder components, and therefore the binder should consist of at least two components with different diffusion temperatures.
In Fig. 6 thermogravimetric analysis of a paraffin wax is shown2. Debinding time increases with the chain length and paraffin wax has only between 18 and 32 carbon atoms; it has a narrow decomposition range (Fig. 6a). In contrast, binder containing components differing in molecular weights, melt- ing and decomposition temperatures facilitates a step-by-step debinding. As it is evident from the results shown in Fig. 6b, PEG and paraffin wax move (by diffusion and viscous flow) to the surface of the part before PE and EVA, creating pores which enable easier evaporation of the rest of the binder2.
Step 4: Sintering. The demands on PIM powders during moulding, debinding and sintering are contradictory. Small particles allow faster sintering, but on the other hand increase
101 102 103
Apparent shear rate, γa (1/s)
101 102 103
102 103 104
Apparent shear viscosity, ηa (Pa.s)
160 °C
. 101 102 103 104
150 °C 170 °C
Fig. 4. Flow curves of ceramic compound at various temperatures
DEBINDING
THERMAL THERMAL/SOLVENT SOLVENT
Liquid extraction Selective dissolving of binder components Degradation
&
Evaporation
Fig. 5. Schema of debinding techniques
sintering shrinkage, give slower debinding compared to larger particles, and are considerably more expensive. A broad parti- cle size distribution offers higher packing density, less sinter- ing shrinkage, but it causes slower debinding26. The disadvan- tages of spherical particles are slumping during debinding and lower compact strength5. In this view, new alloys with im- proved tailored properties should be developed to further advance the PIM applications as well as to help to attain prices competitive to ”conventional“ ones.
Concluding remarks. The automotive sector has be- come a major consumer of PIM parts in Europe. Metallic parts of high complexity are used in ignition locks, as gearbox components, in the steering, in engines, in sensors, car seats, turbochargers, convertible bonnet driving and locking mecha- nisms, etc.27 In Japan major automotive applications consist in steering systems components being produced in quantity of 400 000 parts/month28 (PIM technique is usually competitive to metallurgic processes starting with production of 50 000 parts/year). PIM components for applications at the extreme low temperatures with the potential use in the hydrogen stor- age tank of the BMW Hydrogen 7 are currently developed in Austria29.
At present demands on multiphase PIM materials are stringent. It is obvious that reliable simulations of the PIM process can only be performed when the material parameters are known with sufficient accuracy. Processing of PIM mate- rials is clearly an interdisciplinary challenge, combining met- allurgy with plastic processing and material science of poly- mer resins. However, the design methodology currently de- veloped in the PIM industry is based on the trial and error approach. The present state might be partly affected by the fact that majority of PIM realizations is patented, and the research groups involved do not will to publish their findings.
This work has been financially supported by the Grant Agency of the Czech Republic (project 103/08/1307) and Min- istry of Education, Youth and Sports of the Czech Republic (project no. MSM 7088352101). B.H. is the laureate of the national section “For Women in Science“, being financially supported by L´Oréal during the year 2007.
REFERENCES
1. German R. M., Bose A., in: Injection Molding of Metals and Ceramics. MPIF, Princeton 1997.
2. Hausnerová B., Sáha P., Kubát J.: Int. Polym. Proc. 14, 254 (1999).
3. Hausnerová B., Sáha P., Kubát J., Kitano T., Becker J.: J.
Polym. Eng. 20, 237 (2000).
4. Dihoru L. V., Smith L. N., German R. M.: Powder Metall. 43, 31 (2000).
5. German R. M., in: Powder Injection Moulding. MPIF, Princeton 1995.
6. Nielsen L. E., in: Polymer Rheology. Marcel Decker, New York 1977.
7. Chong J. S., Christiansen E. B., Baer A. D.: J. Appl.
Polym. Sci. 15, 2007 (1971).
8. Maron S. H., Pierce P. E.: J. Colloid Sci. 11, 80 (1956).
9. Jorge H. R., Correia A. M., Cunha A. M.: ANTEC 2005, 605.
10. Honek T., Hausnerová B., Sáha P.: Polym. Comp. 26, 29 (2005).
11. Barreiros F. M., Vieira M. T.: Ceram. Int. 32, 297 (2006).
12. Hausnerova B., Sedlacek T., Slezak R., Saha P.: Rheol.
Acta 45, 290 (2006).
13. Schlieper G.: Powder Injection Mould. Int. 2, 21 (2008).
14. Urval L., Lee S., Atre S. V., Park S.-J., German R. M.:
Powder Metall. 51, 133 (2008).
15. Hsu K. C., Lo G. M.: Powder Metall. 39, 286 (1996).
16. Murray J. S. Jr., in: X-Stat Statistical Experiment Design/
Data Analysis/Nonlinear Optimization. John Wiley, New York 1984.
17. Kurzbeck S., Kaschta J., Münstedt H.: Rheol. Acta 35, 446 (1996).
18. Hausnerová B., Honek T., Sáha P., Kitano T.: J. Polym.
Mat. 21, 1 (2004).
19. Husband D. M., Aksel N.: J. Rheol. 37, 215 (1993).
20. Hoffman R. L.: Trans. Soc. Rheol. 16, 155 (1972).
21. Barnes H. A.: J. Non-Newtonian Fluid Mech. 56, 221 (1995).
22. Honek T., Hausnerová B., Sáha P.: Appl. Rheol. 12, 72 (2002).
23. Hatzikiriakos G. S., Dealy J. M.: J. Rheol. 36, 703 (1992).
24. Chuankrerkkul N., Messer P. F., Davies H. A.: Powder Metall. 51, 72 (2008).
25. German R. M.: Powder Injection Mould. Int. 2, 18 (2008).
26. Dowson G., Williams B., in: Metal Injection Moulding.
EPMA, Shrewsbury 1995.
27. http://www.piminternational.com/aboutpim/application 28. Williams N.: Powder Injection Mould. Int. 2, 37 (2008).
29. Williams N.: Powder Injection Mould. Int. 1, 5 (2007).
-10 -5 0
0 100 200 300 400 500 600 Temperature (oC)
Weight decrease (%)
-14 -7 0
0 200 400 600
Temperature (oC)
Weight decrease (%)
-5
-10 -10 -5 0
0 100 200 300 400 500 600 Temperature (oC)
Weight decrease (%)
-14 -7 0
0 200 400 600
Temperature (oC)
Weight decrease (%)
-5
-10
Fig. 6. Thermo-gravimetric analysis of binders containing; (a) paraffin and (b) paraffin, PE, PEG 6000, and EVA copolymer2
KL-05
PLASTICIZATION IN COMPLEX, PHASE-SEPARATED POLYMERS
E. BRUCE ORLERa, REX. P. HJELMb*, JOSEPH T. MANGc, DEBRA A. WROBLESKIa, DAVID A. LANGLOISa, and MARILYN E. HAWLEYa
a Materials Science and Technology Division, Los Alamos National Laboratory; b* Los Alamos Neutron Science Center, Los Alamos National Laboratory, H-805, Los Alamos New Mexico 87455, USA, c Dynamic Experimentation Division, Los Alamos National Laboratory
Plasticizers reduce the bulk modulus and Tm of polymer materials; thus, they are of commercial importance as proces- sing aids. A nitroplasticizer (NP) is used to soften a polyu- rethane binder, Estane, to lower the temperature at which Estane bound composites can be molded. The effect of NP on Estane mechanical properties is significant. Young’s modulus, for example, for Estane is 5 MPa (ref.1), whereas the value for plasticized Estane is 0.7 MPa (ref.2).We aim to determine the poorly understood nanoscale mechanisms that lead to the softening of a thermoplastic, such as Estane.
Segmented polyurethanes, such as Estane, consist of cry- stalline aromatic, hard segments, randomly covalently linked with soft, rubbery segments. Previously we showed in, Es- tane, which has a low, 23 % by weight, hard segment content, that the hard segments partially phase segre-gate into small, discrete domains embedded in a matrix rich in rubbery seg- ments. We postulated that the discrete domains act as rein- forcing fillers3.
We used small-angle neutron scattering (SANS) data and the difference in scattering between NP mixtures containing different fractions of NP and deuterated NP (d-NP), fD, to determine the distribution of NP in Estane and its effect on the nano-scale structure. The method was the same used to extract the composition and structure of neat Estane by swell- ing with mixtures of protonated and deuterated solvents3.
SANS data was analyzed assuming that the discrete do- main structure is described by a micelle model3, in which the dis-crete domains have a uniform core, surrounded by a co- rona of tethered polymer intermixed with the matrix.
Whereas the core consists mainly of hard segment, it contains a significant component of soft seg-ment. Conversely, the matrix consists mostly of soft segment, but also contains a significant amount of hard seg-ment. The corona is chemi- cally identical to the matrix, but is distnquished by taking up less solvent when Estane is swollen with different solvents.3
With increasing content of NP from 10 to 50 % by weight the Tg associated with soft segments decreased from ca
−35 C to −50 C. The endotherm associated with Tm of the discrete do-mains decreased slightly from ca 60 C and its integrated area decreased by roughly a factor of 2. Young’s modulus decreased by an amount that was far greater than predicted by dilution effects of the matrix. When d-NP is used, a peak in the Estane SANS data was seen to decrease in intensity with the amount of d-NP present up to about 20 % by weight, then increase. These results indicated that the NP interacts with the matrix and has an effect on the discrete
domains.
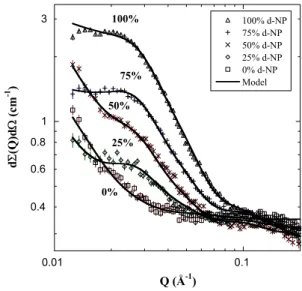
In Estane formulated with 50 wt.% NP a SANS peak ap- pears and its intensity becomes larger with increasing fD
(Fig. 1). The peak is positioned at lower Q than in Estane3, consistent with a greater concentration of NP in the matrix and increased spacing between the domains in plasticized Estane.
Analysis of the data by the micelle model, (Fig. 1), showed that the bulk of the NP was taken up by the matrix and that there was a significant plasticizer in the core. How- ever, there was no change in either the core radius, 2.95±0.01 nm or in soft segment content, 0.37±0.01, in plasticized Es- tane compared to Estane3. There was less hard segment con- tent in the core, 0.34±0.01, relative to neat Estane, 0.7±0.1 (ref.3). The corona included less NP than the matrix, suggest- ing that the core in plasticized Estane affects the mi- cromechanics of the surrounding volume in the same way as observed in Estane3.
We gain insight on the effect of NP in Estane by compa- ring the discrete domain density corrected for the volume change due to NP, 5.1 ± 0.3⋅1016cm−3, with that for neat Es- tane, 1.0 ± 0.1⋅1017 cm−3 (ref.3). Thus, the effect of NP on Estane is consistent with the hypothesis that the mechanism of softening by NP is by inhibiting the forma-tion of the filler- like discrete domains.
This work benefited from the use of LQD at the Manuel Lujan, Jr. Neutron Scattering Center of the Los Alamos National Laboratory and was supported by the US. Department of Energy.
REFERENCES
1. Banergee B., Cady C. M., Adams D. O.: Modeling Simul. Mater. Sci. Eng. 11, 457 (2003).
2. Cady C. M., Blumenthal W. R., Gray G. T. III, Idar D. J.:
Polym. Sci. Eng. 46, 812 (2006).
3. Mang J. T., Hjelm R. P., Orler E. B., Wrobleski D. A.:
Macromolecules 41, 4358 (2008).
0.4 0.6 0.8 1 3
0.01 0.1
100% d-NP 75% d-NP 50% d-NP 25% d-NP 0% d-NP Model
dΣ(Q)dΩ (cm-1 )
Q (Å-1) 100%
75%
50%
0%
25%
Fig. 1. Contrast-dependent SANS
KL-06
POLYCAPROLACTONE – WOOD PARTICLES BIODEGRADABLE COMPOSITES MODIFIED BY THERMAL DECOMPOSITION OF ORGANIC PEROXIDE
IVAN CHODÁK*, ZUZANA NÓGELLOVÁ, and IVICA JANIGOVÁ
Polymer Institute, Slovak Academy of Sciences, Dúbravská cesta 9, 842 36 Bratislava, Slovakia
Biodegradable plastics attract an increased interest as environmentally friendly materials. The high volume applica- tions can be also considered for automotive especially for interior parts. Besides natural look and light weight, simple waste management is also important in this case since recy- cling of cars is of rising consent recently. However, a broad application is partially hindered by unsuitable properties and by the high price of biodegradable plastics, compared to con- ventional materials, especially polyolefins. Rather inexpen- sive way consists in a preparation of two – phase materials via either blending with another polymer or preparation of com- posites by addition of a filler1. Both routes usually require certain level of adjustment of interactions on the phase boundaries by an addition of compatibilizers as a separate component of the mixture2 or by chemical modification of either matrix or filler surface3. Certainly, when dealing with environmentally degradable plastics, any modification can be only considered if the resulting material is also environmen- tally degradable. From this point of view, the mixing with various types of cellulose – based particles is an obvious op- tion. In this case, besides modification of certain properties, a decrease of the price of the material can be expected as well.
In this paper, biodegradable matrix filled with organic filler has been discussed. Polycaprolactone (PCL) was used as the biodegradable matrix. The disadvantages connected with this polymer can be summarized as low melting temperature resulting in a low deflection temperature, relatively low ten- sile strength and modulus, and rather high price compared to high volume common plastics, e.g. polyolefins. On the other hand, high toughness and elongation at break, biodegradabil- ity and resistance towards thermal degradation as well as good processability can be mentioned as advantages of PCL.
If organic fillers such as sawdust or switchgrass are used as a composite component, usually a compatibilizer has to be used to improve the interaction between hydrophobic polymer matrix and hydrophilic surface of the filler. Various compati- bilizers have been used, the most common being the parent matrix polymer functionalized by maleic anhydride4. In the past we investigated the crosslinking initiated by thermal decomposition of an organic peroxide to achieve a compatibilizing effect in a composite based on low density polyethylene as a model matrix and various organic fillers such as birch wood particles5, aspen fibers, recycled paper, rubber crumb etc.6. A formation of covalent bonds leading to grafting of the polyethylene chains onto filler surface was proposed based on SEM observation7; this model is in accor- dance with mechanical properties, especially with an unex- pected large increase in Young’s modulus for crosslinked
composites in spite of a decrease in the crystallinity of the matrix due to crosslinking8.
The effect similar to crosslinking regarding mechani- cal properties was observed also if 10 to 30 wt.% of function- alized polyethylene was added to LDPE / wood flour compos- ite. In this case a copolymer polyethylene – co – acrylic acid was found as an efficient modifier9.
In this paper, a formation and properties of biodegrad- able composites with polycaprolactone matrix were investi- gated. A mixture of polycaprolactone (CAPA 6800, Solvay) with switchgrass (supplied by Univ. Québec Trois-Rivières) was chosen as an example of biodegradable filler in biode- gradable matrix. 2,5-dimethyl-2,5-ditertbutyl peroxyhexyne (Luperox 130, Luperco, Germany) was used as the initiator of crosslinking.
The composites were prepared by melt mixing all com- ponents in a Plasti-Corder kneading machine PLE 330 (Brabender, Germany) at 120 °C for 10 minutes. Test speci- mens were prepared by compression molding at 120 °C for 2 minutes and at 180 °C for 20 minutes for uncrosslinked and crosslinked materials, respectively. The peroxide has been completely decomposed under given conditions. The dog – bone specimens for testing the mechanical properties were cut at room temperature using a specially shaped knife. Mechani- cal properties were measured using the Universal testing ma- chine INSTRON 4301 at RT at deformation rate 10 mm / minute. Thermal parameters of samples were meas- ured using DSC 821e (Mettler-Toledo) in nitrogen atmos- phere. Heat of fusion and melting temperature was deter- mined from the second heating scan. Brittle fracture surfaces of notched samples for SEM observation were prepared at a liquid nitrogen temperature. Scanning electron microscope JSM 6400 (JEOL, Japan) was used for micrographing.
0,1 1 10 100 1000
0 20 40 60 80
filler, wt %
elongation at break, %
0 200 400 600 800 1000
0 20 40 60 80
filler, wt %
elongation at break, %
0 10 20 30 40 50
0 20 40 60 80
filler, wt %
tensile strength, MPa
0 300 600 900 1200 1500 1800
0 20 40 60 80
filler, wt %
Young's modulus, MPa
Fig.1. The dependences of mechanical properties on the filler content for uncrosslinked (full triangles) and crosslinked (open squares) polycaproplactone filled with switchgrass
The effect of the filler content for uncrosslinked and crosslinked mixtures is seen in Fig. 1. The effect of both the filler content increase and the crosslinking is similar to the one observed for polyethylene filled with organic fillers5,6. The increase in the filler content leads to an increase in Young’s modulus and a decrease in the elongation at break.
This behaviour is generally common for most of two-phase polymeric systems if a stiff component is mixed into a ductile matrix.
Crosslinking results in certain changes in the depend- ences of mechanical properties on the filler content. First, it is seen that crosslinking leads to a decrease in Young’s modulus, tensile strength and elongation at break for PCL without filler. The decrease in modulus can be ascribed mainly to the drop in the crystallinity degree in the virgin polymer (see Fig. 3). As seen in Fig. 1, the same effect re- garding both mechanical properties and melting parameters was observed also for composites with low amount of the filler. With rising filler content, the effect of crosslinking on mechanical properties is changing. In spite of decreased crys- tallinity, modulus of crosslinked PCL / switchgrass composite with the filler content above 30 wt.% is higher compared to the uncrosslinked composites with the same concentration of the filler.
This behaviour is similar to that observed for LDPE / organic filler composites and has been ascribed to a formation of covalent bonds between polymeric chains and the filler surface. Grafting of the polymer occurs on the filler surface, leading to an increased adhesion on the phase boundaries.
Consequently, more compact material is formed with fewer voids formed during the sample preparation, containing smaller number of weak units where crack could be easily formed. This is clearly seen especially at filler content above 60 wt.% where uncrosslinked composites suffer from many defects, resulting in a decrease of modulus (presumably due to a formation of number of voids leading to a decrease in effec- tive cross section of the specimen) while a permanent increase in the modulus values for crosslinked samples is observed, up to impressive 1.5 GPa. Obviously, improved adhesion of the part of polymeric matrix onto filler surface results in a forma- tion of much more compact materials with lower number of defects.
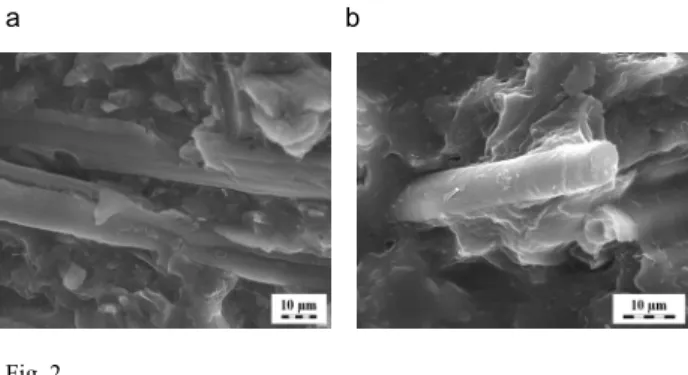
The increased adhesion of the matrix polymer onto filler surface due to crosslinking was directly observed by SEM, as seen in Fig. 2, where fracture surfaces of composites contain- ing 50 wt.% of the filler are shown. The filler surface of un- crosslinked material is almost clean from the polycaprolac-
tone, while for crosslinked composite remnants of the poly- mer attached to the surface is clearly observed.
On the other hand, a decrease in elongation at break as a result of crosslinking can be ascribed to a decrease in the chain mobility due to cross bonds introduced. These tenden- cies are observed for the unfilled PCL and composites with low amount of the filler, up to about 20 wt.%. With rising filler content, the behaviour is changing. In this case, crosslinking results in an increase in deformability partially due to lower crystallinity but mainly resulting from higher resistance to crack formation on the polymer − filler phase boundaries as discussed in10.
Tensile strength curves shown in Fig. 1 indicate that this parameter depends on both modulus and deformation values.
Growing modulus contributes to an increased strength but the same is true for elongation at break, namely due to possible elongation strengthening at high deformation, but generally simply because at similar modulus more energy is required to break the sample if deformation is higher. A decreased num- ber of defects on the polymer – filler boundaries contributes to an increased tensile strength as a result of crosslinking.
The melting parameters (melting temperature and heat of fusion proportional to overall crystallinity) are shown in Fig. 3 in dependence on the filler content for crosslinked and uncrosslinked samples. Crosslinking leads to lower melting temperature obviously due to the fact that crosslinking repre- sents a defect in the polymeric chain, resulting in shorter folds forming crystals. It is understandable that lower amount of the polymer can crystallize if more defects are introduced in the chains leading to lower values of the heat of fusion.
Thus, it can be concluded that treating the polycaprolac- tone / switchgrass composites with organic peroxide results in an increase of polymer adhesion on the filler surface as indi- cated by mechanical properties, scanning electron microscopy and melting parameters. The observed changes in mechanical properties are interpreted as a uperposition of improved inter- actions on the phase boundaries and a decrease in crystallin- ity.
The research was supported by the Slovak Research and De- velopment Agency APVV, grant No 51-010405.
REFERENCES
1. Biodegradable Polymers, Principles and Applications, (Scott G., ed). Kluwer Acad. Publ., Dordrecht 2002.
2. Zuchowska D., Steller R., Meissner W.: Polym. Degrad.
a b
Fig. 2.
48 50 52 54 56 58 60
0 20 40 60 80
filler, wt %
Tm, oC
50 55 60 65 70
0 20 40 60 80
filler, wt %
heat of fusion, J/g
Fig. 3. Melting temperature and heat of fusion of uncrosslinked (full triangles) and crosslinked (open squares) polycaprolactone composites in dependence on the switchgrass filler content
Stab. 60, 471 (1998).
3. Bikiaris D., Prinos J., Koutsopoulos K., Vourotzis N., Pavlidou E., Frangis N., Panayiotou C.: Polym. Degrad.
Stab. 59, 287 (1998).
4. Maldas D., Kokta B. V.: J. Adhes. Sci. Technol. 8, 1 (1994).
5. Nógellová Z., Kokta B. V., Chodák I.: J. Macromol.
Sci., A, Pure Appl. Chem. 35, 1069 (1998).
6. Chodák I., Nógellová Z., Kokta B. V.: Macromol. Symp.
129, 151 (1998).
7. Janigová I., Lednický F., Nógellová Z., Kokta B. V., Chodák I.: Macromol. Symp. 169, 149 (2001).
8. Chodák I.: Progr. Polym. Sci. 20, 1165 (1995).
9. Sedláčková M., Lacík I., Chodák I.: Macromol. Symp.
170, 157 (2001).
10. Chodák I., Chorváth I.: Macromol. Symp. 75, 167 (1993).
KL-07
RECYCLING OF PLASTIC COMPONENTS IN THE CAR LAMPS
MAREK KOZLOWSKI and STANISLAW FRACKOWIAK
Wroclaw University of Technology, Faculty of Environmental Engineering, Laboratory of Advanced Polymeric Materials and Recycling, Wybrzeze Wyspianskiego 27, 50-370 Wroclaw, Poland
Introduction
Plastics represent a steadily increasing share among the materials used for construction of automobiles. These materi- als are advantageous in comparison to metals because plastics do not rust, are easily processable, highly aesthetic, safe and comfortable in use. However, a main merit is that a density of plastics is a few time lower than that of steel or cast iron.
With a vehicle mass saving one can reduce a fuel consump- tion, thus contributing to an improvement of environment by means of reducing CO2 emissions and by savings the natural resources (crude oil). The material savings are related to re- covery and recycling of plastic parts from the end of use vehi- cles. This possibility is directly related to the required quota of the materials re-use and recycling according to the ELV Directive 2000/53/CE (currently 85 wt.% and 95 wt.% till 2015). Among recovery methods the mechanical recycling (reprocessing) has a well established position for its simplicity and economy. However, the economical profits depend on a kind of the polymer to be recycled. As a rule, recycling of the commodity plastics is hardly profitable (besides large, easy to dismantling parts), because the costs of technology are higher than the difference in price between the virgin resin and recy- late. Much more profits one can expect from the mechanical recycling of engineering plastics, which price of a virgin poly- mer is high. To this group of plastics belong polycarbonate (PC), polyamide (PA), ABS, POM, PMMA, PBT. Among the parts constructed with these polymers are the front and rear lamps. The headlamps are made of polycarbonate, whereas in
the tail lights besides PC also ABS and PMMA is used. Recy- cling of these plastic has been discussed in this paper.
Teh easiest way of waste management is regrinding and reprocessing into a form of pellets. Unfortunatelly, during these processes a degradation of polymers takes place. This results in a deterioration of the mechanical properties of recy- clates. The extent of degradation depends both on the equip- ment used for recycling (grinders, dryers, extruders), operat- ing parameters and on a nature of the polymer. Some poly- mers are sensitive to moisture, whereas others can reproc- essed several times without any visible influence on their properties.
Possible changes have been presented in Fig. 1 for poly- carbonate. While recycled in dry conditions, PC retains high stiffness even after five recycling stages. If avoiding drying, the mechanical properties of polycarbonate drop dramatically after each recycling. Deterioration of properties can be re- duced by blending of a recyclate with other polymers or fill- ers. Such possibilities have been attempted and the results have been presented in this paper.
Experimental
The polymers used for the study were: polycarbonate Makrolon (Bayer), polymethyl methacrylate PMMA 920 (Altuglas) and ABS copolymer. For compatibilization of blends a maleated copolymer Kraton SEBS-g-MA was used.
Polymer composites were manufactured by addition of following fillers: unmodified montmorillonite Nanomer PGW (Nanocor), organically modified montmorillonites Nanomer I30.P, Nanomer I44.P (Nanocor) nanometric calcium carbon- ate NPCC (NanoMaterials Technology).
Composites manufactured with PC, ABS, PMMA and respective fillers (5 wt.%) were prepared by melt mixing with a periodic mixer Haake (220−235 °C depending on a matrix polymer).
Melt rheology was measured with HAAKE Rotovisco RT20 rheometer. Mechanical properties were evaluated with a tensile machine Lloyd LR10k or an impact tester Resil 5.5 (Ceast).
Young Modulus, MPa a
b
Fig. 1. Young modulus of recycled polycarbonate: a) dryed; b) wet