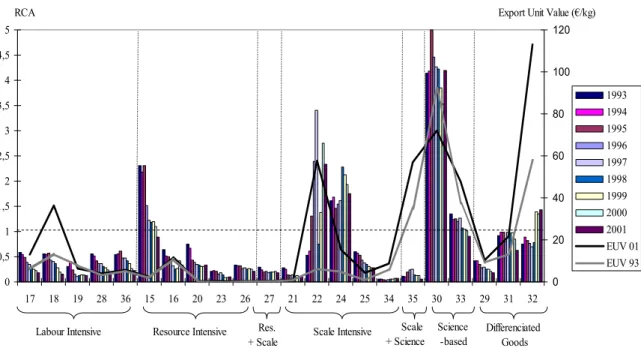
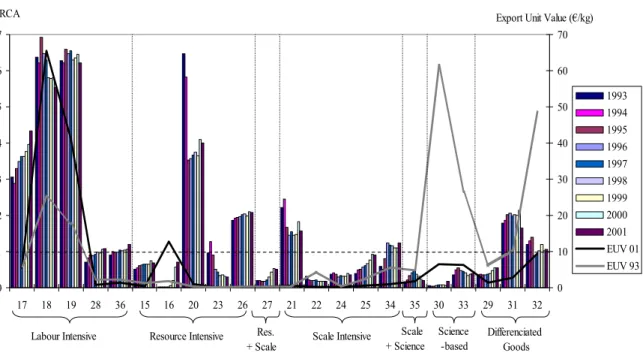
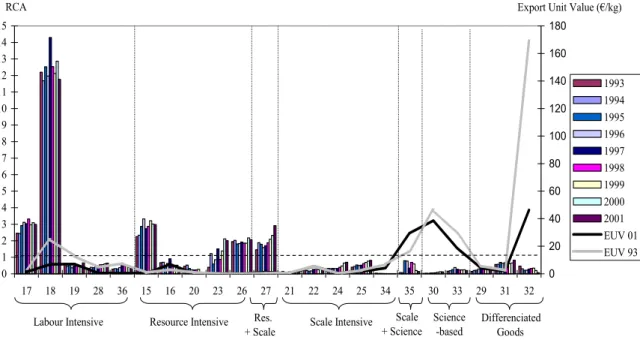
Focusing on the four cohesion countries, Spain, Portugal, Ireland and Greece, this paper presents the main changes in sectoral developments and the change in RCA indicators in EU15 exports. Comparing the results with the corresponding indicators for the selected accession countries shows that there is strong competition between the cohesion and accession countries as suppliers to the EU15 market. However, most cohesion and membership countries have a strong comparative disadvantage in the EU15 market in science-based industries.
Introduction
Taxonomy: Analytical Sector Classification
Traditional Taxonomy
Pavitt Taxonomy
Outsourcing is mainly interactive learning with specialist suppliers, but also input from science-based firms. There are certainly technological linkages between different categories of firms, which may go beyond transactions involving the purchase and sale of goods embodying technology. These may include information and skill flows, as well as technological diversification in key product areas of suppliers and customers.
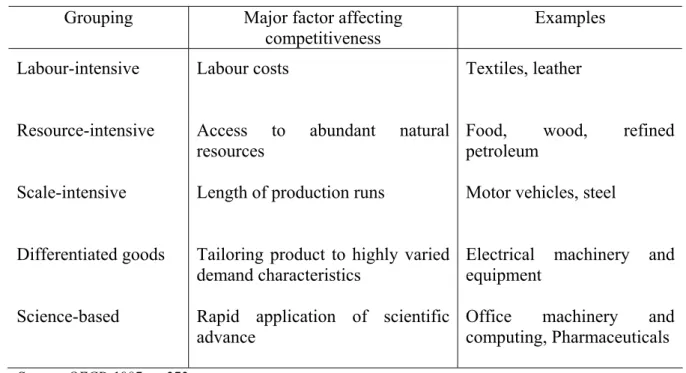
OECD Taxonomy
Furthermore, the groups scale-intensive and differentiated goods (or specialized suppliers) increasingly overlap in practice, so that one could aggregate these two groups under production-intensive goods, just like Pavitt (1984). Base metals (27) thus belong to both the resource- and scale-intensive groups: while iron and steel production belongs to the scale-intensive group, the production of non-ferrous metals is rather resource-intensive. The manufacture of other transport equipment (35) is also placed between two groups: aircraft and spacecraft are clearly scientifically based, while shipbuilding and railways belong to the scale-intensive group.
Empirical Analysis of Specialization Patterns of Manufacturing Exports in
Trade Coverage Index
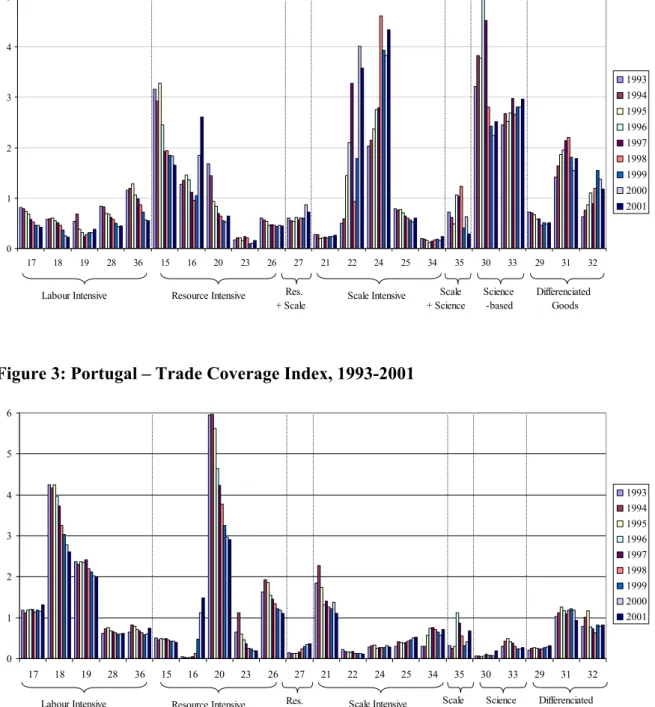
At the end of the 1990s, in more than half of the production groups, imports exceeded exports, which is why the TCI is lower than one. At the end of the 1990s, compared to the EU-15, Portugal still excelled in exporting three products: cork (20), clothing (18) and leather products (19). In most other groups, the TCI is already lower than 1 at the end of the sample.
Modified RCA-Balassa
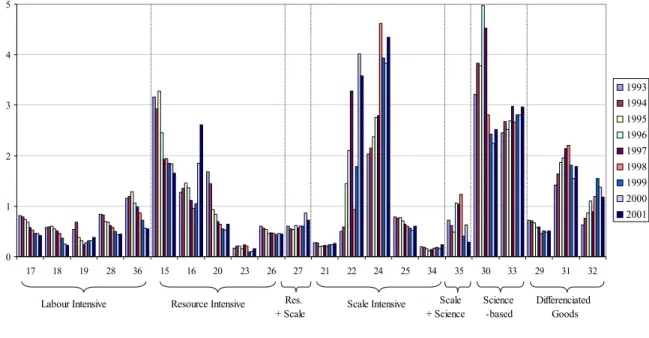
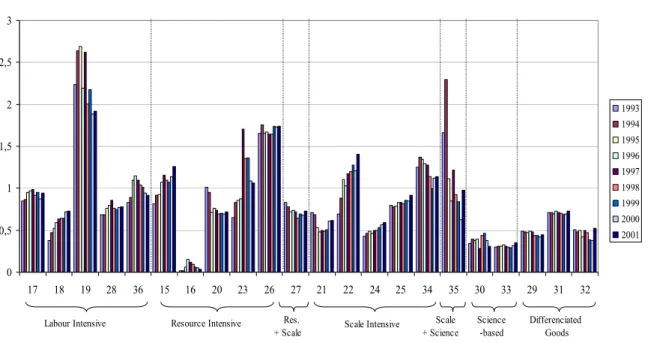
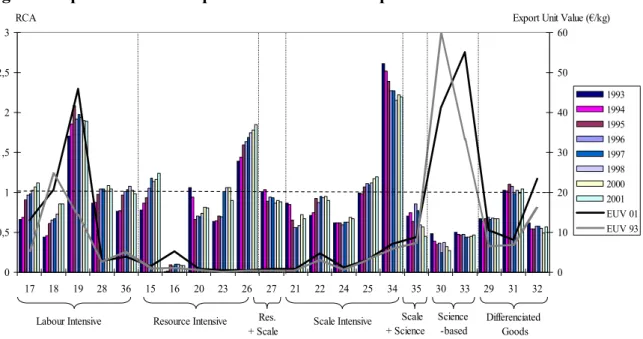
Although the number of product groups with RCA more than one has slightly increased since 1995, there does not appear to be much of a dynamism in the development of Spanish exports to the EU.7 Exports are dominated by three low- and medium-technology product groups: tanning and dressing of leather (19), non-metallic mineral products (26) and motor vehicles and trailers (34); the latter group is the most important manufacturing export industry, accounting for up to 35% of total manufacturing exports. Spain has therefore clearly specialized in the export of some medium and low technology product groups and has a strong comparative disadvantage in the export of science-based products. In contrast to Spain, Irish exports are dominated by science-based products; particularly in the export of office machinery and computers (30), Ireland has a very strong comparative advantage compared to the EU15 (figure 6).
Also in terms of trade volumes, office machinery and computers are the most important sector in Irish manufacturing exports to the EU15, as 46% of manufacturing exports in the year 2001 belonged to this product group; followed by chemicals and chemical products (24), which account for around one quarter of exports to the EU15. While in the first half of the 1990s, Irish food and drink exports had RCAs exceeding unity, their importance declined significantly towards the end of the sample period. On the contrary, exports in radio, TV and communication equipment (32) have achieved a comparative advantage on the EU15 market in recent years, impressively almost doubling export unit values from €60/kg in 1993 to €110/kg in the year 2001.
In resource-intensive sectors, Portugal is also competitive in the EU-15 market with wood and cork products (20) and non-metallic mineral products (26). However, export unit values clearly increased for low-technology-intensive goods from 1993 to 2001, on the contrary, for high-technology products, export unit values decreased sharply during the period 1993 to 2001. It is astonishing that the export unit values in all these categories are clearly below €10/kg.
It is clear that in the development of Greek foreign trade with the EU15 it seems to have specialized in low-tech industries and often in low-quality products.
The Grubel-Lloyd Index of Intra-Industry Trade
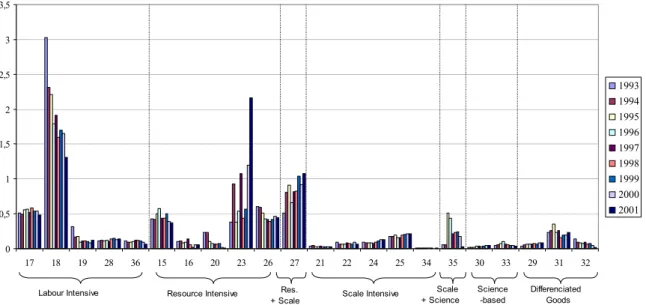
RCA is dominated by a very high value of comparative advantage in wearing apparel (18), together with a very low export unit value of €7, down from €25/kg in 1993. Compared to Portugal's €65, Ireland's €40 and Spain's €20/kg in this product group, Greece appears to supply the EU15 with low-quality clothing. These exports are important for the Greek manufacturing industry, accounting for up to one fifth of EU15 manufacturing exports.
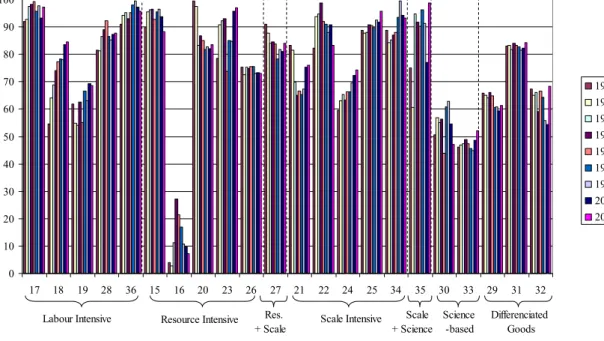
However, there are other labour- and resource-intensive goods which enjoy a comparative advantage in the EU15 market. In product groups where export unit values are significantly higher, such as science-based and differentiated goods, Greece has no comparative advantage at all in the EU15 market. The higher the value, the greater the extent of intra-industry trade, the greater the degree of economic integration, and the more countries can be expected to be subject to similar demand shocks.
With the biggest exception for tobacco (16), this applies particularly to resource- and scale-intensive product groups. On the contrary, integration is less intense in science-based and differentiated goods foreign trade. Also in some labour-intensive industries, integration is slightly lower, although with a trend towards increasing GLIs through the 1990s.
Interestingly, some very high-tech differentiated goods sectors are highly integrated with the EU15, indicating that imports also play an important role here.
Competitiveness Among Selected Accession and Cohesion Countries
- Labour Intensive Industries
- Resource Intensive Industries
- Scale Intensive Industries
- Science-Based Industries
- Differentiated Goods
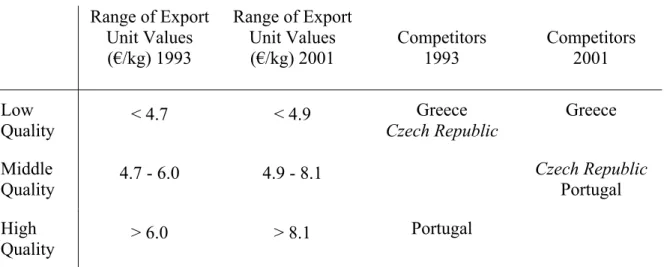
We do this using the quartiles of the distribution of the export unit value of the EU15 countries. 9 The EU15 export unit value distribution for 1993 does not include all 15 countries: Sweden, Austria and Finland had to be excluded due to data availability. It is striking that Ireland does not even compete in any labour-intensive sector as a supplier to the EU15 market.
In both years considered, there are three competitors on the EU15 market, namely Portugal, Greece and the Czech Republic. All three have raised their RCA from 1993 to 2001 and thus strengthened their competitive position on the EU15 market. While Poland continues to export low-quality furniture, the Czech Republic can significantly increase its export units and now supplies the EU15 market with medium-quality furniture (Table 8).
In general, the accession and cohesion countries have a fairly extensive presence in the EU15 market with labour-intensive products. Ireland and Hungary have clearly moved away from exporting resource-intensive goods to the EU15. High-quality non-metallic products continue to be exported to the EU15 by other groups outside the accession and cohesion countries (Table 12).
It competed against Greece in the low-quality product group, but Greece upgraded its quality and supplied high-quality base metals to the EU-15 in 2001. It is one of the few product groups where EU-15 export unit values decreased during 1993. and 2001. In 1993, Ireland is the only country with a relative comparative advantage in the EU15 market for office machinery and computers.
Summary, Conclusions and Future Research
Hungary, in addition, supplies higher quality goods competing against Spain and Ireland in several product groups. High-quality goods, however, are largely not supplied by the membership and cohesion regions in the EU15 market. In order to gain a complete picture of the competitive structure of suppliers in the EU 15 market, other European countries and some non-European suppliers of the EU market may also be included.
Due to the purpose of this paper to analyze the competition that the accession countries will face in the EU market, the approach of looking at the cohesion countries is appropriate. We find that both accession and cohesion countries compete mostly within the same product categories with goods of lower and medium quality. Higher quality products, and especially science-based products of all qualities, are thus still supplied to the EU15 by countries other than the accession and cohesion countries.
It would be interesting to look at sectoral wages and value added in manufacturing to determine whether the competitiveness of some product groups in a country really comes from the country itself, or whether it is imported. High wages and high added value in product groups with a strong comparative advantage and a high value per export unit may indicate that the added value really comes from the exporting country. However, low wages and low value added in production may indicate assembly line production.
Last but not least, it is necessary to use more advanced econometric methods for the analysis.
262 Manufacture of non-refractory ceramic goods other than for construction purposes; manufacture of refractory ceramic products. 267 Cutting, shaping and finishing of ornamental and building stone 268 Manufacture of other non-metallic mineral products. 282 Manufacture of tanks, reservoirs and containers of metal; manufacture of central heating radiators and boilers.
286 Manufacture of cutlery, tools and general hardware 287 Manufacture of other fabricated metal products 29 Manufacture of machinery and equipment n.e.c. 291 Manufacture of machinery for the production and use of mechanical power, Except aircraft, vehicle and bicycle engines. 292 Manufacture of other general machinery 293 Manufacture of agricultural and forestry machinery 294 Manufacture of machine tools.
295 Manufacture of other special machinery 296 Manufacture of weapons and ammunition 297 Manufacture of household appliances n.e.c. 314 Manufacture of accumulators, primary cells and primary batteries 315 Manufacture of lighting equipment and electric lamps. 323 Manufacture of television and radio receivers, sound or video recording or reproducing apparatus and related goods.
343 Manufacture of parts and accessories for motor vehicles and their engines 35 Manufacture of other means of transport.
27 Welfens, P.J.J.: Small and Medium-sized Companies in Economic Growth: Theory and Policy Implications in Germany, maj 1997. 48 Welfens, P.J.J.: Trade and Optimum Import Tariffs: A Note in the Context of Foreign Direct Investment, juni 1998. 59 Welfens, P.J.J.: Internet Market Dynamics in Germany: From a small Market to a Strategic Sector of the Economy, maj 1999.
62 Welfens, P.J.J.: The beginning of the euro, international relations and inflation, April 1999. No. 63 Sutela, P.: Overcoming the Russian transformation crisis: selected issues and political options,. 77 Welfens, P.J.J.: Modern Exchange Rate Theory and Schumpeterian Economic Analysis: A New Approach and the Use of the Euro, June 2000. 82 Welfens, P.J.J.: Transatlantic Growth Differentials, ICT Dynamics, Fiscal Policy and the Fall of the Euro, July 2001.
95 Welfens, P.J.J.: Verfassungsfragen und die Qualität des politischen Wettbewerbs: Analyse und Implikationen für eine zukünftige EU-Verfassung, April 2002. 99 Welfens, P.J.J.: Finanzpolitik zwischen schwachem Wachstum und Maastricht-Vertrag/Stabilitätspakt: Neuausrichtung der Steuerreform und , September 2002. 105 Welfens, P.J.J.: Exchange Rate Dynamics and Structural Adjustment in Europe, Mei 2003 No.
Internationale Erfahrungen und politische Implikationen für Russland, Februar 2004 Nr. 121 Jungmittag, A.; Welfens, P.J.J.: Politikberatung und empirische Wirtschaftsforschung.
