Introduction
- Research perspective
- The industrial setting
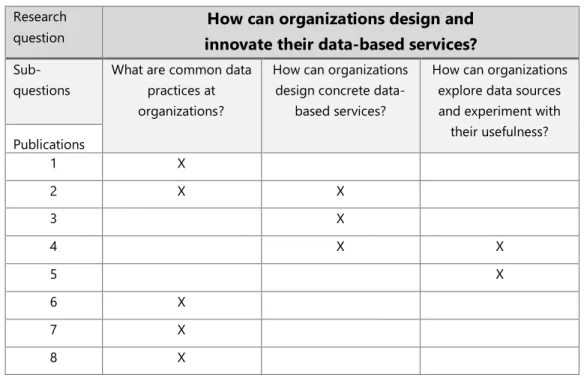
- Research Questions
- Contributions
- Reading guide
This dissertation explores how domain experts who are not IT professionals can participate in the design and innovation of the data and data structures that support the data-based services they use and provide as part of their work practices. This dissertation takes a practice perspective on understanding the organizational practices and processes that play off each other to produce the data work that underpins data-based services. I argue that in the context of designing data-based services, these fields of practice overlap to some extent.
Therefore, in this work I consider how these different areas of practice can complement each other in terms of involving non-IT domain experts in the design of data and data structures that support data-driven services. Fourth, this dissertation elaborates on tools developed to enable non-IT domain experts to participate in the design of data-driven services. Finally, Chapter 8 develops a proposal to establish a data co-design perspective to support the design and innovation of data-driven services.
Contextualizing the research project
- The field site
- A data focus on services
- Service innovation in the age of datafication
IU operates 12 Sector Skills Councils, authorities responsible for ensuring that vocational and continuing education programs are developed in line with the needs of the labor market. This model defines the organization of the Danish labor market and its partners (the state and the social partners, namely employers' organizations and trade unions). The third element of the model is a high degree of organisation, which means that a large number of Danish workers are members of a union.
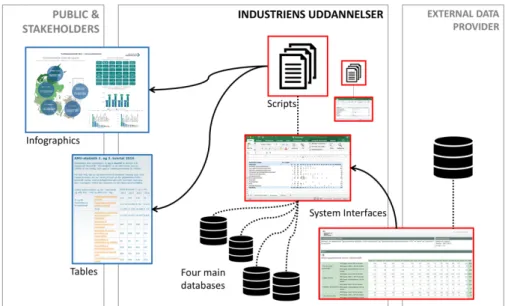
Around 67% of Danish workers are members of a trade union, and the majority of Danish companies are members of an employers' association (Danish Business Authority 2019)' (See also Publications 6). This dissertation considers services that are in the public domain, supported by digital technologies, and whose data is a core component of service provision and delivery. For example, in the context of IU, a data-based service can be when the established 'Statistics Team' prepares and shares statistics and infographics that are a central part of the.

Theoretical Position
- A practice-based perspective on data
- Studying data practices in the workplace
- Designing with data from a practice perspective
Having established in this dissertation how I understand practice and what constitutes a practice perspective, I address the question 'what are data?' in the next section. The next section explores how this practice perspective on data and data work can emerge in the context of design. From a practical perspective, designing with data implies the need to involve the people who produce, use and understand the data in the design process.
Specifically, I used service design to explore how we can develop ways to connect the technical and the social in the participatory design process. Service design has adopted participatory and co-design approaches to involve stakeholders in the design process. These arguments highlight the relevance of using these two fields of practice in the context of this research project.
Methodology, project description, and research activities
- Action Research
- Project description and research activities
- Reliability of the empirical research
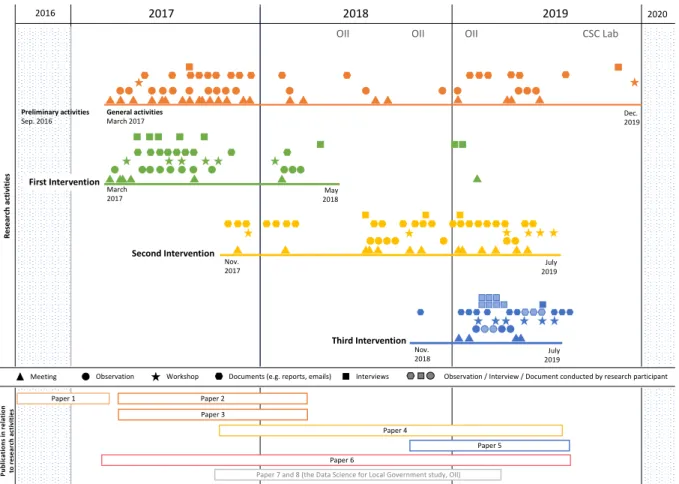
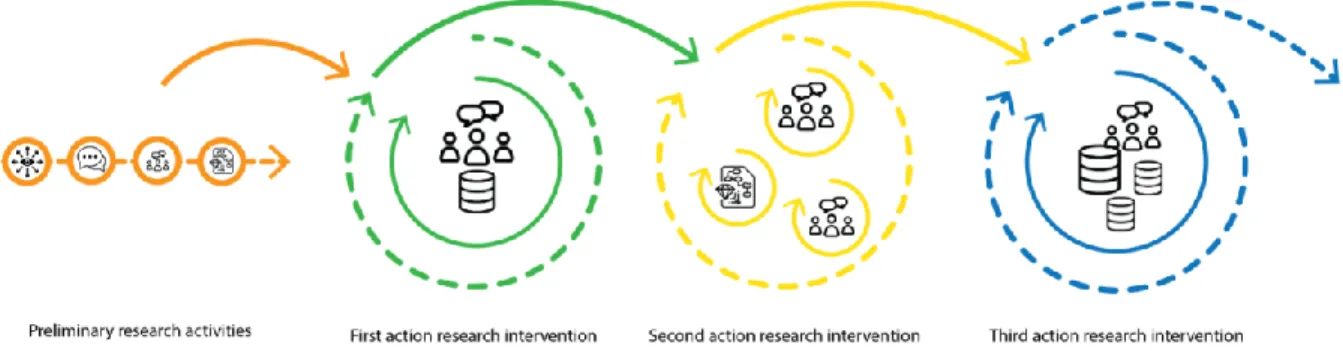
The color codes (orange, green, yellow and blue) are related to the overview of the research activities and the related data collection presented in Figure 3. Second, the action research interventions also aimed to extract new organizational knowledge from each of the processes (this is depicted by the enclosing dashed lines in figure 2). In the next section, I elaborate on how this general structure of the research process manifested itself through the research activities.
This section provides an overview of the research activities carried out and the different methods used during this project. Overview of the action research interventions and research activities, and how the publications relate to the fieldwork. Through a collaboration with IU's (at the time) only external IT developer and members of the .
Summaries of the publications
This comparison suggests that service design representations lack ways of incorporating data as a central part of the design of data-based services. This study proposes to use the notion of expansion as a way to evaluate future data representations for data-based design. The third publication examines how data can be brought to the forefront of co-design in ways that allow domain experts to bring their expertise to the design of data-based services and the services' underlying data structures.
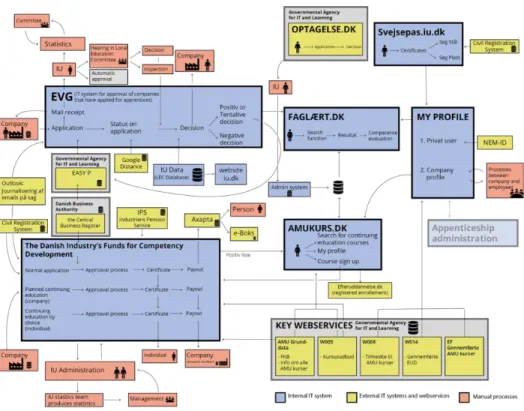
This publication contributes to the dissertation by showing that the use of carefully designed data logging can enable non-IT subject matter experts to participate in the design of data that supports their data-driven service delivery. This article presents a diagram of a complex setup in which the IU provides many key data-driven inputs. The report contributes to this dissertation by triangulating observations of common data practices and the implications for new forms of data work in public sector organisations.
Making data an explicit element in the co-design of data-based services
- Concrete and abstract data design
- Routine and emergent data needs
- A data mode map for co-design
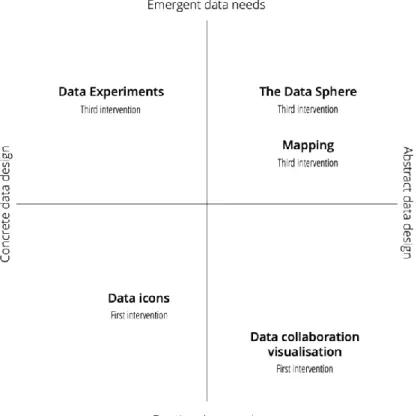
Another instance where routine and new data needs became visible was during the first intervention, when domain experts from IU and external organizations (representing key stakeholders) worked with the data icons. This research shows that it is important to consider the continuum of routine data needs when designing data representations for co-design because it supports reflection on the 'state' and 'knowledge' of the data: is this data critical for the organization to deliver a specific computerized service. I have filled in the data state map below with the main data representations included in this work to illustrate the use of this tool.
The data representations are mapped according to both their intended inclusion of data as an explicit element of co-design, and the use of their representation, meaning how they were applied in a co-design situation. For example, Data Sphere aimed to make users think about new data sources that could be interesting in connection with service innovation in the organization. Based on this, I have placed the data sphere in the upper right corner of the data mode map.
Establishing a culture of design and innovation
- Democratizing data-driven innovation in the organization
- Expanding the organization’s ‘innovation toolkit’ through co-design
From a practice perspective, user-driven innovation becomes an essential aspect of promoting data-driven innovation in an organizational context. Therefore, I argue that fostering user-driven innovation is a necessary stepping stone to fostering data-driven innovation in an organizational context. Further establishing a culture of democratized, data-driven innovation processes in an organizational context involves enabling members of the organization to innovate with data.
This research project explored co-design as an approach to expanding an organization's innovation toolkit in a way that fosters democratized, data-driven innovation. section I discuss why co-design is a useful approach to advancing design and innovation with and through data in an organizational context. This suggests that co-design is also a useful approach to design and create visible democratic, data-driven innovations in an organization. Overall, this research suggests that co-design is a useful set of practices to support organizational members to incorporate a cooperative view of and work with data and to make data-driven innovation visible in the organization.
Towards a co-design perspective on data
This is an important contribution when we ask how we can design with data, as it allows us to think about the "design in use" (Henderson and Kyng 1991) of data and data structures. Overall, this perspective provides an essential foundation for ways to theorize about how we (can) design with data. The first aspect concerns whether planning with data happens in a more or less conscious way.
However, these examples illustrate unintentional planning with data, meaning that users of an online dating app do not consciously plan their use of data. Another way in which this work extends Feinberg's (2017) design view of data is by presenting ways to jointly implement design with data and data structures. The empirical work of this dissertation reveals that in an organizational context where multiple stakeholders are interdependent on data and data infrastructure, aspects of data collaboration, data work, and data design must be considered.
Conclusions and future work
This thesis explores co-design as a set of practices that can develop organizational members' ability to engage in data-driven innovation. The fourth contribution of this thesis is a toolkit that includes several ways to foreground data in co-design. Specifically, the tools developed in this work examine how domain experts who are not IT professionals can participate in the design of the data-based services they use and provide as part of their work practices.
A third aspect concerns the development of the theoretical proposal of a co-design perspective on data. In Proceedings of the ACM 2008 Conference on Computer Supported Cooperative Work - CSCW '08, San Diego, CA, USA: ACM Press, 515. In Proceedings of the 11th Biennial Participatory Design Conference on - PDC '10, Sydney, Australia: ACM Press , 41.
In Proceedings of the 18th ACM Conference on Computer-Supported Cooperative Work and Social Computing - CSCW ’15, Vancouver, BC, Canada: ACM Press, 1289–1301. In Proceedings of the 2016 CHI Conference on Human Factors in Computing Systems, CHI '16, San Jose, California, USA: Association for Computing Machinery, 5933–5944. In Proceedings of the 7th International Workshop on Media for Networks, Clouds and e-Science - MGC ’09, Urbana Champaign, Illinois: ACM Press, 1–6.
In Proceedings of the 30th Australian Conference on Human-Computer Interaction - OzCHI ’18, Melbourne, Australia: ACM Press, 421–. In Proceedings of the 17th International Conference on Human-Computer Interaction with Mobile Devices and Services - MobileHCI ’15, Copenhagen, Denmark: ACM Press, 916–19. Service Design and Participatory Design: Time to Join Forces?' In 2020 16th Participatory Design Conference- Participation(s) Otherwise, Manizales, Colombia: ACM.
In Proceedings of the 19th International Conference on Supporting Group Work, GROUP ’16, New York, NY, USA: ACM, 509–512.
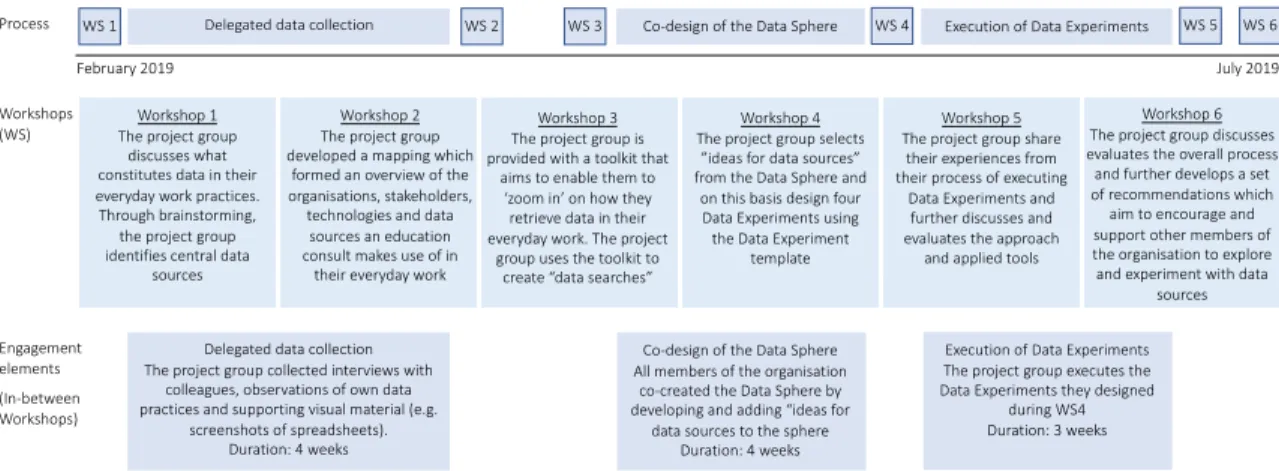
In the following subsections, we will go into more detail about the design of the workshops and the workshop participants. In the next section, we explain the workshop activities and our use of the data notation. In the third phase of the workshop, participants were asked to place the data notation on the data matrix (see Figures 4 and 5).
The second situation highlights how the field experts in the first workshop discussed the limitations of the existing system. The process revealed specific strengths and limitations of the data domain and data experiment model.