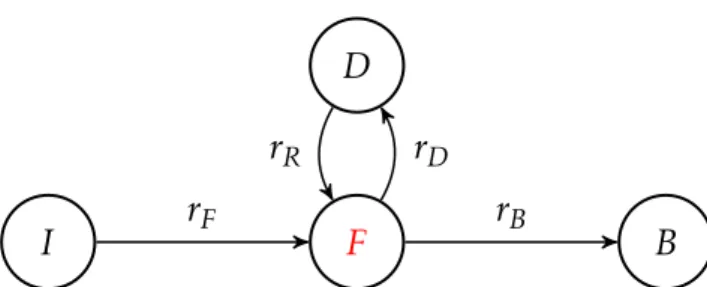
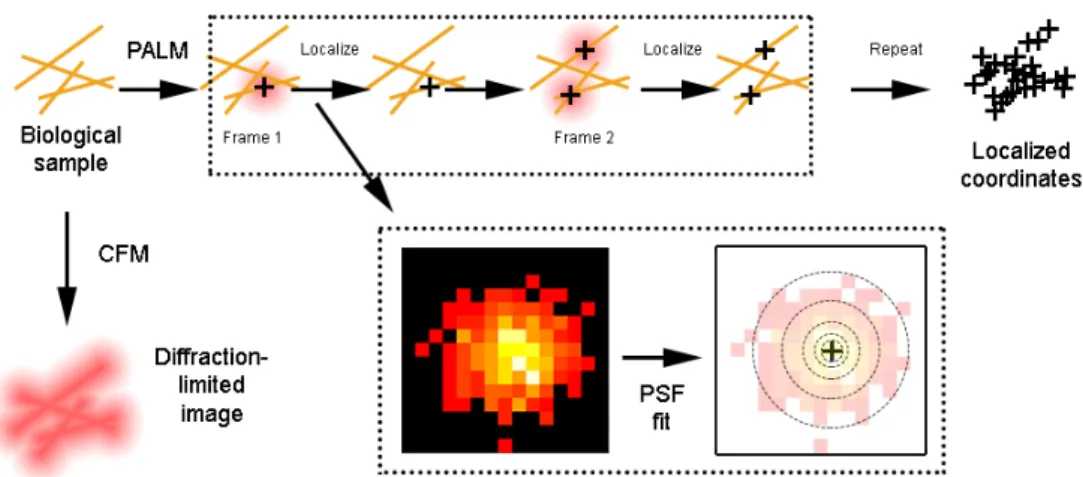
We derive expressions for ζ(fu) in the PALM-IBCpp, on the basis of which three of the four blinking frequencies can be estimated. In Section A.4, we describe an algorithm for estimating the kinetic velocities in the PA-FP blink model.
Prerequisites
In Section A.3, we define a class of IBCpp models and present a useful result on the label correlation function. Depending on the total fluorescence observed with PA-FP and the frame rate of the camera, this can result in a large number of repeats per protein.
Independent Blinking Cluster point processes
Finally, the spatial and temporal intensity of the noise process is assumed to be on the form. As in the general IBCpp formulation, we write the typical flashing cluster on the form.
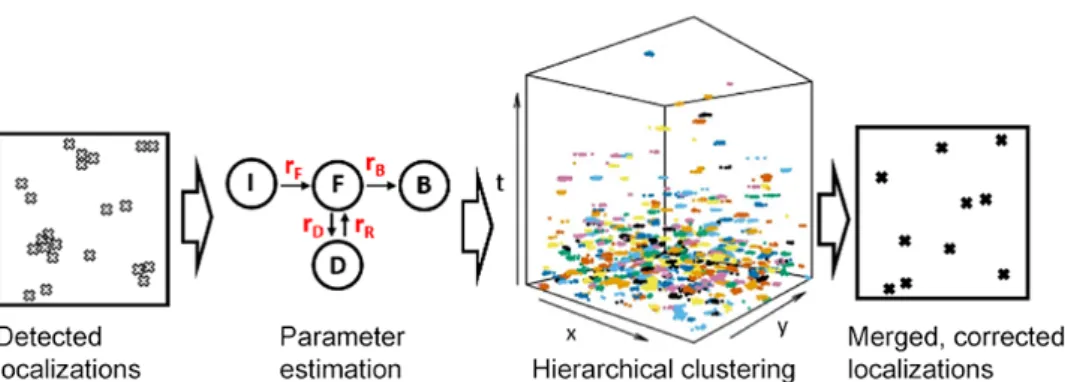
Estimation
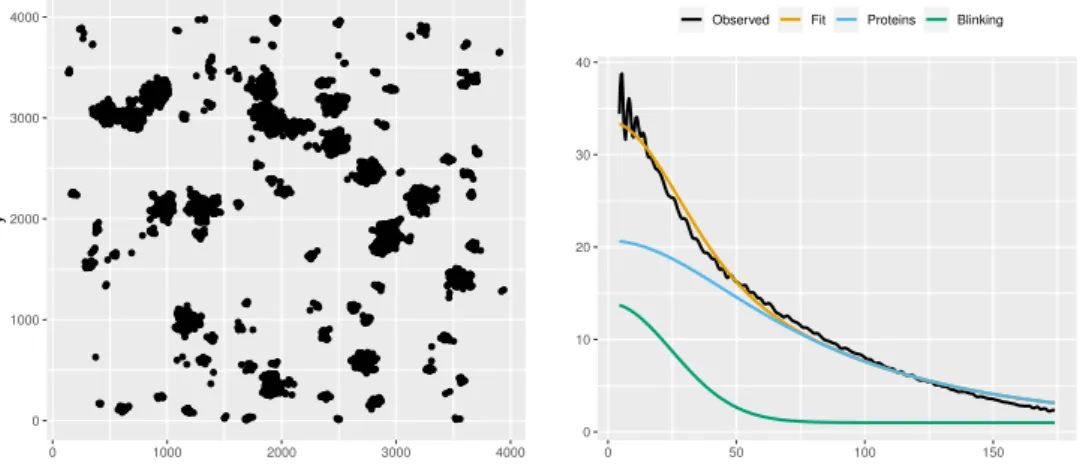
The basis for estimating kinetic rates is the identity in equation (A.3.17), which allows us to extract a purely temporal information from the observed space-time data, primarily via γ1(f) andnc. The second stage is further divided into two stages, asrF is treated separately from the remaining installments.
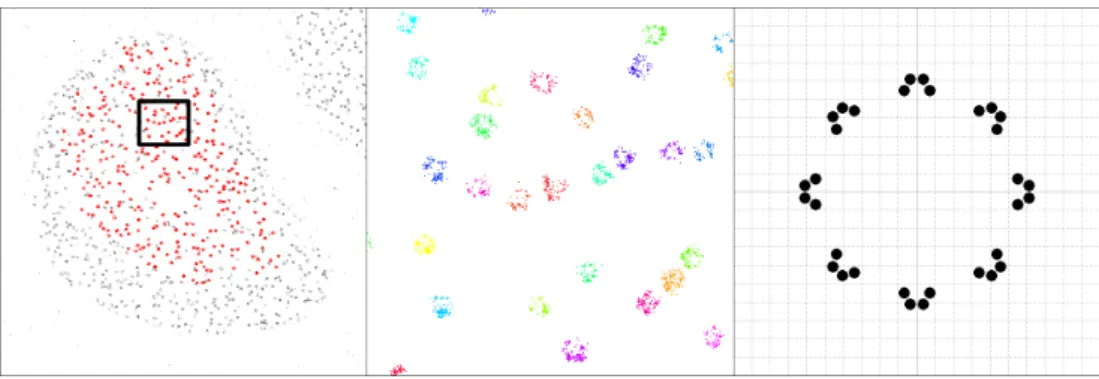
Validation of methods on a nuclear pore complex reference
The idea is that once ˆη is known, we can obtain location-invariant statistics, which allow an estimation of the kinetic velocities. For each cell, we then calculated the "target" number of repetitions per Nup96 (ES[G], "S" denotes SMAP) according to the formula. Table A.1 shows the means and standard deviations of adjustment to the 16 data sets.
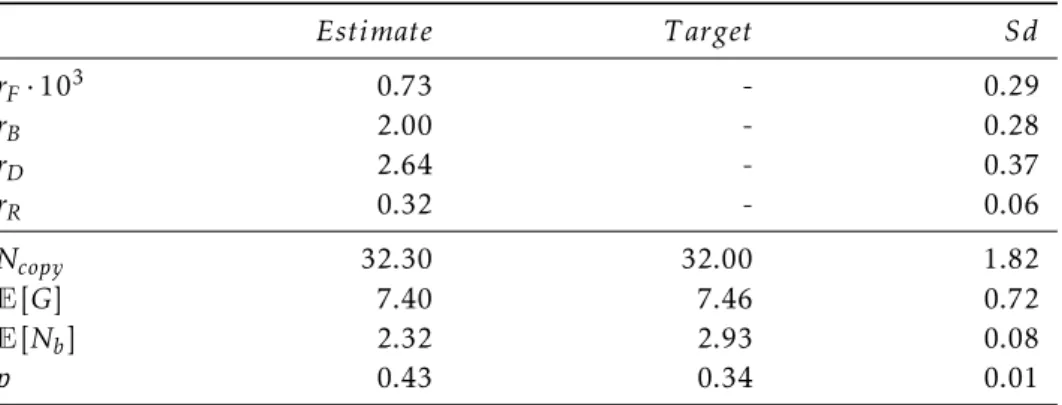
The exact recovery is due to the tight control onE[G], the total number of occurrences perN up96, estimated to be 7.40±0.72 by our model, versus 7.46 for the SMAP analysis. Nevertheless, since both the total number of repetitions and the number of blinking cycles are well estimated, it seems plausible that the estimated blinking dynamics as a whole can be trusted. Results from each dataset, including ELE, number of NPC and dataset IDs, are also available, see Table A.2.
Blinking corrected cluster analysis of LAT-mEos3.2
Data IDs allow identification of the exact data set analyzed as stored in the BioImage archive [ 35 ]. The estimated rates are shown in columns 2 to 5. E[G] and E[Nb] are the estimated total number of Nup96 reappearances and the number of Fstate visits based on the PALM-IBCpp model fit, and ES[G] and ES[Nb] are related goals based on SMAP analysis. Fortunately, once we can estimate the rates of blinking, we can run simulations from a model that approaches zero and gain a better understanding of the true behavior of proteins in clusters.
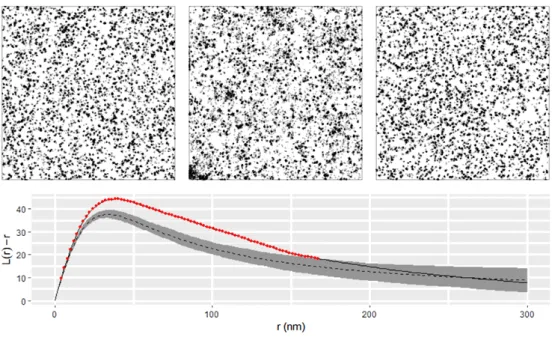
The break in the observed curve above the envelope indicates significant protein clustering in the ROI that cannot be explained by blinking alone (p= 0.004). The results of fitting to ROI can be seen in table A.3, where the results of refitting to 100 simulations of the CSR null model are also included. To validate that our test is approximately at the 5% level, we performed the CSR test for each of the 100 simulations, resulting in 3 rejections, in close agreement with expectations.
Simulation study
You can see examples of simulations in the top row of Figure A.5 left and right. There appears to be some bias for the entry stage in the dark state, rD, which also has the largest uncertainty between stages. Overall, the effect of protein distribution is small compared to that of the different PA-FP models, with a slight increase in variance for the more pooled conditions.
The PC-PALM method requires modeling of the proteins via an assumed form for the protein pair correlation functiong↓X(r). The PC-PALM method fits a model to the observed pair correlation function, from which an estimate can be easily made. PC-PALM is sensitive to the assumed distribution for Gandg↓X, which is especially evident in the 3 dark-state model, which has the most complex blinking behavior, and for the fibers, which has the most heterogeneous spatial distribution.
Summary and discussion
Using both of these estimators, referred to as PC-PALM 1 and PC-PALM 2, respectively, we compared the performance of the IBCpp fit on the simulated data, the results of which can be seen in Table A.5. We see that the IBCpp fit has lower bias and variance in all cases and is less sensitive to the flashing and clustering properties of PA-FP. The first PC-PALM method assumes a Poisson distribution for G, while the second assumes a geometric distribution.
We also performed a refitting study that again demonstrated the ability of the PALM-IBCpp model to accurately recover blinking dynamics in realistic settings. As we have seen, the PALM-IBCpp fit can still capture important descriptors of the blinking dynamics when the model is misspecified, but the parameters of the true blinking model will remain unknown. Efficient code for estimation, simulation, and more has been developed in the PALM-IBCpp model, which is available at github.com/Louis-Jensen/PALMIBCpp.
I Supplementary material
Results
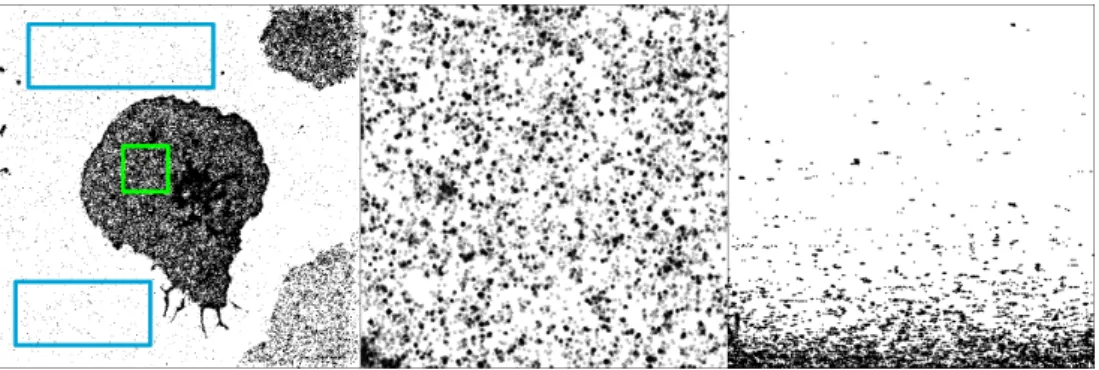
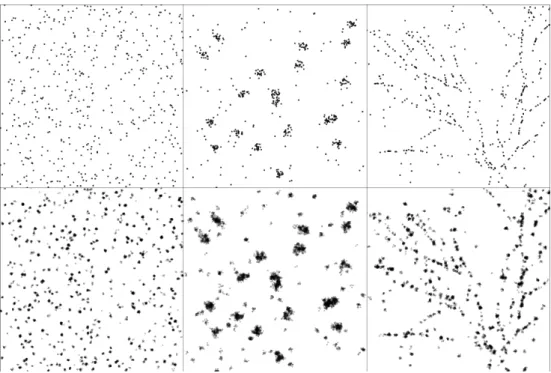
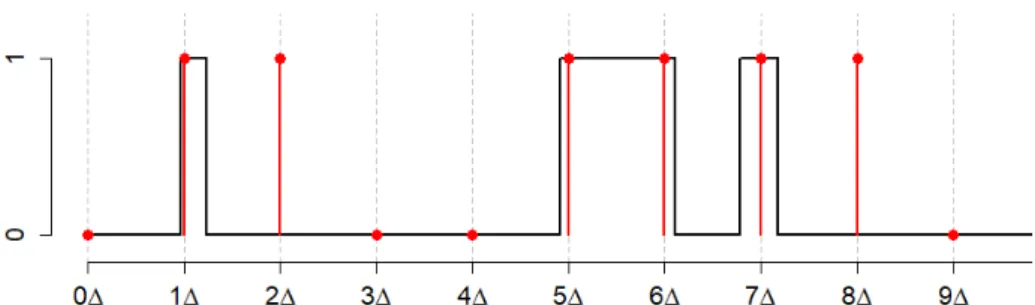
We simulated time traces of fluorescent proteins according to the 4-state switching model (see Figure B.1b), and the continuous signals were discretized to mimic a camera operating at 25 frames per second (40 ms integration time). For each ROI, we calculate the function L(r)-r (Figure B.2b), where L is the L function of Besag[10], testing the maximum (Figure B.2c) under a null CSR hypothesis. The failure of DTT to restore the correct number of clusters is even more apparent in the case of heavy clustering (Figure B.3 c and d).
The nature of this data set allows for easier comparative visualization of the performance of MBC and DTT (Figure B.4 a), and the improvements offered by our method are visually clear. A ground truth of CSR fluorescent proteins was simulated (Figure B.6 a), imaged using the virtual microscope and output analyzed with ThunderSTORM. Other outputs from the cluster analysis: number of clusters per ROI, cluster radius, percentage of molecules in clusters, total molecules per The ROI and the relative density of molecules within and outside clusters are shown in Figure B.7, with p-values summarized in Table B.2.
Discussion
The decrease in cluster membership and, in some ROIs, the loss of clustering altogether, in peripheral regions of the T-cell synapse due to the YF mutation strongly indicates that intracellular tyrosine phosphorylation is involved in the maintenance of LAT- signaling clusters. It is known that signaling phosphorylation events originate in the periphery of the synapse and therefore it is consistent that the effect of the mutation is most pronounced there, compared to the central region where signaling is terminated [27]. MBC therefore represents a new possibility - obtaining a set of corrected ground truth locations of sufficient quality to allow any subsequent statistical analysis to be performed with certainty.
Performance of the correction will decrease as the clustering of the ground truth increases, but it has been tested favorably with realistic and heavily clustered scenarios. For a 3000 nm x 3000 nm ROI containing 500 ground-truth proteins, we estimate the MBC step to take 3-5 minutes per ROI on a standard desktop computer. Finally, MBC allows for accurate retrieval of ground truth fluorophore positions, with improved precision, from PALM datasets subject to multiple flickering artifacts.
I Supplementary material
Main text
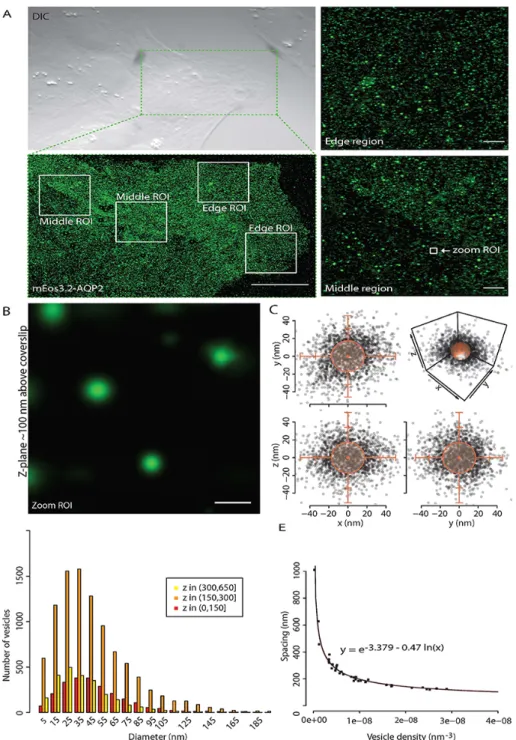
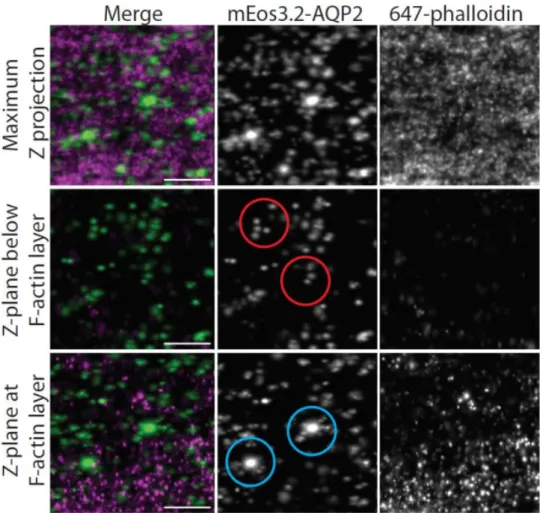
In the renal collecting ducts, urine concentration is precisely regulated by regulated exocytosis of a subset of small subapical AQP2 vesicles to the plasma membrane in response to circulating levels of the antidiuretic hormone arginine vasopressin (AVP) [5, 10]. In addition, F-actin has been proposed to form a barrier between AQP2 vesicles and the plasma membrane, but no insight into the actual position of vesicles relative to F-actin at this tight plasma membrane localization has ever been gained. We then imaged F-actin, which revealed a dense layer of F-actin in the cytoplasm approximately 200 nm distal to the plasma membrane (Figure C.2 A-C).
The majority (66.91%) of AQP2 vesicles were positioned between the plasma membrane and the dense F-actin layer ( Figure C.2 D and movie 2 ) indicating that the F-actin layer did not constitute a barrier to the plasma membrane. for this fraction of AQP2 vesicles. Furthermore, small increases in circulating AVP can mobilize AQP2 vesicles into the niche between the F-actin layer and the plasma membrane without or before dissociation from the F-actin layer, thereby providing a rapid exocytic response. Detailed analysis of these vesicles and F-actin has focused on the neuronal synapse, where specialized vesicles around 40 nm bind to F-actin close to the plasma membrane at the synaptic cleft [ 17 , 22 ].
Materials and Methods
This was accomplished by a random superposition hypothesis test, based on distances to the 1000 (NN) actin proteins from vesicle soups. To investigate whether the degree of colocalization differs based on phosphorylation status, we similarly calculated the distances to the 1000 NNs for the S256-A and S256-D type ROIs. We look at the 1000 NNs, as opposed to the raw number of actin molecules within a set of arrays, because the NNs lend themselves more easily to statistical modeling.
The distance between one vesicle and the nearest other vesicle as a function of the number of vesicles per nm-3. The distance from the vesicle shells to the K'th closest location of F-actin was calculated, and the resulting adjacency curve was used as a means of quantifying the spatial relationships between AQP2 vesicles and actin. The distance to the K'th location of the closest actin from the vesicle surfaces was modeled as a function of cell type, and mean contrasts with WT were estimated.
I Supplementary materials
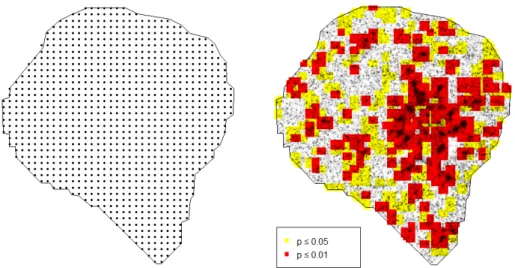
A Density-Based Algorithm for Discovering Clusters in Large Spatial Databases with Noise".Proceedings of the Second International Conference on Knowledge Discovery and Data Mining. To validate this interpretation, we imaged a cell of the same type using expansion microscopy (ExM) [1].A small subset of the ROI (in yellow) is magnified in the bottom row, showing the complex organization of ACT (left) and the spherical clusters of AQP2 (right).
Note that the vesicles were found and parameters estimated on the basis of 3D data, but we only show the projection to the xy plane here for easier visualization. In the paper, Si is a curve of the average distances to the 1000 nearest neighbors in Y from the vesicle shells in X. A Density-Based Algorithm for Cluster Discovery in Large Spatial Databases with Noise”. Proceedings of the Second International Conference on Knowledge Discovery and Data Mining.
![Table A.2: Results from 16 datasets of Nup96 nuclear pore complexes. The data ids allow identification of the exact dataset analyzed, as stored on the BioImage Archive [35]](https://thumb-eu.123doks.com/thumbv2/9pdforg/19309978.0/41.892.173.720.599.868/results-datasets-nuclear-complexes-identification-analyzed-bioimage-archive.webp)