Novel Biomarker for the Monitoring of Disease Activity at
the Point-of-Care
Xi Chen1, Kaveh Pouran Yousef2, Susanne Duwe3, Katharina Karsch1, Sandeep Grover1,
Stephanie Wa¨hlisch3, Patrick Obermeier1, Franziska Tief1, Susann Mu¨hlhans1, Lea Seeber1, Max von Kleist2, Brunhilde Schweiger3, Barbara Rath1*
1Department of Paediatrics, Division of Pneumonology-Immunology, Charite´ University Medical Centre, Berlin, Germany,2AG systems Pharmacology & Disease Control, Department of Mathematics and Computer Science, Free University Berlin, Berlin, Germany,3Robert Koch Institute, Division 17 Influenza and Other Respiratory Viruses, National Reference Centre for Influenza, Berlin, Germany
Abstract
Background:Influenza infections induce considerable disease burden in young children. Biomarkers for the monitoring of disease activity at the point-of-care (POC) are currently lacking. Recent methodologies for fluorescence-based rapid testing have been developed to provide improved sensitivities with the initial diagnosis. The present study aims to explore the utility of second-generation rapid testing during longitudinal follow-up of influenza patients (Rapid Influenza Follow-up Testing = RIFT). Signal/control fluorescent readouts (Quantitative Influenza Follow-up Testing = QIFT) are evaluated as a potential biomarker for the monitoring of disease activity at the POC.
Methods and Findings:RIFT (SOFIA) and QIFT were performed at the POC and compared to blinded RT-PCR at the National Reference Centre for Influenza. From 10/2011-4/2013, a total of 2048 paediatric cases were studied prospectively; 273 cases were PCR-confirmed for influenza. During follow-up, RIFT results turned negative either prior to PCR (68%), or simultaneously (30%). The first negative RIFT occurred after a median of 8 days with a median virus load (VL) of 5.6610‘3
copies/ml and cycle threshold of 37, with no evidence of viral rebound. Binning analysis revealed that QIFT differentiated accurately between patients with low, medium and high viral titres. QIFT increase/decrease showed 88% agreement (sensitivity = 52%, specificity = 95%) with VL increase/decrease, respectively. QIFT-based viral clearance estimates showed similar values compared to PCR-based estimates. Variations in viral clearance rates were lower in treated compared to untreated patients. The study was limited by use of non-invasive, semi-quantitative nasopharyngeal samples. VL measurements below the limit of detection could not be quantified reliably.
Conclusions: During follow-up, RIFT provides a first surrogate measure for influenza disease activity. A ‘‘switch’’ from positive to negative values may indicate a drop in viral load below a critical threshold, where rebound is no longer expected. QIFT may provide a useful tool for the monitoring of disease burden and viral clearance at the POC.
Citation:Chen X, Pouran Yousef K, Duwe S, Karsch K, Grover S, et al. (2014) Quantitative Influenza Follow-Up Testing (QIFT)—A Novel Biomarker for the Monitoring of Disease Activity at the Point-of-Care. PLoS ONE 9(3): e92500. doi:10.1371/journal.pone.0092500
Editor:Pierre Roques, CEA, France
ReceivedDecember 21, 2013;AcceptedFebruary 21, 2014;PublishedMarch 21, 2014
Copyright:ß2014 Chen et al. This is an open-access article distributed under the terms of the Creative Commons Attribution License, which permits unrestricted use, distribution, and reproduction in any medium, provided the original author and source are credited.
Funding:Charite´ received an unrestricted grant by Hoffmann La Roche Inc. for the analysis of virologic outcomes in hospitalized children with influenza infection. KPY and MvK received funding through the DFG research centre "MATHEON" (project A21: ‘‘Modelling, Simulation and Therapy Optimization for Infectious Diseases’’). The funders had no role in study design, data collection and analysis, decision to publish, or preparation of the manuscript.
Competing Interests:Quidel Inc. kindly provided SOFIATM kits free of charge for the purpose of this evaluation. Hoffmann La Roche Inc., provided funding towards this study. There are no patents, products in development or marketed products to declare. This does not alter the authors’ adherence to all the PLOS ONE policies on sharing data and materials.
* E-mail: Barbara.Rath@gmail.com
Introduction
Influenza may cause significant morbidity and mortality, especially in infants and children [1–3], who tend to exhibit high viral loads and prolonged viral shedding [2,4,5]. In paediatric patients, influenza may also evoke a wide range of nonspecific symptoms, which are often difficult to predict or quantify [4,6]. Much progress has been made with respect to rapid influenza diagnostic testing (RIDT), but standardized assessments for the longitudinal monitoring of influenza infections are currently lacking.
evidence of ongoing viral replication, immuno-compromise or severe illness (i.e. ICU-level care) [8,9]. Considering the possibility of antiviral resistance and viral rebound with premature termina-tion of treatment, simple means of estimating viral clearance in high-risk patients are needed [7,10–13]. Furthermore, clinical trials evaluating newly developed antivirals will require objective parameters to evaluate antiviral efficacy compared to, or in combination with, currently available drugs [12,14].
Molecular methods and viral culture are the most commonly used methods for the assessment of viral shedding in influenza patients [15,16]. These assays usually require considerable laboratory equipment and staff, and test results may take several days to become available to the physician [6,15]. RIDT has been developed for the immediate diagnosis of influenza infections in the acute care setting [16–20]. RIDT are most sensitive with CT values,30 [21]. Second-generation RIDT (such as the SOFIA) use fluorescence-labelled antigens combined with POC readers, providing the advantage of standardized readouts. Evaluations in the US, Asia and Germany revealed improved sensitivities of up to 88% compared to RT-PCR with specificities close to 100% [21– 24]. Rapid antigen tests reflect the actual amount of viral particles in a given sample, and tend to correlate well with viral culture results [22,25]. PCR-based methods on the other hand, include an amplification step and are highly sensitive to the presence of nucleic acid. With the exception of capped m-RNA PCR, standard RT-PCR methods are not as specific for the presence of fully intact and infectious virus particles. An ideal POC test for the longitudinal follow-up of laboratory-confirmed influenza infections should therefore measure disease activity based on a critical amount of infective virus, even at the expense of lower sensitivities compared to PCR. Rapid antigen test may be able to fill this gap. During the process of viral clearance, the loss of antigen-positivity may indicate successful treatment or ‘‘overcom-ing’’ of natural infection, whereas RT-PCR results tend to remain positive for extended periods of time, even beyond resolution of clinical symptoms [7].
We hypothesized thatqualitative (‘‘positive’’/‘‘negative’’) as well as quantitative (‘‘signal over control’’) luminescent readouts from second-generation rapid antigen tests may prove to be useful as an immediate estimate of virus burden and disease activity. We used SOFIA as an example of a simple rapid antigen test that can be performed by nurses or doctors at the bedside.
The present study aims to evaluate the utility of:
i) ‘‘Rapid Influenza Follow-up Testing’’ (RIFT) for the (quali-tative) monitoring of influenza infections over time as well as ii) ‘‘Quantitative Influenza Follow-up Testing’’ (QIFT) as a potential biomarker for the monitoring of influenza disease activity (virus burden) at the POC.
Methods
Ethics Statement
Ethical approval was obtained from the Charite´ Institutional Review Board (EA 24/008/10). Informed consent procedures were waived for enhanced patient monitoring in the context of a quality management (QM) program.
Study design and data collection
This prospective evaluation study was performed in the context of a QM program at the Charite´ Department of Paediatrics in collaboration with the National Reference Centre for Influenza at the Robert Koch Institute (RKI). From October 1, 2011 to April
30, 2013, all patients fulfilling pre-defined criteria for influenza-like illness (fever$38uC and$one respiratory sign or symptom) were assessed consecutively by a specifically trained QM team [7,21]. Cases were included if i) the patient was 0–18 years of age, and ii) influenza infection was confirmed by RT-PCR in the national reference laboratory. Cases were excluded from this analysis in case of: i) simultaneous infection with more than one influenza type or subtype [26], or ii) inability to obtain nasopharyngeal samples.
Follow-up Testing
Members of a specifically trained QM team obtained nasopha-ryngeal samples, with rapid antigen tests (SOFIA) performed at the bedside. Patients with laboratory-confirmed influenza were scheduled for follow-up testing every two to three days, until at least one negative RIFT result was obtained or longer, if indicated. Basic clinical parameters and treatment with neuraminidase inhibitors were recorded. The respective clinician on duty made antiviral treatment decisions independently. With each rapid antigen test, blinded RT-PCR was performed in parallel at the RKI.
RIFT. Fluorescence-based RIFT was performed immediately at the POC and according to the manufacturer’s protocol for the SOFIA Influenza A+B FIA test kit (Quidel Inc., San Diego, CA, USA). With each test, the SOFIA luminescent reader provided print-outs with qualitative test results (influenza A or B positive/ negative), which were recorded and communicated without delay to the patient or parent as well as to the physician on duty.
QIFT. QIFT-values were calculated for each rapid antigen test based on the relationship between the influenza A and B test lines’ fluorescence intensities and the cut-offs for each analyte with the SOFIA test. The resulting signal over control values (SCo) generated by the SOFIA POC reader ranged from 0 to 400. The limit of detection (LOD) with QIFT is 1; values .1 were considered positive.
RT-PCR and Viral Load (VL) Determination. Qualitative and quantitative RT-PCR were performed as described recently [7]. Briefly, nasopharyngeal swabs were washed out in cell culture medium and RNA was extracted either by using the MagAttract Viral RNA 48 Kit (Qiagen), the RTP RNA/DNA Virus Minikit (Invitek), or the MagnaPure 96 DNA and viral NA small volume kit (Roche). After random reverse transcription complementary DNA, primer and probes targeting the M, HA and NA genes were used for detection and further subtyping of influenza [27]. The RT-PCR cycle threshold (CT) values obtained for each influenza positive sample were analysed comparatively with serially diluted plasmid standards. All reactions were performed using the Light Cycler 480 real-time PCR system (Roche). CT values obtained with influenza negative samples were defined as 45 for mathe-matical analyses. The limit of detection for RT-PCR (LODPCR)
depends on the targeting gene and was determined to be 2–15 genome equivalents per reaction (95% detection probability) [27]. Regarding dilution factors due to sample preparation, RNA extraction, cDNA synthesis, and PCR performing, the limit of viral load quantitation (LOQ) was estimated to be 1000 copies/ ml. This value was defined as LODVL, below which the calibration
curve is no longer valid and quantitative values are not reliable. Comparison of virus load assessments based on CT versus quantitative PCR at the National Reference Centre showed a correlation of 0.95 (Spearman, p-value,0.0001; Figure S1). With a high correlation between the two methods of VL assessment in the reference laboratory, it was decided to use CT for the QIFT/ PCR correlation analyses, with the advantage of a lower LODPCR
Data Analysis
Data analysis and reporting were conducted in accordance with the STARD guidelines [28], wherever applicable. The STARD checklist is provided in the Supplementary Materials (Text S1). The STARD was chosen as the most appropriate standard available, even though the reported study pertains to longitudinal follow-up of patients with established diagnoses rather than diagnostic accuracy. The diagnostic accuracy including sensitivi-ties and specificisensitivi-ties of SOFIA RIDT in relation to PCR in the same setting has been published elsewhere [21].
RIFT compared to longitudinal PCR results. All patients with at least one positive RIFT and completed follow-up series were included in the analysis. Qualitative RIFT data for each patient during follow-up were compared to the corresponding CT value in the RT-PCR.
Three key time points were determined for each disease episode:
i) TMV = Time point of maximum viral load/ lowest CT
ii) TLP = Time point of last positive RIFT
iii) TFN = Time point of first negative RIFT.
The respective time points TMV, TLP, and TFNwere plotted
against the respective CT values at TMV, TLP, and TFN.The y-axis
was inserted at the time point where the switch from TLPto TFN
occurred ( = ‘‘Switch Day’’).
RIFT compared to viral culture. Overall rates of agree-ment and kappa scores were calculated (Stata Version 11.2), comparing the time period required for RIFT and viral culture to become negative, respectively.
QIFT and clinical parameters. For correlation analysis between QIFT and clinical presentation, the following clinical parameters were chosen: a) maximum body temperature, b) CRP and c) presence of tachypnea (according to age-adjusted WHO criteria).
Correlation analyses for a) and b) were conducted using the Spearman rank correlation test. For analysis of c), a non-parametric test (Mann Whitney) was used.
QIFT /PCR Correlation Analysis. For QIFT/PCR corre-lation analysis, two correcorre-lation plots were generated:
i) First, all values were included. Any QIFT values,LODQIFT
were set equal to the LODQIFT as the most conservative
estimate. Values = 0 (i.e. virus not detectable by either method) were set to 0.
ii) A second analysis was performed excluding any values ,
LOD.
Correlation analyses between continuous variables were con-ducted using the Spearman rank correlation test.
Categorizing viral load based on QIFT. Binning analyses were performed for the categorization (‘‘binning’’) of median virus load in relation to different QIFT categories (negative, low, moderate, and high QIFT). Continuous variables were compared between different categories (‘‘bins’’) using non-parametric tests (Mann Whitney, Kruskal Wallis).
For comparison between QIFT and CT values, a ‘‘sliding window plot’’ was generated using MATLAB 7.14 (MathWorks Inc., Natick, MA): All simultaneous measurements of QIFT vs. CT were sorted by the respective QIFT in ascending order. Every 30 consecutive QIFT values denote a sliding window.
Estimating viral load kinetics based on QIFT and PCR. Lacking a reference standard for the assessment of viral shedding/antigen clearance over time, overall rates of agreement
and kappa scores were calculated comparing QIFT increase or decrease to PCR increase or decrease over time [29–32]. Each sequence of 2 consecutive samples from the same patient was included in the analysis. A trend in viral load was defined as increase or decrease if rates of change in relation to the previous measurement in the same patient exceeded 10%.
Viral clearance dynamics with and without treatment. Viral clearance dynamics with and without treat-ment were computed for VL (CLVL) and QIFT (CLQIFT). All cases
with at least two positive samples with both VL and QIFT measurements available ( = QIFT population) were included. In patients receiving antivirals, treatment had to be completed and baseline swabs had to be obtained within 24 hours of treatment initiation. Patient-specific CLVLand CLQIFTwere estimated with
calculated quantitative values even below LOD, using the optimization routinelsqcurvefitin MATLAB version 7.10 (Math-Works Inc., Natick, MA) and a weighted least-square criterion to minimize residual error. Details are provided in the Text S2.
Results
Study population
From October 1, 2011 to April 30, 2013, a total number of 2048 disease episodes were assessed and documented prospective-ly; of these, 278 (13.6%) cases were laboratory-confirmed for influenza by PCR. Three cases with dual influenza infection (A/A, A/B and B/B) and two patients unable to provide nasopharyngeal samples were excluded, leaving for analysis 273 cases of laboratory-confirmed influenza with serial swabs available. (Two patients experienced two independent disease episodes due to different influenza viruses, both were included as separate cases in the analysis.)
Case characteristics at the time of enrolment with each disease episode are displayed in Table 1. Among 273 influenza cases ( = total population) 55 were ‘‘late presenters’’, i.e. patients who appeared in the emergency room late in the course of illness, after loss of their antigen-positive status in the RIFT, which usually requires intact viral particles (as opposed to nucleic acid) and higher viral loads compared to PCR. Overall, 178 patients completed the full follow-up program until at least one negative RIFT was obtained (RIFT population), resulting in an overall completion rate of 85%. For QIFT/PCR correlation and binning analyses, all 669 quantitative antigen measurements were includ-ed. A total of 210 cases fulfilled QIFT population criteria (availability of.= 2 positive samples with both, VL and QIFT measurements). Among these, 183 patients were without antiviral therapy, and 27 completed oseltamivir therapy. There was no significant correlation between the decision to use antivirals and either the number of symptoms, the duration of illness, or the presence of underlying conditions (p = 0.595, p = 0.781 and p = 0.797, respectively).
Data Analysis
RIFT results tend to turn negative prior to PCR. The qualitative results obtained with rapid influenza follow-up testing (RIFT) were compared to cycle thresholds with RT-PCR. The key follow-up time points TMV, TLP, and TFN were determined for
each disease episode and plotted against the corresponding CT values, as depicted in Figure 1.
were only 4 instances (2%) where a positive RIFT was not confirmed by PCR, which was attributed to contamination of infant samples with RNAses. No cases of viral rebound were observed. The ‘‘Switch Day’’ from positive to negative RIFT, illustrated by insertion of the y-axis between TLP and TFN,
corresponded to a CT value of 33.
RIFT results correlate well with virus culture
In 118 cases, at least two swabs with viral culture data in addition to RIFT were available, with a ‘‘switch’’ from positive RIFT and/or culture to negative RIFT and/or culture. Time required for RIFT to become negative from a previously positive value was 5.9763.16 days; (range 2; 18).Time required for viral culture to become negative was 5.3162.67 days (range 2; 14).
We observed an overall rate of agreement of 77.97% between the time period required for RIFT to become negative and time period required for viral culture to become negative (kappa = 0.75;
p-value,0.0001). With respect to correlation analysis between time periods, we observed a Spearman’s correlation of 0.803 between the two time periods (p-value,0.0001).
No significant correlation between QIFT values and clinical parameters. QIFT showed no significant correlation or association to the following clinical parameters: a) maximum body temperature (Spearman Rho =20.027, p = 0.667), b) CRP (Spearman Rho =20.087, p = 0.338) and c) presence of tachy-pnea (Mann Whitney, p = 0.154).
QIFT values close to the LOD correlate poorly with PCR. All quantitative measurements obtained during longitudi-nal follow-up amounted to 669 measurements with QIFT and matching CT values. QIFT/PCR correlations are depicted in Figure 2. QIFT showed a significant correlation with CT of 0.69 (Spearman, p-value,0.0001) with QIFT values , LOD set to LOD = 1 as the most conservative estimate. Following the RIFT observations illustrated above, it is expected that during longitu-dinal follow-up (of which all values are included in this plot), RIFT
Table 1.Characteristics of eligible PCR- confirmed influenza cases.
Category Subcategory Total cases Age,2 years Age 2–5 years Age.5 years
(%) (%) (%) (%)
Total N 273 82 96 95
Gender male 152 47 49 56
(55.7) (58.3) (51.0) (58.9)
female 121 35 47 39
(44.3) (42.7) (49.0) (41.1)
Underlying condition pulmonary 26 7 7 12
(9.5) (8.5) (7.3) (12.6)
cardiac 20 4 7 9
(7.3) (4.9) (7.3) (9.5)
endocrine 13 1 4 8
(4.8) (1.2) (4.2) (8.4)
hepatorenal 4 1 0 3
(1.5) (1.2) (0) (3.2)
neurologic 19 3 6 10
(7.0) (3.7) (6.3) (10.5)
immuno- suppression 9 0 2 7
(3.3) (0) (2.1) (7.4)
hematologic 2 1 0 1
(0.7) (1.2) (0) (1.1)
Prematuritya 33 13 13 7
(12.1) (15.9) (13.5) (7.4)
Treatment with Oseltamivir treated 33 16 11 6
(12.1) (19.5) (11.5) (6.3)
untreated 240 66 85 89
(87.9) (80.5) (88.5) (93.7)
Influenza type/ subtype A(H1N1)pdm09 70 27 23 20
(25.6) (32.9) (24.0) (21.1)
A(H3N2) 112 38 47 27
(41.0) (46.3) (49.0) (28.4)
B 91 17 26 48
(33.3) (20.7) (27.1) (50.5)
a
,37 gestation weeks.
will turn negative prior to PCR. Figure 2 illustrates that QIFT values near or below the LODQIFTcorrelated poorly with PCR,
compared to higher QIFT values.
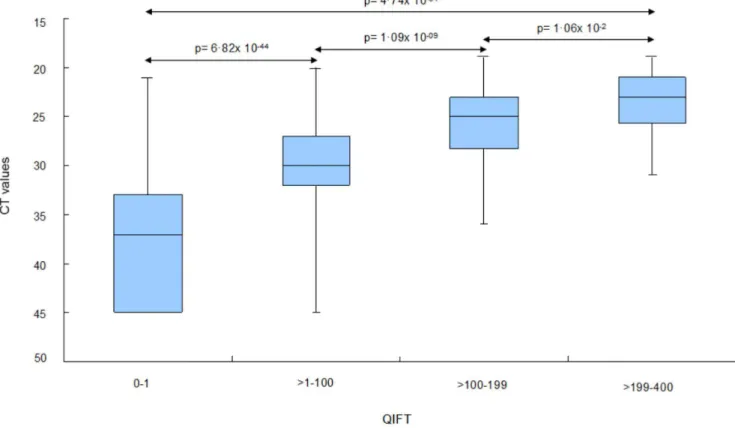
Categorization based on QIFT provides useful estimate of virus burden. For the categorization of virus load based on
low, moderate and high QIFT values, binning analyses were performed: QIFT readings were categorized into the following ‘‘bins’’: ‘‘negative’’ (0–1), ‘‘low’’ (i.e..1–100), ‘‘moderate’’ (.100– 199), and ‘‘high’’ (.199–400). Median CT values differed
Figure 1. Comparison of CT values over time in relation to RIFT.The insertion of y-axis reflects the ‘‘switch’’ from positive to negative RIFT. doi:10.1371/journal.pone.0092500.g001
Figure 2. Comparison of CT versus QIFT.LODQIFTwas defined as QIFT = 1.
significantly with respect to the four QIFT categories (Mann Whitney, Kruskal Wallis, p-value,0.0001), see Figure 3.
A Sliding Window Plot was generated to evaluate the performance of any particular QIFT in predicting CT values (Figure 4). The resulting graph illustrates a percentiles curve for the estimation of CT based on QIFT, including medians for the respective QIFT value. Please note that with 669 samples, there is a relatively broad coefficient of variation of approximately 20%.
Up- and downward trends in virus load are reflected similarly by PCR and QIFT. To determine trends in virus
burden based on quantitative PCR versus QIFT, rates of agreement between ‘‘QIFT-increase’’, ‘‘QIFT-decrease’’, ‘‘VL-increase’’, and ‘‘VL-decrease’’ were calculated. Overall agreement was 88% (kappa = 0.49; p-value,0.0001), see Table 2.
Viral clearance rates in treated and untreated patients may be monitored using QIFT
Median clearance rates CLVL and CLQIFT in QIFT patients
with and without antiviral treatment are depicted in Figure 5. Overall, CLQIFT showed slightly lower, but similar values
compared to CLVL. In treated patients, median clearance rates
were 1.02/day when determined by PCR (CLVL), and 0.56/day
when measured by QIFT (CLQIFT) (Spearman: 0.26; p = 0.1912).
In untreated cases, the median CLVL was 0.97/day and median
CLQIFT was 0.76/day (Spearman: 0.24; p = 0.0013). In patients
receiving antiviral therapy, viral clearance rates based on PCR (CLVL) showed less variability (range 0.08; 2.49) compared to
untreated patients (range24.70; 4.84). The same observation held true with respect to viral clearance rates based on antigen testing
Figure 3. Binning analysis: Estimation of CT, median values based on categorized QIFT readouts.The following QIFT categories were used: ‘‘Negative QIFT’’: 0 to 1 (n = 333). ‘‘Low QIFT’’:.1 to 100 (n = 254). ‘‘Moderate QIFT’’:.100 to 199 (n = 56). ‘‘High QIFT’’:.199 (n = 26). doi:10.1371/journal.pone.0092500.g003
Figure 4. Sliding Window Graph: Binning of median CT values and ranges/percentiles based on median QIFT.
doi:10.1371/journal.pone.0092500.g004
Table 2.Rates of agreement between QIFT and VL increase/ decrease.
QIFTq QIFTQ
VLq 29 31
VLQ 16 320
Rate of Agreement 64% 91% 88%
(CLQIFT) ranging from20.07 to 1.62 and from22.36 to 5.03 in
treatedversusuntreated patients, respectively.
Discussion
Statement of Principal Findings
We report a first prospective study investigating ‘‘loss of antigen positivity’’ as a POC parameter for the longitudinal monitoring of influenza patients. During follow-up, rapid antigen testing using fluorescence-based laminar flow tests (RIFT) may provide a practical surrogate measure for influenza disease activity. ‘‘Loss of antigen positivity’’ in RIFT may indicate a drop in viral load below a critical threshold, where viral rebound is no longer expected. It may also indicate loss of infectivity as reflected by viral culture turning negative simultaneously with RIFT in most cases. Quantitative readouts from the same rapid test (QIFT) show potential as a valuable biomarker for the monitoring of virus burden over time, with the advantage of obtaining results immediately at the POC. QIFT may also be able to discriminate between disease progression (VL increase) and resolution (VL decrease). In patients receiving antiviral therapy, QIFT can be used to monitor treatment success versus failure and/or risk of antiviral drug resistance by estimating viral clearance rates under therapy [7].
Rapid Follow-up Testing in Context
For effective infection control measures and to reduce morbidity and mortality, isolation precautions are imminent. Antiviral treatment when indicated needs to be initiated as timely as possible [9,33]. The need to diagnose treatable conditions with high disease burden has driven the development of diagnostic assays to be used at the POC. In contrast to first-generation RIDT, where sensitivities were still relatively low and user-dependent [34], second-generation RIDT combine improved sensitivities with objective automated read-outs [21,22,24].
Recent fluorescent-based RIDT such as SOFIA issuequalitative (positive/negative) results based on qualitative signal over control measurements. While RIDT have been licensed for the initial diagnosis of influenza at the POC [1,6,17], this pilot study demonstrates that qualitative (RIFT) and quantitative (QIFT) fluorescence-based antigen testing may both be useful for the longitudinal monitoring of influenza infections over time.
Strengths and Limitations of the Study
The retention rate in this study was.85%, which is very high for an observational setting. For the evaluation of rapid influenza testing as a follow-up tool (RIFT) and QIFT-based clearance rates however, a sufficient number of follow-up time points was required. Hence, smaller subsets of patients were included in
Figure 5. Comparison of viral clearance rates for CLVL versus CLQIFT and for treated versus untreated patients.Variance in viral clearance rates for quantitative is smaller in treated than in untreated patients, for both VL and QIFT.
these analyses, representing 65% in RIFT and 80% in QIFT clearance rate calculations.
During longitudinal follow-up, RIFT turned negative consis-tently with, or after the PCR. It has to be borne in mind, that PCR and antigen tests measure different aspects of the same disease. While PCR-based (amplification) methodologies may be sensitive enough to detect even small amounts of nucleic acid over extended periods of time, direct antigen testing may provide an immediate (linear) estimate of virus burden during the acute phase of the disease only. It has been known that RIDT correlate better with viral culture than with PCR. It was therefore expected that the agreement between RIFT and PCR would decline during longitudinal follow-up (until both test are negative), whereas the duration of viral culture positivity may correlate well with antigen positivity [22,25]. It is also to be expected that the lower sensitivity of rapid antigen testing compared to PCR would affect the QIFT/ PCR correlation, especially later during the course of illness, when ‘‘loss of antigen positivity‘‘ has already occurred and RIFT has turned negative ( = QIFT,1). VL measurements from PCR-positive samples below the LODQIFT could however not be
quantified reliably. For utmost transparency, values below the LODQIFT were included in the analyses, but set to equal the
highest possible value ( = LOD) as the most conservative estimate. Reversely, negative QIFT corresponded well with negative PCR results.
QIFT and PCR both rely on the semi-quantitative measure-ment of virus load in nasopharyngeal samples – unlike in the case of HIV and hepatitis VL monitoring, whereplasmavirus loads are followed. To minimize variability with nasopharyngeal sampling, all RIFT/QIFT assays were performed immediately at the POC, and by a specifically trained QM team. Samples were delivered immediately to the RKI for blinded PCR analyses. The value of optimized sampling procedures has been demonstrated in previous evaluations establishing the sensitivity and specificity of the same assay (SOFIA for influenza A and B) in the same QM setting [21]. Use of QIFT and RIFT in less controlled settings may yield different results. Even if sampling has been optimized however, it must be noted that nasopharyngeal samples may not always reflect the virus burden present in the lower respiratory tract in critically ill patients, where VL may be elevated in patients infected with influenza viruses [11,35]. Also, viral shedding in the lower airways is known to be prolonged in adult patients with pneumonia or immuno-compromise. In these patients, relapse of disease can occur if therapy is stopped based on cessation of upper airway replication alone [11]. This however, would require broncho-alveolar lavage procedures, which would neither be ethical nor feasible for the routine follow-up of paediatric influenza patients (unless intubated and critically ill). The present study does not allow for comparison of specific patient subpopulations. Further research in specific risk groups is needed.
Future analyses in specific subpopulations may compare the 3-way relationship between of PCR-positivity, antigen-positivity and viral culture in influenza patients with extreme disease presenta-tions or different levels of immunosuppression.
Future Perspectives
The results of the binning analyses demonstrate the practical value of QIFT for the monitoring of influenza disease activity at the POC. For QIFT to be used in clinical practice in the future, quantitative readings should be issued as four categories: negative, low, moderate, and high virus burden. QIFT as a follow-up tool could be optimized further, if the fluorescent reader provided a standardized display of trends in virus burden in relation to previous measurements in the same patient, or VL estimates as
demonstrated in the binning and sliding window plots. Having immediate estimates of virus burden available at the POC will be of great value to support a personalized approach to the management of infants and immuno-compromised individuals with influenza infection who often exhibit elevated virus titres and prolonged virus shedding [2,4,5]. Previous studies have shown that virus burden cannot be estimated based on clinical appearance alone. It has further been reported that viral shedding may persist beyond cessation of clinical symptoms [4,36]. Objective param-eters such as RIFT and QIFT may facilitate individualized therapy of influenza with estimates of virus burden available immediately at the POC.
The decision whether or not to treat with antivirals in this QM setting, was left up to the clinician in charge. Interestingly, only a small proportion (12.1%) of patients with laboratory–confirmed influenza received neuraminidase inhibitor therapy. For all treated patients oseltamivir was prescribed. In the described setting, zanamivir is restricted to antiviral therapy in ICU patients or patients unable to take p.o. medicine. There was no evidence of correlation between treatment decision and patients’ clinical symptoms, underlying conditions or late appearance to the hospital. With new antivirals under development, it might be of value to pursue QIFT as a follow-up tool in randomized controlled clinical trials.
Current recommendations by health authorities regarding established neuraminidase inhibitor therapies include a standard five-day course of treatment with a possible extension to ten days in cases of ‘‘ongoing viral replication’’ [8,9]. Once antiviral therapy has been terminated, it should not be restarted. This implies that the decision whether to stop or adjust antiviral therapy has to be made on day five, at the POC. Relative under-dosing and/or premature treatment termination harbour the risk of promoting antiviral drug resistance [10,13].
Previous studies have indicated that during antiviral therapy, a less-than-expected slope of decline in VL might indicate resistance development [7]. QIFT shows potential as a simple tool for the real-time monitoring of treatment success at the POC: QIFT-based viral clearance estimates (CLQIFT) showed similar ranges
and percentiles compared to PCR-based VL estimates (CLVL).
CLVL however may be more accurate in lower ranges and with
prolonged treatment. Further analyses in larger cohorts of treated influenza patients may be required to determine the exact relationship between CLQIFTand CLVL. The interesting
observa-tion that antiviral treatment may reduce intra-individual variaobserva-tion in viral clearance rates with both CLQIFT and CLVL warrants
further investigation.
Additional studies may be undertaken to investigate the cost-effectiveness of individualized antiviral therapy as well as the longitudinal monitoring of virus burden in infants, high risk and immuno-compromised individuals. The high retention rate in this QM program indicates that the availability follow-up data at the POC and the immediate feedback and reassurance to concerned patients and families may have a positive impact on patient satisfaction.
Conclusions
young children as well as immuno-compromised patients under antiviral therapy. Future studies in larger cohorts of patients will explore the practical implications of RIFT and QIFT in different clinical and demographic settings.
Supporting Information
Figure S1 Comparison of CT versus VL determined by RT-PCR.LODVL was defined as VL = 1000 copies/ml.
Spear-man Rho = 0.95 (p-value,0.0001). (TIF)
Text S1 STARD checklist. (DOCX)
Text S2 Calculation of viral clearances. (DOC)
Acknowledgments
The data were in part presented at the 29thClinical Virology Symposium in Daytona, Florida, USA in April 2013 as well as at the Options VIII for
the Control of Influenza Conference in Cape Town, South Africa in September 2013. We are grateful to the patients and their parents who participated in the influenza QM program. The authors kindly thank Wiebke Schwarz, Christian Hoppe and Anja Weick, Charite´ Berlin, for their assistance with sample collection, manuscript format/ structure, and data management, as well as Dr. John Tamerius and June Milano of Quidel Inc. for kindly providing the signal/control SOFIA data. The authors also thank Prof. David Katzenstein, Stanford University, for critically reviewing the manuscript. The authors are most grateful to the laboratory team at National Reference Centre for Influenza for timely processing and detailed analyses of patient samples.
Author Contributions
Conceived and designed the experiments: BR BS. Performed the experiments: XC SD KK SW PO FT SM LS BR. Analyzed the data: KPY MVK XC SG SD. Contributed reagents/materials/analysis tools: BR BS MVK. Wrote first draft of the manuscript: XC. Contributed to the writing of the manuscript: KPY SD KK SG SW PO FT SM LS MVK BS BR.
References
1. Poehling KA, Zhu Y, Tang YW, Edwards K (2006) Accuracy and impact of a point-of-care rapid influenza test in young children with respiratory illnesses. Arch Pediatr Adolesc Med 160: 713–718.
2. Nicholson KG, Wood JM, Zambon M (2003) Influenza. Lancet 362: 1733– 1745.
3. Thompson WW, Shay DK, Weintraub E, Brammer L, Bridges CB, et al. (2004) Influenza-associated hospitalizations in the United States. JAMA 292: 1333– 1340.
4. Esposito S, Daleno C, Baldanti F, Scala A, Campanini G, et al. (2011) Viral shedding in children infected by pandemic A/H1N1/2009 influenza virus. Virol J 8: 349.
5. Frank AL, Taber LH, Wells CR, Wells JM, Glezen WP, et al. (1981) Patterns of shedding of myxoviruses and paramyxoviruses in children. J Infect Dis 144: 433– 441.
6. Gavin PJ, Thomson RB Jr (2003) Review of Rapid Diagnostic Tests for Influenza. Clin and Appl Immunol Rev 4: 151–172.
7. Rath B, von Kleist M, Tief F, Karsch K, Tuerk E, et al. (2012) Virus load kinetics and resistance development during oseltamivir treatment in infants and children infected with Influenza A(H1N1) 2009 and Influenza B viruses. Pediatr Infect Dis J 31: 899–905.
8. WHO-EURO (2011) Seasonal influenza: Key issues for case management of severe disease.
9. Fiore AE, Fry A, Shay D, Gubareva L, Bresee JS, et al. (2011) Antiviral agents for the treatment and chemoprophylaxis of influenza --- recommendations of the Advisory Committee on Immunization Practices (ACIP). MMWR Recomm Rep 60: 1–24.
10. Stephenson I, Democratis J, Lackenby A, McNally T, Smith J, et al. (2009) Neuraminidase inhibitor resistance after oseltamivir treatment of acute influenza A and B in children. Clin Infect Dis 48: 389–396.
11. Lee N, Chan PK, Wong CK, Wong KT, Choi KW, et al. (2011) Viral clearance and inflammatory response patterns in adults hospitalized for pandemic 2009 influenza A(H1N1) virus pneumonia. Antivir Ther 16: 237–247.
12. van der Vries E, Schutten M, Fraaij P, Boucher C, Osterhaus A (2013) Influenza virus resistance to antiviral therapy. Adv Pharmacol 67: 217–246.
13. Lee N, Chan PK, Hui DS, Rainer TH, Wong E, et al. (2009) Viral loads and duration of viral shedding in adult patients hospitalized with influenza. J Infect Dis 200: 492–500.
14. Siqueira M, Hay A (2013) Influenza antivirals: efficacy and resistance. Influenza Other Respir Viruses 7 Suppl 1: 1.
15. Pongthanapisith V, Sukasem C, Premchaiporn K, Srichantaratsamee C, Chantratita W (2011) Clinical performance of three rapid diagnostic tests for influenza virus in nasopharyngeal specimens to detect novel swine-origin influenza viruses. Infection 39: 105–111.
16. Grijalva CG, Poehling KA, Edwards KM, Weinberg GA, Staat MA, et al. (2007) Accuracy and interpretation of rapid influenza tests in children. Pediatrics 119: e6–11.
17. Bonner AB, Monroe KW, Talley LI, Klasner AE, Kimberlin DW (2003) Impact of the rapid diagnosis of influenza on physician decision-making and patient management in the pediatric emergency department: results of a randomized, prospective, controlled trial. Pediatrics 112: 363–367.
18. Benito-Fernandez J, Vazquez-Ronco MA, Morteruel-Aizkuren E, Mintegui-Raso S, Sanchez-Etxaniz J, et al. (2006) Impact of rapid viral testing for
influenza A and B viruses on management of febrile infants without signs of focal infection. Pediatr Infect Dis J 25: 1153–1157.
19. Jennings LC, Skopnik H, Burckhardt I, Hribar I, Del Piero L, et al. (2009) Effect of rapid influenza testing on the clinical management of paediatric influenza. Influenza Other Respir Viruses 3: 91–98.
20. Weitzel T, Schnabel E, Dieckmann S, Borner U, Schweiger B (2007) Evaluation of a new point-of-care test for influenza A and B virus in travellers with influenza-like symptoms. Clin Microbiol Infect 13: 665–669.
21. Rath B, Tief F, Obermeier P, Tuerk E, Karsch K, et al. (2012) Early detection of influenza A and B infection in infants and children using conventional and fluorescence-based rapid testing. J Clin Virol 55: 329–333.
22. Lewandrowski K, Tamerius J, Menegus M, Olivo PD, Lollar R, et al. (2013) Detection of influenza A and B viruses with the Sofia analyzer: a novel, rapid immunofluorescence-based in vitro diagnostic device. Am J Clin Pathol 139: 684–689.
23. Leonardi GP, Wilson AM, Zuretti AR (2013) Comparison of conventional lateral-flow assays and a new fluorescent immunoassay to detect influenza viruses. J Virol Methods 189: 379–382.
24. Lee CK, Cho CH, Woo MK, Nyeck AE, Lim CS, et al. (2012) Evaluation of Sofia fluorescent immunoassay analyzer for influenza A/B virus. J Clin Virol 55: 239–243.
25. Cho CH, Woo MK, Kim JY, Cheong S, Lee CK, et al. (2013) Evaluation of five rapid diagnostic kits for influenza A/B virus. J Virol Methods 187: 51–56. 26. Rath B, Chen X, Karsch K, Schwarz W, Seeber L, et al. (2013) Unusual
presentations of influenza A/A and A/B dual infections - the Charite´ Influenza Like Disease ( = ChILD) Cohort; Poster presentation at: XV International Symposium on Respiratory Viral Infections; 2013 Mar 14–16; Rotterdam, The Netherlands.
27. Schulze M, Nitsche A, Schweiger B, Biere B (2010) Diagnostic approach for the differentiation of the pandemic influenza A(H1N1)v virus from recent human influenza viruses by real-time PCR. PLoS One 5: e9966.
28. Bossuyt PM, Reitsma JB, Bruns DE, Gatsonis CA, Glasziou PP, et al. (2003) Towards complete and accurate reporting of studies of diagnostic accuracy: the STARD initiative. BMJ 326: 41–44.
29. Biswas B (2006) Assessing agreement for diagnostic devices. FDA/Industry Statistics Workshop.
30. Pepe MS (2003) The statistical evaluation of medical tests for classification and prediction. Oxford University Press.
31. Fleiss JL (1981) Statistical methods for rates and proportions. Second Edition.. New York: John Wiley & Sons.
32. Dunn G, Everitt B (1995) Clinical biostatistics: an introduction to evidence based medicine. Stat Med 15: 2121–2123.
33. Committee on Infectious Diseases (2013) Recommendations for prevention and control of influenza in children, 2013–2014. Pediatrics 132: e1089–1104. 34. Moore C (2013) Point-of-care tests for infection control: should rapid testing be
in the laboratory or at the front line? J Hosp Infect 85: 1–7.
35. van Riel D, den Bakker MA, Leijten LM, Chutinimitkul S, Munster VJ, et al. (2010) Seasonal and pandemic human influenza viruses attach better to human upper respiratory tract epithelium than avian influenza viruses. Am J Pathol 176: 1614–1618.