Global Diversification at the Harsh Sea-Land Interface:
Mitochondrial Phylogeny of the Supralittoral Isopod
Genus
Tylos
(Tylidae, Oniscidea)
Luis A. Hurtado1*, Eun J. Lee1, Mariana Mateos1, Stefano Taiti2
1Department of Wildlife and Fisheries Sciences, Texas A&M University, College Station, Texas, United States of America,2Istituto per lo Studio degli Ecosistemi, CNR, Florence, Italy
Abstract
The supralittoral environment, at the transition between sea and land, is characterized by harsh conditions for life. Nonetheless, evolution of terrestrial isopods (Oniscidea), the only group of Crustacea fully adapted to live on land, appears to have involved a transitional step within the supralittoral. The two most basal oniscidean lineages (Ligiidae and Tylidae) have representatives that successfully colonized the supralittoral. One of them is the genusTylos, which is found exclusively in supralittoral sandy beaches from tropical and subtropical coasts around the world. Comprehensive phylogenetic hypotheses for this genus are lacking, which are necessary for understanding the evolution and biogeography of a lineage that successfully diversified in the harsh sea-land interface. Herein, we studied the phylogenetic relationships among 17 of the 21 currently recognized species of the genusTylos, based on sequences from four mitochondrial genes (Cytochrome Oxidase I, Cytochrome b, 16S rDNA, and 12S rDNA). Maximum Likelihood and Bayesian phylogenetic analyses identified several lineages with deep divergences and discrete geographic distributions. Phylogenetic and distributional patterns of Tylosprovide important clues on the biogeography and evolution of this group. Large divergences among the most basal clades are consistent with ancient splits. Due to the biological characteristics ofTylos, which likely prevent dispersal of these isopods across vast oceanic scales, we argue that tectonic events rather than trans-oceanic dispersal explain the distribution ofTylos in different continents. Overwater dispersal, however, likely enabled range expansions within some basins, and explains the colonization of volcanic oceanic islands. Present-day distributions were also likely influenced by sea level and climate changes. High levels of allopatric cryptic genetic differentiation are observed in different regions of the world, implying that the dispersal abilities ofTylosisopods are more limited than previously thought. Our results indicate that a taxonomic revision of this group is necessary.
Citation:Hurtado LA, Lee EJ, Mateos M, Taiti S (2014) Global Diversification at the Harsh Sea-Land Interface: Mitochondrial Phylogeny of the Supralittoral Isopod GenusTylos(Tylidae, Oniscidea). PLoS ONE 9(4): e94081. doi:10.1371/journal.pone.0094081
Editor:Richard Cordaux, University of Poitiers, France
ReceivedDecember 12, 2013;AcceptedMarch 11, 2014;PublishedApril 15, 2014
Copyright:ß2014 Hurtado et al. This is an open-access article distributed under the terms of the Creative Commons Attribution License, which permits
unrestricted use, distribution, and reproduction in any medium, provided the original author and source are credited.
Funding:Funding was provided by NSF grant DEB 0743782 to LAH and MM, and by TAMU-CONACyT grants to LAH. The authors would also like to acknowledge the Texas A&M Libraries Open Access to Knowledge (OAK) Fund for covering the publication fee of this article. The funders had no role in study design, data collection and analysis, decision to publish, or preparation of the manuscript.
Competing Interests:The authors have declared that no competing interests exist. * E-mail: [email protected]
Introduction
The supralittoral, at the transition between sea and land, comprises a very narrow vertical stretch of the shoreline characterized by harsh conditions for life, such as regular exposure to extreme temperatures, wind, wave splash, storm surge, rapid and extreme changes in salinity (e.g. high salinity due to evaporation during low tide and low salinity due to fresh water input from rain), and predation by terrestrial animals and seabirds [1]. Adaptation to completing the life cycle within this harsh environment is considered a crucial step in the evolution of Oniscidea [2], a speciose group of isopods (ca. 3700 species) that has colonized almost every terrestrial habitat [3], representing the only group of Crustacea fully adapted to live on land. Isopod colonization of land from the sea appears to have involved a transitional step within the supralittoral. The two most basal oniscidean lineages, Ligiidae and Tylidae [4,5], successfully colonized the supralittoral. Within Ligiidae, the genus Ligia
Fabricius, 1798 occurs in rocky supralittoral habitats around the
world, with only a few species adapted to live inland. Evolution of terrestrial oniscideans from ancestral marine isopods is proposed to have proceeded from aLigia-like ancestor [2]. Within Tylidae, the genus Tylos Audouin, 1826 is comprised entirely of supralittoral species distributed mainly in tropical and subtropical sandy beaches throughout the world [6,7]. Regional phylogeo-graphical studies of members ofLigiaandTyloshave revealed high levels of isolation and phylogeographic structure at small geographic scales, consistent with biological characteristics that confer limited vagility to these isopods [8–10]. The lack of comprehensive phylogenetic hypotheses for these two genera, however, hampers our understanding on the evolution of two groups that successfully diversified in the vast, yet harsh, sea-land interface.
Isopods of the genusTylosoccur in the upper intertidal on sand, mud, in cracks and crevices, and under algal detritus or rocks [6].
Tylos currently contains 21 accepted species, with many more originally described, but subsequently synonymized [11,12]. Many specimens from different regions in the world were incorrectly
assigned to T. latreillii Audouin, 1826, which was originally described from an unspecified location in Egypt [13], but currently considered a nomen dubium [14]. This taxonomic confusion has likely contributed to the misconception that members ofTylosare highly vagile (e.g. [15]), a notion that is at odds with their biological characteristics, which suggest very restricted dispersal potential. As all peracarids,Tylosisopods lack a planktonic larval stage (i.e., they are direct developers). In addition, adults actively avoid entering the water, where they are unable to survive submerged beyond a few hours, and have extremely limited swimming abilities [6,7]. Juveniles of some species, however, may be able to surf by rolling themselves into a ball, potentially facilitating dispersal among nearby beaches [7,15]. Consistent with their biological characteristics, high levels of population genetic differentiation have been observed at small geographic scales in members ofTylos, implying that surrounding unsuitable habitats constitute effective dispersal barriers and that the potential for population isolation is high [9]. Furthermore, factors that can dramatically modify the distribution of coastline habitats, such as tectonic activity and eustatic sea level fluctuations, as well as climate change, appear to strongly influence the evolutionary histories of these isopods [9].
Herein, we inferred a mitochondrial phylogeny of the genus
Tylos, by examination of 17 of the 21 currently recognized species. The results provide insights into the evolutionary history and biogeography of a group that successfully diversified within the harsh sea-land interface. This represents, to our knowledge, the first study to examine the relationships of a supralittoral endemic taxon at a global scale.
Methods
2.1 Sampling and Molecular Methods
We obtained tissue samples from 16 of the 21 currently recognized species ofTylos(Fig. 1) and used published sequences from one additional valid species from California, T. punctatus
Holmes & Gay, 1909, and its close relatives, with which it formsT. punctatussensu lato from California to the western coast of Mexico [9]. Most of the samples were obtained from the Museo di Storia Naturale ‘‘La Specola’’, Zoological section, in Florence, Italy (MZUF); other researchers and museums kindly provided the remaining samples (Table S1). The sample from Puerto Rico, for which no specific permissions were required, was collected by LAH. None of the fieldwork involved endangered or protected species. Photographs of the ventral plates of the fifth pleonite, regarded as a species-diagnostic character inTylos, are shown for most of the lineages examined in Figure S1 (photographs for additional lineages ofT. punctatussensu lato can be found in [9]). We used a sample ofHelleria brevicornisEbner, 1868 as outgroup in a subset of the phylogenetic analyses. The monotypic Helleria, endemic to the northern Tyrrhenian area, is the only other genus of the family Tylidae. Genomic DNA was isolated from 2–4 legs per specimen with the DNeasy kit (Qiagen, Inc., Valencia, CA). We PCR-amplified segments of four mitochondrial genes: 16S rDNA; 12S rDNA; Cytochrome Oxidase Subunit I (COI); and Cytochrome b (Cytb); primer sequences and amplification conditions are provided in Table S2. PCR-amplified products were cleaned with Exonuclease and Shrimp Alkaline Phosphatase, and subsequently cycle sequenced at the University of Arizona Genetics Core. We used Sequencher 4.8 (Gene Codes, Ann Arbor, MI) for sequence editing and primer removal. None of the protein-coding sequences had premature stop codons or frame shifts, suggesting that they are not pseudogenes. All sequences were
deposited in GenBank (Accession Numbers KJ468109– KJ468188).
2.2 Sequence Alignment
Non-protein-coding sequences were aligned with MAFFT v.6.0 [16], as implemented in http://mafft.cbrc.jp/alignment/server/ (Accessed 2014 Feb 4), with the Q-INS-I strategy, which considers secondary structure of RNA, and with the L-INS-i strategy with default parameters (e.g. Gap Opening penalty = 1.53). Resulting alignments were edited manually within MacClade v.4.06 [17]. Regions for which homology could not be confidently established were identified with GBlocks v.0.91b [18], and excluded from the phylogenetic analyses. The following GBlocks parameters were used: ‘‘Allowed Gap Positions’’ = half; ‘‘Minimum Length Of A Block’’ = 5 or 10; and ‘‘Maximum Number Of Contiguous Nonconserved Positions’’ = 4 or 8. Alignments showing included and excluded positions are available in Datasets S1 & S2. Dataset S1 includedHelleria brevicornisas the outgroup. High divergences betweenH. brevicornisandTylos, however, rendered many positions in the two ribosomal genes unusable (Table 1). To increase the number of usable positions at the two ribosomal genes and reduce noise due to substitution saturation, we subsequently generated a dataset (Dataset S2) in whichH. brevicorniswas removed, and the above MAFFT and GBlocks procedures were repeated (see details about rooting of this dataset in the Results section).
2.3 Phylogenetic Analyses
Phylogenetic analyses were conducted with the sequences of the four loci concatenated into a single dataset. We used jModeltest v0.1.1 [19] to determine the most appropriate model of DNA substitution among 88 candidate models on a fixed BioNJ-JC tree, under the Akaike Information Criterion (AIC), corrected AIC(c), and Bayesian Information Criterion (BIC) (Tables 1 & 2). We used the closest more complex model (based on the BIC) available in the corresponding Maximum Likelihood (ML) and Bayesian analyses (see Tables S3 & 3), except that when a proportion of invariable sites (I) and a Gamma distribution of rates among sites (G) was selected according to jModeltest, we excluded parameter I to avoid problems related to dependency between both parameters (see RaxML manual and [20]). In addition, to assess robustness of the results to substitution model, we also used the complex model GTR+G. The following two data partitioning schemes were implemented: (a) all positions within a single partition; and (b) the best partitioning scheme according to the BIC implemented in PartitionFinder v.1.0 [21]. The following parameters were used in PartitionFinder: branch lengths = linked; models = mrbayes; model selection = BIC; search = greedy; and a priori partitioning by a combination of each gene and codon position.
For the ML analyses, three approaches were employed: (a) RaxML v.8.0.7 (‘‘GTRGAMMA’’ model; standard bootstrap search) [22]; (b) GARLI v.2.0.1 [23] implemented in the CIPRES server [24], which uses genetic algorithms for the ML search; and (c) PhyML v.3.1 (search = SPR & NNI) [25]. Clade support within ML analyses was examined by: (a) the approximate Likelihood Ratio (aLRT) test using the Shimodaira-Hasegawa (SH-like) procedure, as implemented in PhyML; and (b) non-parametric bootstrap analyses (100–1000 replicates) in all three ML programs, and summarized with 50% majority rule consensus trees computed by the SumTrees script (v.3.3.1) implemented in DendroPy v.3.10.1 [26].
applied two of the proposed strategies to alleviate such biases: the polytomy prior [33] as implemented in Phycas v.1.2.0 [34]; and a Gamma prior on the tree length as implemented in MrBayes v.3.2.2 [35]. The following criteria were used to evaluate convergence and adequate sampling of the posterior distribution: (a) Stable posterior probability values; (b) a high correlation between the split frequencies of independent runs as implemented in AWTY [36]; (c) small and stable average standard deviation of the split frequencies of independent runs; (d) Potential Scale Reduction Factor close to 1; and (e) an Effective Sample Size (ESS) .200 for the posterior probabilities and parameters, as evaluated in Tracer v.1.5 [37]. Tree samples prior to reaching a stationary posterior distribution were discarded (i.e., ‘‘burnin’’), and the remaining samples were used to generate majority rule consensus trees with SumTrees (note: the tree summary function of Phycas was not used, as it returned incorrect clade posterior probabilities). Pairwise genetic distances with Kimura-2-parameter (K2P) cor-rection were estimated with PAUPv.4.0b10 [38] for the four concatenated mitochondrial genes (Dataset S1) and for the COI gene separately; missing/ambiguous positions were removed for each pairwise sequence comparison.
Results
The concatenated dataset of four mitochondrial genes (MT) includingH. brevicornis(Dataset S1) retained 1243 characters (570 were parsimony informative), after removal of positions that could not be confidently aligned (Table 1). In contrast, Dataset S2 (excluding H. brevicornis) retained 1575 characters (801 were parsimony informative; Table 2). All Bayesian analyses achieved convergence and an adequate sample of the posterior distribution on the basis of the criteria outlined in the Methods section. Figure 2 depicts the inferred phylogenetic relationships among the Tylos
species examined (the main lineages in theT. punctatuss. l clade are shown collapsed, as their relationships are addressed in detail by Hurtado et al. [9]), with ranges of clade support from the different methods and substitution models. Hereafter, Bootstrap
propor-tions and aLRT probabilities are referred to as ‘‘BS’’, whereas Posterior Probabilities are referred to as ‘‘PP’’ (clade support values for each method and substitution model are provided in Tables S3 & 3, respectively for Datasets S1 & S2). In general, the use of different substitution models or priors had little effect on clade support values, but some discrepancies were observed between ML and Bayesian analyses (Fig. 2 and Tables S3 and 3). A most basal split within the genus is observed between a clade (clade A: 99–100 BS; 100 PP; purple in Figs. 1 & 2) that contains the two species from Chile (i.e.,T. spinulosusDana, 1853 andT. chilensisSchultz, 1983), and a clade (B; Fig. 2) comprised of the remaining species (73–87 BS; 99–100 PP; based on Dataset S1). Kimura-2-parameter divergences between clade A and clade B ranged between 21 and 43% for the four genes combined, and between 20 and 32% for the COI gene alone (Tables S4 & S5, respectively). Within clade B, a most basal divergence was observed between T. wegeneri Vandel, 1952 (sample from the Pacific coast of Costa Rica; yellow), and a clade (C: 92–100 BS and 100 PP with Dataset S1; 99–100 BS and 100 PP with Dataset S2) that contained the remaining lineages. Hereafter, unless otherwise noted, clade support is described only for Dataset S2, which assumed the monophyly of clade C (i.e., T. chilensis, T. spinulosus, andT. wegeneriwere used as the outgroup). Clade C was comprised of two main lineages: clade D (blue; 75–89 BS; 97–99 PP) distributed in the West Pacific and Indian Ocean; and clade G (64–97 BS; 100 PP). Within clade D, a basal polytomy of three lineages was observed: T. albidus Budde-Lund, 1885 (Indian Ocean);T. neozelanicusChilton, 1901 (West Pacific); and clade E (86–95 BS; 100 PP; West Pacific), which was in turn comprised of
T. granuliferusBudde-Lund, 1885,T. opercularisBudde-Lund, 1885 (clade F; one lineage from Australia and one from Indonesia), and
T. minorDollfus, 1893.
Clade G was comprised of three main clades (H, I, and N) joined at a basal polytomy. Clade H (green), which is comprised of two species from the Arabian Peninsula (T. exiguusStebbing, 1910 from Socotra Island, Indian Ocean, and T. maindroni Giordani Soika, 1954 from Kuwait, Persian Gulf), received,50% support Figure 1. Sampling localities, approximate distribution ranges of clades, and inferred relationships.Major clades and their approximate distribution ranges are distinguished by different colors (see Results and Fig. 2). Phylogenetic relationships based on Fig. 2. Numbers correspond to sample IDs shown in Fig. 2 and Table S1.
doi:10.1371/journal.pone.0094081.g001
Mitochondrial Phylogeny the Isopod GenusTylos
Table 1.Description of characters and selected substitution models for Dataset S1.
Gene Samples Total charactersa Excluded charactersb Included characters Parsimonyinformative AICc (weight) AIC (weight) BIC (weight)
16S rDNA 73 498 324 174 79 K80+G (1.00) HKY+I+G (0.26) HKY+I+G (0.70)
12S rDNA 63 524 351 173 97 K80+G (0.99) TIM2+G (0.23) TrN+G (0.38)
Cytb 68 296 0 296 161 HKY+I+G (0.51) TIM2+I+G
(0.34)
TrN+I+G (0.35)
COI 67 600 0 600 233 HKY+I+G (0.36) TPM2uf+I+G (0.23) HKY+I+G (0.75)
MT 73c 1918 675 1243 570 TrN+I+G (0.30) TrN+I+G (0.28) HKY+I+G (0.77)
Number of characters per gene region that were excluded from and included in the phylogenetic analyses. The number of parsimony informative characters is based on included characters only. Best model selected by jModelTest according to each criterion (AIC, AICc, BIC) and its corresponding weight.
aTotal number of characters in the alignment, including gaps.
bCriteria for character exclusion are described in a nexus file in the supporting information.
cThe number of samples was selected for the combined analyses of mitochondrial genes, including missing genes ofTylosspecies.
MT = concatenated dataset of four mitochondrial genes. doi:10.1371/journal.pone.0094081.t001
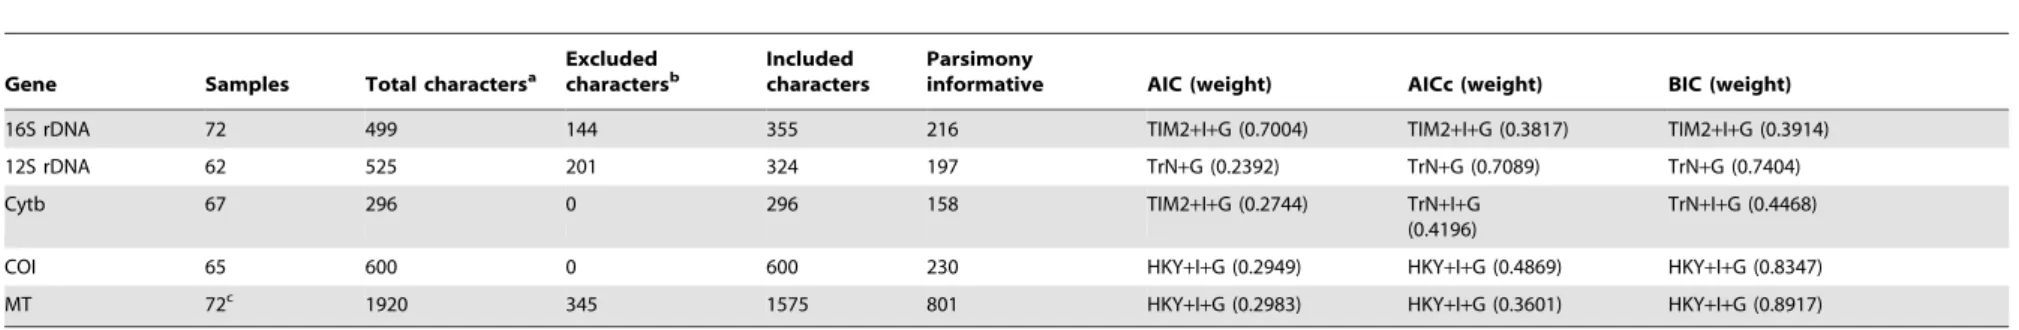
Table 2.Description of characters and selected substitution models for Dataset S2 (excludingH. brevicornis).
Gene Samples Total charactersa
Excluded charactersb
Included characters
Parsimony
informative AIC (weight) AICc (weight) BIC (weight)
16S rDNA 72 499 144 355 216 TIM2+I+G (0.7004) TIM2+I+G (0.3817) TIM2+I+G (0.3914)
12S rDNA 62 525 201 324 197 TrN+G (0.2392) TrN+G (0.7089) TrN+G (0.7404)
Cytb 67 296 0 296 158 TIM2+I+G (0.2744) TrN+I+G
(0.4196)
TrN+I+G (0.4468)
COI 65 600 0 600 230 HKY+I+G (0.2949) HKY+I+G (0.4869) HKY+I+G (0.8347)
MT 72c 1920 345 1575 801 HKY+I+G (0.2983) HKY+I+G (0.3601) HKY+I+G (0.8917)
Number of characters per gene region that were excluded from and included in the phylogenetic analyses. The number of parsimony informative characters is based on included characters only. Best model selected by jModelTest according to each criterion (AIC, AICc, BIC) and its corresponding weight.
aTotal number of characters in the alignment, including gaps.
bCriteria for character exclusion are described in a nexus file in the supporting information.
cThe number of samples was selected for the combined analyses of mitochondrial genes, including missing genes ofTylosspecies.
MT = concatenated dataset of four mitochondrial genes. doi:10.1371/journal.pone.0094081.t002
Mitochon
drial
Phylogen
y
the
Isopod
Genus
Tylos
PLOS
ONE
|
www.ploson
e.org
4
April
2014
|
Volume
9
|
Issue
4
|
with Dataset S1 (not shown), variable support with Dataset S2 (52– 80 BS; 95–100 PP), and higher support (92–97 BS; 100 PP) with a third dataset, which was identical to Dataset S2 except that the three most basal species ofTylos(i.e.,T. chilensis,T. spinulosus, and
T. wegeneri) were excluded, and rooting was performed at the branch joining clades D and G. This last dataset did not result in an increased number of usable positions, but likely reduced noise, stemming from the high divergence ofT. chilensis,T. spinulosus, and
T. wegeneri. Clade I (magenta; 95–99 BS; 100 PP) was comprised of a highly supported (100 BS and PP) Mediterranean Sea lineage
(clade J; made up ofT. ponticusGrebnitzky, 1874 andT. europaeus
Arcangeli, 1938) and of a South African clade (M: 96–100 BS; 100 PP; made up ofT. capensisKrauss, 1843 andT. granulatusKrauss, 1843). Clade N (orange; 84–97 BS; 100 PP) was comprised of lineages from the Caribbean (i.e., T. marcuzzi Giordani Soika, 1954,T. niveus Budde-Lund, 1885, and T. sp.from Yaguanabo, Cuba), and the southern California/Pacific Mexico region. Within clade N,T. marcuzziiwas sister to the remaining lineages (clade O: 98–100 BS and 100 PP). Within clade O,T. punctatussensu lato formed a monophyletic group (clade P: 79–96 BS; 100 PP), whose Figure 2. RaxML bootstrap majority rule consensus tree of the genusTylos.Clades with,66% support were collapsed. Based on regular bootstrap partitioned analysis (based on PartitionFinder BIC) of Dataset S2 (excludingHelleria brevicornis, which was re-drawn manually). Clade colors correspond to clades in Fig. 1. Numbers by nodes indicate the corresponding range of Bootstrap Support and aLRT probabilities (BS; top) for Maximum likelihood (RaxML, Garli, and PhyML); and Posterior Probabilities (PP; bottom) for Bayesian inference methods (MrBayes and Phycas), including all partitioning schemes. * denotes nodes that received 100% support for all methods.1Clade support values based on Dataset S1 analyses
(see Table S3).2Clade support values based on analyses of dataset excludingH. brevicornis,T. chilensis,T. spinulosus, andT. wegeneri(see text for
details). All other support values are based on Dataset S2 (see Table 3). doi:10.1371/journal.pone.0094081.g002
Mitochondrial Phylogeny the Isopod GenusTylos
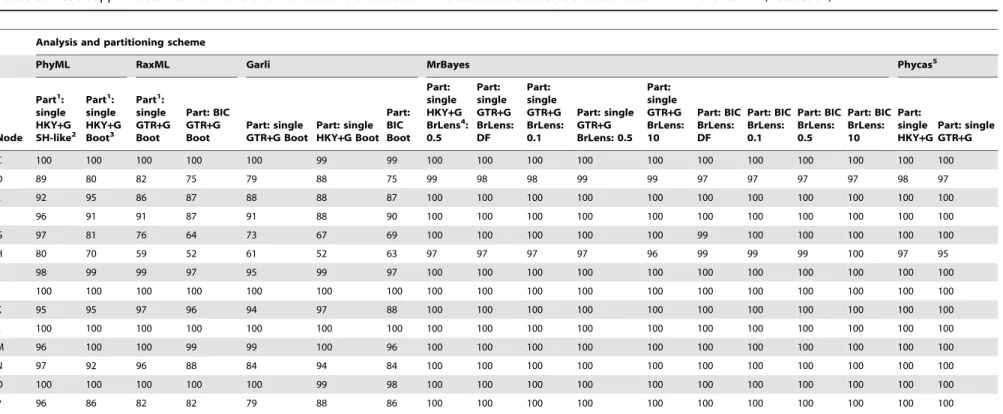
Table 3.Node support obtained from different methods and substitution models with the dataset that excludedHelleria brevicornis(Dataset S2).
Analysis and partitioning scheme
PhyML RaxML Garli MrBayes Phycas5
Node Part1: single HKY+G SH-like2
Part1: single HKY+G Boot3
Part1: single GTR+G Boot
Part: BIC GTR+G Boot
Part: single GTR+G Boot
Part: single HKY+G Boot
Part: BIC Boot
Part: single HKY+G BrLens4: 0.5
Part: single GTR+G BrLens: DF
Part: single GTR+G BrLens: 0.1
Part: single GTR+G BrLens: 0.5
Part: single GTR+G BrLens: 10
Part: BIC BrLens: DF
Part: BIC BrLens: 0.1
Part: BIC BrLens: 0.5
Part: BIC BrLens: 10
Part: single HKY+G
Part: single GTR+G
C 100 100 100 100 100 99 99 100 100 100 100 100 100 100 100 100 100 100
D 89 80 82 75 79 88 75 99 98 98 99 99 97 97 97 97 98 97
E 92 95 86 87 88 88 87 100 100 100 100 100 100 100 100 100 100 100
F 96 91 91 87 91 88 90 100 100 100 100 100 100 100 100 100 100 100
G 97 81 76 64 73 67 69 100 100 100 100 100 99 100 100 100 100 100
H 80 70 59 52 61 52 63 97 97 97 97 96 99 99 99 100 97 95
I 98 99 99 97 95 99 97 100 100 100 100 100 100 100 100 100 100 100
J 100 100 100 100 100 100 100 100 100 100 100 100 100 100 100 100 100 100
K 95 95 97 96 94 97 88 100 100 100 100 100 100 100 100 100 100 100
L 100 100 100 100 100 100 100 100 100 100 100 100 100 100 100 100 100 100
M 96 100 100 99 99 100 96 100 100 100 100 100 100 100 100 100 100 100
N 97 92 96 88 84 94 84 100 100 100 100 100 100 100 100 100 100 100
O 100 100 100 100 100 99 98 100 100 100 100 100 100 100 100 100 100 100
P 96 86 82 82 79 88 86 100 100 100 100 100 100 100 100 100 100 100
Tree was rooted at node C (i.e., ougroup =T. spinulosus,T. chilensis, andT. wegeneri). Percent bootstrap support for Maximum Likelihood (PhyML, RaxML and Garli), SH-like-aLRT probability (PhyML only), and percent posterior probability for Bayesian analyses (MrBayes and Phycas).
1Part. = Partitioning Scheme (single = one partition; BIC = Best partitioning scheme according to PartitionFinder Bayesian Information Criterion). BIC = 12S rDNA+16S rDNA (GTR+G); Cytb codon 1 (K80+G); Cytb codon 2+COI
codon 2 (HKY+G); Cytb codon 3+COI codon 3 (HKY+G); COI codon 1 (SYM+G).
2Boot = Bootstrap search.
3SH-like = approximate Likelihood Ratio Test (aLRT) for branch lengths with the Shimodaria-Hasegawa-like procedure. 4BrLens = Branch length Priors used in MrBayes v.3.2.2. DF = default. 0.1; 0.5; and 10 refer to the prior value assigned tob
Tunder the Gamma prior on tree length (aT,a, andc,were assigned a value of 1 in all cases; e.g. command
‘‘prset brlenspr = unconstrained:gammadir (1,0.1,1,1)’’, where gammadir (aT,bT,a,c). 5A polytomy prior was assumed in Phycas analyses.
doi:10.1371/journal.pone.0094081.t003
Mitochon
drial
Phylogen
y
the
Isopod
Genus
Tylos
PLOS
ONE
|
www.ploson
e.org
6
April
2014
|
Volume
9
|
Issue
4
|
closest relatives, T. niveus and/or T. sp. (Yaguanabo), are distributed in the Caribbean.
Discussion
Our results provide insights into the evolutionary history of the genusTylos, a lineage that successfully colonized and diversified within the harsh sea-land interface at a global scale. Although we acknowledge that phylogenetic inferences based on multiple unlinked markers are desirable (reviewed in [39]), we were unable to obtain nuclear gene sequences despite numerous attempts, likely due to DNA degradation in relatively old samples. Nonetheless, given that phylogenetic relationships among species ofTyloshave not been studied before, the inferred mitochondrial phylogeny currently represents the most plausible phylogenetic hypothesis for this genus. Our results reveal the presence of highly divergent clades that, in general, group according to geography (Figs. 1 & 2). Relationships among the major clades and their approximate distributions based on morphological records are shown depicted with colors in Fig. 1. Below we discuss phylogenetic and distributional patterns of Tylos, which provide important clues on the biogeography and evolution of this group.
The two species from Chile,T. chilensisandT. spinulosus, formed a well-supported monophyletic group (clade A). Divergence of this lineage represents the most basal split withinTylos, suggesting a long history of presence and isolation in the southern East Pacific. The divergence of theT. wegenerilineage, which is also found in the East Pacific region, represents the second most basal split, also implying a long history of isolation. This species, however, was originally described from Venezuela [40], and has also been reported in Tobago and Saint Martin, in the Caribbean, and in the Atlantic coast of Florida [11]; whereas in the Pacific, it has only been reported in Costa Rica. Caribbean-Atlantic specimens assigned to
T. wegenerimust be examined to establish whether they are closely related to our T. wegeneri sample. If so, the Pacific/Caribbean-Atlantic distribution of this lineage must have been achieved prior to the closure of the Panama Isthmus. Within the supralittoral isopod genusLigia, a genetically distinct and diverse clade (representing what a appears to be complex of cryptic species currently assigned to
Ligia baudiniana Milne-Edwards, 1840), also occupies both, the Caribbean/Atlantic and Pacific coasts of this region, but lineages from the Pacific are highly divergent from those in the Caribbean/ Atlantic [41]. A similar pattern is possible forT. wegeneri.
The remaining species ofTylos examined are grouped within clade C. Lineages D, H, I and N, which make up clade C, are highly divergent from each other (15–41% at the four genes combined; Table S4), and occupy broad and distinct geographic regions. Clade D, which appears to be the most basal of these lineages, has a West Pacific/Indian Ocean distribution and high within-clade divergences (up to 36% at the four genes; Table S4). In the West Pacific,T. opercularisis reported from the Philippines, Papua New Guinea, Sulawesi, and the eastern coast of Australia.
Tylos granuliferusis reported in Japan, Korea and Eastern Russia (Vladivostok and southernmost Kuril Islands), whereas T. neozelanicusis reported in New Zealand. In the Indian Ocean,T. minor is reported in east Africa along the coasts of southern Somalia and Kenya, as well as in the islands of Madagascar, Seychelles, Aldabra, and Comoro; whereasT. albidusis reported in islands farther east (i.e., Nicobar, Maldives, and Sri Lanka) [11]. Given the geographic distribution of clade D, it is likely that T. australis Lewis & Bishop, 1990 (from southeastern Australia), T. nudulusBudde-Lund, 1906 (from Christmas Island, south of Java), and T. tantabiddyi Lewis, 1991 (from Western Australia), which were not included in this study, belong to this clade.
Our analyses failed to resolve the relationships among clades H, I, and N, resulting in a basal polytomy within clade G. Clade H, which was supported by a subset of the analyses, containedT. exiguusandT. maindroni, two species that are highly divergent from each other (22% at COI; Table S5). Both are distributed in the Arabian Peninsula, the largest peninsula in the world, but on opposite sides: T. exiguus is reported in the Red Sea coasts and Socotra Island (locality 17; Fig. 1); whereasT. maindrioniis reported in the Persian Gulf, on the eastern side of the peninsula [11]. The earliest date at which theT. exiguuslineage could have colonized the Red Sea and Gulf of Aden region is ,25 Ma; when these basins are hypothesized to have formed [42]. Clade I, the second lineage within clade G, is distributed in: (a) southern Africa (T. granulatusis reported from northern Namibia to Cape Town, South Africa; whereasT. capensis is reported from Cape Town to Port Elizabeth, South Africa); (b) northwestern Africa as far south as Dakar, Senegal (T. ponticus) [11], (c) the Atlantic Ocean islands of Azores (T. europaeus), Madeira (T. ponticus), and the Canary Islands (T. ponticus); (d) the Atlantic coast of Europe, as far north as Bretagne, France (T. europaeus); and (e) the Mediterranean and Black seas (T. europaeusandT. ponticus). Given the above patterns, it is likely that T. madeirae Arcangeli, 1938 (from Madeira Island; [11]), not included in our study, belongs to clade I. Clade N, the third lineage within clade G, is reported from Florida, Bahamas, and the Caribbean (T. marcuzzii and T. niveus), as well as from Bermuda (T. niveus), Brazil (T. niveus), and the northeastern Pacific (T. punctatuss.l.), in the region between southern California and Central Mexico, including the Gulf of California [9,11].
The phylogeographic patterns of members ofTyloscould have been shaped by several processes: break-up of land masses leading to vicariance; overwater dispersal (particularly over relatively short distances, given the biology of this isopod); range expansions and contractions associated with eustatic sea level and climate changes; and ecological speciation and/or niche partitioning. Unfortunate-ly, our interpretation of evolutionary patterns is somewhat constrained by the lack of reliable molecular clock calibration points (fossils or vicariant events), or substitution rates that would enable inference of meaningful estimates of divergence times amongTyloslineages. Although large divergences among the most basal clades suggest ancient splits, their timing is uncertain. Several lines of evidence are consistent with an ancient origin for the genus
Tylos. Tylidae (and Ligiidae) occupy the most basal positions within Oniscidea [4,5], a suborder whose origin is estimated around the Paleozoic (,300 Ma) [43]. Although fossils of Tylos have not been recovered, fossils assigned to Ligia are dated at ,110 Ma, whereas the earliest oniscidean fossils exhibiting morphological characteristics of extant woodlice (which are more derived than Tylidae and Ligiidae), are dated at,30 Ma, in the late Eocene [43]. In addition, the cosmopolitan distribution of
Tyloshas been regarded as an indication of an ancient origin [44]. The biology of Tylos (i.e., lack of a planktonic larval stage, extremely limited swimming abilities, and inability to survive under water beyond a few hours) may have prevented dispersal across vast oceanic scales. Therefore, we consider that tectonic events such as the breakup of Gondwana, rather than trans-oceanic dispersal, explain the presence of Tylos on different continents. Although the sequence and timing of events are controversial, the breakup of Gondwana is dated at,160–80 Ma (million years ago) [45]. These events could have led to the divergence of clades D (Indian Ocean/West Pacific), I (Eastern Atlantic: Mediterranean and Africa coasts), and N (Caribbean and Northeastern Pacific). Accordingly, the split that led to clade A (T. chilensis+ T. spinulosus), as well as the split that led toT. wegeneri, may predate the breakup of Gondwana.
Mitochondrial Phylogeny the Isopod GenusTylos
Overwater dispersal, however, likely played a role in the colonization of certain localities of the West Pacific/Indian Ocean, facilitated by the geographic proximity among some islands and between some mainland and island localities. Similarly, overwater dispersal may have occurred in the eastern Atlantic (see below), between the Caribbean and the northeastern Pacific, and within the Caribbean (although proto-Antillean vicariance [46] or a hypothesized temporary land bridge,33–35 Ma [47], represent alternative hypotheses for colonization of Caribbean islands). Recent overwater dispersal probably explains the presence of T. niveusin Bermuda, a highly isolated volcanic island north of the Caribbean, which appears to have been submerged at several instances during the Pleistocene [48,49]. In addition to Tylos, a member of Ligia is also reported in Bermuda; both of these semiterrestrial taxa likely arrived to this island via rafting [50]. The phylogenetic affinities of Tylos populations found in Bermuda, however, need to be examined to identify their possible origin.
The timing of the divergence between the southern Africa and Mediterranean clades is also uncertain (19.7–24.7% divergence at COI; Table S5). Colonization of the Mediterranean, however, probably occurred after the Messinian Salinity Crisis (,6– 5.3 Ma), a period during which the Mediterranean basin was either completely dry or hypersaline [51]; conditions that would likely have precluded the presence ofTylos. It is unclear whether the split between T. ponticus and T. europaeus (17–20% at COI; Table S5) occurred before or after the Messinian Salinity Crisis. These two species have different ecologies, which may enable their coexistence in the same regions, but not in the same microhabitat:
T. europaeusoccurs in fine grain sandy beaches, whereasT. ponticus
inhabits coarse sand or pebble beaches [44]. It is therefore possible that their divergence was associated with ecological speciation.
Tylos europaeus appears to be competitively excluded from very coarse-grained beaches, whereasT. ponticuscan tolerate a broader range of sediment grain sizes [52]. Overwater dispersal likely explains the distribution of these species in the volcanic islands of Azores and Madeira, but the phylogenetic affinities of these populations have not been determined.
Tylos lineages found in the Pacific coast between southern California and Central Mexico, including the Gulf of California, have a close relationship with lineages from the Caribbean. The closest relatives of these northeastern Pacific lineages wereT. niveus
and a sample from Yanaguabo, Cuba. The latter could not be identified to species on the basis of morphology because the specimen was severely damaged, but given its high divergence fromT. niveus(16% at COI; Table S5), it probably represents an undescribed species. The ancestor of the southern California-Pacific Mexico-T. niveus-‘Yaguanabo sample’ clade (clade O) was likely distributed in the Caribbean, becauseT. marcuzzii, its sister lineage, has a Caribbean distribution. Therefore, colonization of the northeastern Pacific appears to have proceeded from the Caribbean, which is congruent with paleontological studies of the Gulf of California reporting that most fauna-rich sediments found in this region have affinities with Caribbean fauna [53]. Marine fossils with Caribbean affinities in the Gulf of California date back to Miocene times [54]. Interestingly, Gulf of California/Caribbean affinities are also evident in the phylogeographic patterns of intertidal isopods of the genusExcirolana[55]. As discussed above, the only other Tylos species reported from the Caribbean, T. wegeneri, was found to be very divergent from the northeastern Pacific or other Caribbean lineages (28–36%; Table S4).
Comparatively, the history ofTylosin the northeastern Pacific region from southern California to central Mexico is much more recent than in the southern East Pacific. Nonetheless, high levels of cryptic diversity are observed in this region. Phylogeographic
patterns indicate the presence of highly divergent lineages (up to 20% K2P COI divergences) [9], in a region where only one currently accepted species (i.e.,T. punctatus) is reported. Based on these patterns, however, Hurtado et al. [9] indicate that T. punctatus sensu stricto is restricted to the Pacific coast region between southern California and Central Baja California, and that the divergent lineages found within the Gulf of California and south of this basin, in Central Pacific Mexico, appear to correspond to a complex of cryptic species (T. punctatus s. l.), which form a monophyletic group with T. punctatus. Phylogeo-graphic patterns of these lineages are discussed in detail in Hurtado et al. [9]. The complex geological history of the Gulf of California, a basin that is suggested to have formed at least ,12Ma [56], likely played a role in the extraordinary diversifi-cation of the supralittoralTylosandLigiawithin this basin [9,10]. Supralittoral isopods were suggested to be highly dispersive species [44]. Recent phylogeographic studies, however, challenge this early proposal forTylosandLigia, in which high levels of genetic differentiation and cryptic diversity are observed at small geograph-ic scales [8–10,41,57,58]. This is consistent with both, the biologgeograph-ical characteristics that confer these isopods low vagility, and the fragmented nature of their habitats. High levels of genetic differentiation and cryptic diversity appear to be common forTylos
in different regions of the world. High levels of allopatric cryptic diversity and isolation occurred in the northeastern Pacific [9]. High genetic divergence is observed between the samples from Puerto Rico and Yaguanabo, Cuba (14.1 and 16% K2P; respectively at the four gene and COI datasets; Tables S4 & S5), and further cryptic diversity may be found at other Caribbean locations. The two samples ofT. opercularis(from Sulawesi and Australia) were highly divergent (14.4%; Table S4), possibly representing different species. Large intra-specific genetic divergences were also observed inT. ponticusfrom Libya vs. Greece and Portugal (up to 14.8%; Table S4); whereas divergence betweenT. europaeusfrom Libya and Italy was 5% (Table S4). Divergence between the twoT. marcuzziilocalities collected within Cuba is 2.5% (Table S4). Low genetic divergence, however, was observed between T. granuliferus from Japan and Korea (0.3%; Table S4). Similarly, low genetic divergence (#0.6% COI) is reported inT. punctatuss. s. (as defined by [9]), probably reflecting a drastic bottleneck and a recent postglacial expansion in its current range in the Pacific region between southern California and central Baja California [9].
Taxonomic confusion has probably contributed to overestima-tion of the dispersal potential of Tylos. Specimens from many localities around the world were incorrectly assigned toT. latreillii
Audouin 1826 (e.g. from the Mediterranean, East Africa, Atlantic coast of Europe, Caribbean, Bermuda, and the Gulf of California [15,44,59–61]), leading to a misconception of high dispersal potential [15,44]. Originally described from an unspecified location in Egypt [13],T. latreilliicurrently lacks type specimens and a good description, rendering it a nomen dubium [14]. It probably corresponds to T. europaeus or T. ponticus from the Mediterranean Sea [14], or toT. exiguusfrom the Red Sea [62]. Nonetheless, extensive sampling reveals that none of the above three species are present in the Gulf of California [9]. Similarly, these three species are unlikely to inhabit the Caribbean region or Bermuda, where occurrence reports of specimens with affinity to ‘‘T. latreilli’’ await verification [11]. Another case that may have contributed to an overestimation of the dispersal potential ofTylos
is that of Tylos insularis Van Name, 1936, from the Galapagos Islands. Although currently considered a synonymy ofT. punctatus
and central Pacific Mexico [9]. This, in addition to their geographic separation, indicates thatT. insularis likely represents a distinct species, as proposed by Van Name [60].
Conclusion
The inferred mitochondrial phylogeny of 17 of the 21 currently recognizedTylosspecies sheds light on the phylogenetic relation-ships within this globally widespread supralittoral-endemic genus. Our results reveal the presence of highly divergent clades within
Tylos that have relatively discrete, yet broad, distributions. The most basal divergences involve lineages distributed in the southern East Pacific, implying a long history of isolation in this region. The remaining lineages are grouped in a clade, in which the most basal divergence involves a lineage made up of West Pacific and Indian Ocean taxa. Sister to this lineage, is a clade that has three deeply divergent lineages: one with taxa from the Arabian Peninsula; a second one with the taxa from the Mediterranean Sea and South Africa; and a third one with taxa from the Caribbean and the northeastern Pacific. Colonization of the northeastern Pacific appears to have proceeded from the Caribbean.
Divergences of lineages from different continents (e.g. clades D, I, and N) were probably shaped by tectonics. Although biological characteristics ofTylosmay have prevented dispersal of this isopod across vast oceanic scales, overwater dispersal likely enabled range expansions within some basins, and colonization of volcanic islands. In addition, present-day distributions were likely influ-enced by changes in sea level, which can alter habitat availability and connectivity, as well as changes in climate, which can cause range contraction and expansion, particularly at the latitudinal limits of this tropical/subtropical taxon (e.g. in the southern California-northern Baja California Peninsula region [9]).
Our findings imply that the dispersal abilities ofTylosare more limited than previously thought. High levels of cryptic genetic diversity are observed in different regions of the world. Therefore, a taxonomic revision of this group is necessary. Furthermore, new collections would enable examination of nuclear markers to corroborate our findings. Finally, more detailed sampling and ecological characterization within regions may reveal additional divergent lineages, and provide better insight into phylogeographic patterns and the mechanisms of diversification of this widespread yet poorly studied taxon.
Supporting Information
Figure S1 Ventral shape of the fifth pleonite for representative samples from 17 species. (13 from this study; 4 from previous studies).
(PDF)
Table S1 Information onTylosspecimens used in the phyloge-netic analyses.
(DOCX)
Table S2 PCR primers information and annealing temperature (Tm).
(DOCX)
Table S3 Node support obtained from different methods and substitution models for analyses of Dataset S1.
(DOCX)
Table S4 Percent Kimura-2-parameter distances for the con-catenated dataset of four mitochondrial genes (MT; 1243 characters).
(DOC)
Table S5 Percent Kimura-2-parameter distances for the COI gene (600 characters).
(DOC)
Dataset S1 Nexus file containing the alignment of all the taxa used in the analyses. Alignments are annotated by gene, and positions that were excluded and included (‘‘charset trust_always’’) in the phylogenetic analyses are identified.
(NEX)
Dataset S2 Nexus file containing the alignment of all the taxa used in the analyses with the exception of Helleria brevicornis.
Alignments are annotated by gene, and positions that were excluded and included (‘‘charset trust_always’’) in the phylogenetic analyses are identified.
(NEX)
Acknowledgments
Do Heon Kwon, Jonathan Wright, Miyuki Niikura, and Elizabeth Carrera contributed samples. Carlos Santamaria helped with fieldwork and provided useful feedback. James Woolley critically reviewed a manuscript draft. Kevin Conway allowed us to use his microscope. This study was conducted in partial fulfillment of M. Sc. requirements (EJL) at Texas A&M University. Contribution Number 238 of the Center for Biosyste-matics and Biodiversity. The authors acknowledge the Texas A&M University Brazos HPC cluster that contributed to the research reported here.,brazos.tamu.edu..
Author Contributions
Conceived and designed the experiments: EJL LAH MM. Analyzed the data: EJL MM LAH. Contributed reagents/materials/analysis tools: LAH ST MM. Wrote the paper: LAH MM. Conducted sampling: ST LAH. Performed the laboratory experiments: EJL. Reviewed manuscript draft and provided editorial comments: ST EJL. Supervised the study: LAH.
References
1. McLachlan A, Brown AC (2006) Chapter 6. Adaptations to Sandy-beach Life. In: McLachlan A, Brown AC, editors. The Ecology of Sandy Shores (Second Edition): Academic Press. 91–123. doi:10.1016/B978-012372569-1/50006-9. 2. Carefoot TH, Taylor BE (1995)Ligia: a prototypal terrestrial isopod. In: Alikhan
M, editor. Terrestrial Isopod Biology. Rotterdam: A.A. Balkema Publishers. 47– 60.
3. Warburg MR (1993) Evolutionary Biology of Land Isopods: New York: Springer-Verlag. 159 p.
4. Schmidt C (2008) Phylogeny of the terrestrial Isopoda (Oniscidea): a review. Arthropod Syst Phylogeny 66: 191–226.
5. Erhard F (1998) Phylogenetic relationships within the Oniscidea (Crustacea, Isopoda). Isr J Zool 44: 303–309.
6. Brown A, Odendaal F (1994) The biology of oniscid Isopoda of the genusTylos. Adv Mar Biol 30: 89–153. doi:10.1016/s0065-2881(08)60062-0.
7. Kensley B (1974) Aspects of the biology and ecology of the genusTylosLatreille. Ann S Afr Mus 65: 401–471.
8. Santamaria CA, Mateos M, Taiti S, DeWitt TJ, Hurtado LA (2013) A complex evolutionary history in a remote archipelago: phylogeography and morphomet-rics of the Hawaiian endemicLigiaisopods. PLoS ONE 8: e85199. doi:10.1371/ journal.pone.0085199.
9. Hurtado LA, Lee EJ, Mateos M (2013) Contrasting phylogeography of sandy vs. rocky supralittoral isopods in the megadiverse and geologically dynamic Gulf of California and adjacent areas. PLoS ONE 8: e67827. doi:10.1371/journal.pone. 0067827.
10. Hurtado LA, Mateos M, Santamaria CA (2010) Phylogeography of supralittoral rocky intertidalLigiaisopods in the Pacific region from central California to central Mexico. PLoS ONE 5: e11633.
11. Schmalfuss H (2003) World catalog of terrestrial isopods (Isopoda: Oniscidea). Stuttgarter Beitr Naturkd Ser A 654: 1–341.
12. Schmalfuss H, Vergara K (2000) The isopod genusTylos(Oniscidea: Tylidae) in Chile, with bibliographies of all described species of the genus. Stuttgarter Beitr Naturkd Ser A 612: 1–42.
Mitochondrial Phylogeny the Isopod GenusTylos
13. Audouin V (1826) Explication sommaire des planches des crustace´s de l’E´ gypte et de la Syrie, publie´es par Jules-Ce´sar Savigny In: Savigny J, editor. Description de l’E´ gypte: Histoire Naturelle. 77–98.
14. Taiti S, Ferrara F (1996) The terrestrial Isopoda of Corsica (Crustacea, Oniscidea). Bull Mus Natl Hist Nat Sect A: Zool Biol Ecol Anim 3–4: 459–545. 15. Schultz GA (1970) A review of the species of the genusTylosLatreille from the
New World (Isopoda, Oniscoidea). Crustaceana 19: 297–305.
16. Katoh K, Toh H (2008) Improved accuracy of multiple ncRNA alignment by incorporating structural information into a MAFFT-based framework. BMC Bioinformatics 9: 212. doi:10.1186/1471-2105-9-212.
17. Maddison DR, Maddison W (2003) MacClade 4: Analysis of phylogeny and character evolution. Sunderland, MA: Sinauer Associates.
18. Castresana J (2000) Selection of conserved blocks from multiple alignments for their use in phylogenetic analysis. Mol Biol Evol 17: 540–552.
19. Posada D (2008) jModelTest: Phylogenetic model averaging. Mol Biol Evol 25: 1253–1256. doi:10.1093/molbev/msn083.
20. Yang ZH (2006) Computational Molecular Evolution; Harvey PH, May RM, editors. New York, NY: Oxford University Press. 357 p.
21. Lanfear R, Calcott B, Ho SYW, Guindon S (2012) PartitionFinder: combined selection of partitioning schemes and substitution models for phylogenetic analyses. Mol Biol Evol 29: 1695–1701.
22. Stamatakis A (2014) RAxML version 8: a tool for phylogenetic analysis and post-analysis of large phylogenies. Bioinformatics doi:10.1093/bioinformatics/ btu033.
23. Zwickl DJ (2006) Genetic algorithm approaches for the phylogenetic analysis of large biological sequence datasets under the maximum likelihood criterion [Dissertation]. Austin: The University of Texas at Austin.
24. Miller MA, Pfeiffer W, Schwartz T (2010) Creating the CIPRES Science Gateway for inference of large phylogenetic trees. Proceedings of the Gateway Computing Environments Workshop (GCE) 14 Nov. 2010, New Orleans, LA: 1–8.
25. Guindon S, Dufayard JF, Lefort V, Anisimova M, Hordijk W, et al. (2010) New algorithms and methods to estimate Maximum-Likelihood phylogenies: assessing the performance of PhyML 3.0. Syst Biol 59: 307–321. doi:10.1093/Sysbio/ Syq010.
26. Sukumaran J, Holder MT (2010) DendroPy: a Python library for phylogenetic computing. Bioinformatics 26: 1569–1571. doi:10.1093/bioinformatics/btq228. 27. Ronquist F, Huelsenbeck JP (2003) MrBayes 3: Bayesian phylogenetic inference under mixed models. Bioinformatics 19: 1572–1574. doi:10.1093/ bioinformatics/btg180.
28. Huelsenbeck JP, Ronquist F (2001) MRBAYES: Bayesian inference of phylogenetic trees. Bioinformatics 17: 754–755.
29. Ronquist F, Teslenko M, van der Mark P, Ayres DL, Darling A, et al. (2012) MrBayes 3.2: efficient Bayesian phylogenetic inference and model choice across a large model space. Syst Biol 61: 539–542.
30. Rannala B, Zhu TQ, Yang ZH (2012) Tail paradox, partial identifiability, and influential priors in Bayesian branch length inference. Mol Biol Evol 29: 325– 335. doi:10.1093/Molbev/Msr210.
31. Suzuki Y, Glazko GV, Nei M (2002) Overcredibility of molecular phylogenies obtained by Bayesian phylogenetics. Proc Natl Acad Sci USA 99: 16138–16143. 32. Yang Z, Rannala B (2005) Branch-length prior influences Bayesian posterior probability of phylogeny. Syst Biol 54: 455–470. doi:10.1080/ 10635150590945313.
33. Lewis PO, Holder MT, Holsinger KE (2005) Polytomies and Bayesian phylogenetic inference. Syst Biol 54: 241–253.
34. Lewis PO, Holder MT, Swofford DL (2010) Phycas. Available: http://www. phycas.org Accessed 2010 Aug 5.
35. Zhang C, Rannala B, Yang ZH (2012) Robustness of compound Dirichlet priors for Bayesian inference of branch lengths. Syst Biol 61: 779–784. doi:10.1093/ Sysbio/Sys030.
36. Nylander JA, Wilgenbusch JC, Warren DL, Swofford DL (2008) AWTY (are we there yet?) : a system for graphical exploration of MCMC convergence in Bayesian phylogenetics. Bioinformatics 24: 581–583. doi:10.1093/ bioinformatics/btm388.
37. Rambaut A, Drummond AJ (2009) Tracer v1.5: MCMC trace analyses tool. Available: http://beast.bio.ed.ac.uk/Tracer Accessed 2009 Dec 1.
38. Swofford DL (2003) PAUP*. Phylogenetic Analysis Using Parsimony (*and Other Methods). Version 4. Sunderland, Massachusetts: Sinauer Associates. 39. Degnan JH, Rosenberg NA (2009) Gene tree discordance, phylogenetic
inference and the multispecies coalescent. Trends Ecol Evol 24: 332–340. doi:10.1016/j.tree.2009.01.009.
40. Vandel A (1952) Etude des isopodes terrestres recoltes au Venezuela par le Dr. G. Marcuzzi, suivie de considerations sur le peuplement du Continent de Godwana. Mem Mus Civ Stor Nat Verona 3: 59–203.
41. Santamaria CA (2013) Evolution ofLigiaisopods in three geologically dynamic regions [Dissertation]. College Station: Texas A&M University. 160 p. 42. Miller AG, Cope TA, editors (1996) Flora of the Arabian Peninsula and Socotra.
Edinburgh, UK: Edinburgh University Press. 586 p.
43. Broly P, Deville P, Maillet S (2013) The origin of terrestrial isopods (Crustacea: Isopoda: Oniscidea). Evol Ecol 27: 461–476. doi:10.1007/S10682-012-9625-8. 44. Vandel A (1960) Isopodes terrestres (premie`re partie). Faune de France 64: 1–
416.
45. Upchurch P (2008) Gondwanan break-up: legacies of a lost world? Trends Ecol Evol 23: 229–236. doi:10.1016/j.tree.2007.11.006.
46. Rosen DE (1975) A vicariance model of Caribbean biogeography. Syst Biol 24: 431–464.
47. Iturralde-Vinent M, MacPhee RD (1999) Paleogeography of the Caribbean region: implications for Cenozoic biogeography. Bull Am Mus Nat Hist 238: 1– 95.
48. Harmon RS, Land LS, Mitterer RM, Garrett P, Schwarcz HP, et al. (1981) Bermuda sea level during the Last Interglacial. Nature 289: 481–483. doi:10.1038/289481a0.
49. Harmon RS, Schwarcz HP, Ford DC (1978) Late Pleistocene sea level history of Bermuda. Quat Res 9: 205–218.
50. Shultz GA (1972) Ecology and systematics of terrestrial isopod Crustaceans from Bermuda. Crustaceana, Supplement 3: 79–99.
51. Garcia-Castellanos D, Estrada F, Jimenez-Munt I, Gorini C, Fernandez M, et al. (2009) Catastrophic flood of the Mediterranean after the Messinian salinity crisis. Nature 462: 778–781. doi:10.1038/nature08555.
52. Montesanto G, Deidun A, Sciberras A, Sciberras J, Lombardo BM (2014) Current distribution of two species of Tylos (Isopoda: Oniscidea) in the Central Mediterranean and the influence of beach sand grain-size parameters. J Crustacean Biol 34: 47–53. doi:10.1163/1937240X-00002206.
53. Escalona-Alca´zar FdJ, Delgado-Argote LA, Lo´pez-Martı´nez M, Rendo´n-Ma´rquez G (2001) Late Miocene volcanism and marine incursions in the San Lorenzo Archipelago, Gulf of California, Mexico. Rev Mex Cienc Geol 18: 111– 128.
54. Smith J (1991) Cenozoic marine mollusks and paleogeography of the Gulf of California. In: Dauphin JP, Simoneit B, editors. The Gulf and Peninsular Province of the Californias. Tulsa, OK: American Association of Petroleum Geologists. 637–666.
55. Liu S (2013) Phylogeographic patterns of the intertidal isopods Excirolana braziliensisandExcirolana mayana(Isopoda: Cirolanidae) [Thesis]. College Station: Texas A&M University.
56. Helenes J, Carren˜o AL, Carrillo RM (2009) Middle to late Miocene chronostratigraphy and development of the northern Gulf of California. Mar Micropaleontol 72: 10–25. doi:10.1016/j.marmicro.2009.02.003.
57. Eberl R, Mateos M, Grosberg RK, Santamaria CA, Hurtado LA (2013) Phylogeography of the supralittoral isopodLigia occidentalisaround the Point Conception marine biogeographic boundary. J Biogeogr 40: 2361–2372. 58. Taiti S, Arnedo MA, Lew SE, Roderick GK (2003) Evolution of terrestriality in
Hawaiian species of the genusLigia(Isopoda, Oniscidea). Biology of Terrestrial Isopods V, Proceedings 2: 85–102.
59. Mulaik S (1960) Contribucio´n al conocimiento de los iso´podos terrestres de Me´xico (Isopoda, Oniscoidea). Rev Soc Mex Hist Nat 21: 79–292.
60. Van Name WG (1936) The American land and fresh-water isopod Crustacea. Bull Am Mus Nat Hist 71: 1–535.
61. Richardson H (1905) A monograph on the isopods of North America. Bull U S Nat Mus 54: 1–727.
62. Taiti S, Ferrara F (2004) The terrestrial Isopoda (Crustacea: Oniscidea) of the Socotra Archipelago. Fauna of Arabia 20: 211–326.
63. Van Name WG (1924) Isopods from the Williams Galapagos Expedition. Zoologica 5: 181–210.