Rapid Behavioral and Genomic Responses
to Social Opportunity
Sabrina S. Burmeister1¤*, Erich D. Jarvis2, Russell D. Fernald1
1Biological Sciences, Stanford University, Stanford, California, United States of America,2Department of Neurobiology, Duke University Medical Center, Durham, North Carolina, United States of America
From primates to bees, social status regulates reproduction. In the cichlid fishAstatotilapia (Haplochromis) burtoni,
subordinate males have reduced fertility and must become dominant to reproduce. This increase in sexual capacity is orchestrated by neurons in the preoptic area, which enlarge in response to dominance and increase expression of gonadotropin-releasing hormone 1 (GnRH1), a peptide critical for reproduction. Using a novel behavioral paradigm, we show for the first time that subordinate males can become dominant within minutes of an opportunity to do so, displaying dramatic changes in body coloration and behavior. We also found that social opportunity induced expression of the immediate-early geneegr-1in the anterior preoptic area, peaking in regions with high densities of GnRH1 neurons, and not in brain regions that express the related peptides GnRH2 and GnRH3. This genomic response did not occur in stable subordinate or stable dominant males even though stable dominants, like ascending males, displayed dominance behaviors. Moreover,egr-1in the optic tectum and the cerebellum was similarly induced in all experimental groups, showing thategr-1induction in the anterior preoptic area of ascending males was specific to this brain region. Because egr-1codes for a transcription factor important in neural plasticity, induction of egr-1in the anterior preoptic area by social opportunity could be an early trigger in the molecular cascade that culminates in enhanced fertility and other long-term physiological changes associated with dominance.
Citation: Burmeister SS, Jarvis ED, Fernald RD (2005) Rapid behavioral and genomic responses to social opportunity. PLoS Biol 3(11): e363.
Introduction
Among social animals, dominance can have long-term physiological consequences. For example, dominance status has been shown to control fertility [1–3], neurogenesis [4], growth rate [5], and stress physiology [6,7]. Although social regulation of physiology is a well-established phenomenon, little is known about the neural mechanisms linking the social environment to physiological changes associated with dom-inance. To understand these neural mechanisms, we study a cichlid fish, Astatotilapia (Haplochromis) burtoni, in which dominance is tightly coupled to reproductive physiology.
Among maleA. burtoni,dominance status regulates repro-duction at several levels, resulting in decreased fertility of subordinate males. Subordinate males have smaller, less-mature testes [3]; they lack a territory with a spawning site; they do not display the body coloration advertising domi-nance; and they infrequently perform dominance behaviors, such as territorial defense and courtship. Among vertebrates, such differences in reproductive maturation are controlled primarily by the hypophysiotropic gonadotropin-releasing hormone (GnRH) neurons in the basal forebrain [8]. In A. burtonithese neurons expressGnRH1and are located in the anterior parvocellular preoptic nucleus (aPPn), which is the most anterior part of the preoptic area in teleosts; the preoptic area is a conserved brain region among vertebrates. In dominant males, the GnRH1 neurons in the aPPn have larger somas [9,10], higherGnRH1gene expression [11], and altered electrical properties [12] compared to subordinates. These differences in GnRH1 neurons are controlled by social status [10,13] and presumably underlie the differences in testes size. Other forms of GnRH, GnRH2 and GnRH3, are expressed in the midbrain tegmentum and the terminal nerve ganglion, respectively, but they do not appear to regulate
reproductive physiology in this species [11,14,15], nor do they demonstrate socially induced neural plasticity in soma size or gene expression [11], although GnRH2 has been implicated in regulating reproduction in mammals [16].
Social cues regulate sexual maturation in many animals [17]. One remarkable feature ofA. burtoniis that male reproductive capacity is socially regulated throughout life; in the adult, sexual capacity is reversible and, importantly, remains under the control of social cues. Since the number of dominant males at any given time is limited by territorial resources, rapidly growing subordinates frequently attempt to usurp territories from faltering dominant males, resulting in a dynamic social hierarchy [5]. When a male detects an opportunity to ascend in status, his body coloration and behavioral repertoire change first whereas changes in fertility lag behind [10,11]. Specifi-cally, males becoming dominant have been shown to produce the behavioral and coloration aspects of dominance as early as 1 d following a change in the social environment, but they did
Received February 18, 2005; Accepted August 23, 2005; Published October 18, 2005
DOI: 10.1371/journal.pbio.0030363
Copyright:Ó2005 Burmeister et al. This is an open-access article distributed under
the terms of the Creative Commons Attribution License, which permits unrestricted use, distribution, and reproduction in any medium, provided the original author and source are credited.
Abbreviations: ANOVA, analysis of variance; aPPn, anterior parvocellular preoptic nucleus; GnRH, gonadotropin-releasing hormone; GSI, gonadosomatic index; ISH, in situ hybridization; OT, optic tectum; SE, standard error; TL, torus longitudinalis
Academic Editor: John Godwin, North Carolina State University, United States of America
*To whom correspondence should be addressed. E-mail: [email protected]
[These authors contributed equally to this work.
not produce dominance behaviors at the rate of established dominant males until 7 d later [11]. Evident 7 d after a male ascends to dominance are increases in GnRH1 expression, GnRH1 neuron soma size, and testes size [11]. The key question we address here is, how does social experience affect short-term changes in behavior and gene expression that can lead, ultimately, to changes in GnRH1.
To understand the early behavioral and genomic responses of subordinate males to an opportunity to ascend in status, we addressed two questions. First, what is the behavioral response to perception of social opportunity? Second, what is the genomic response to social opportunity in the aPPn and how does this relate to GnRH1 neurons? To answer these questions, we developed a novel behavioral paradigm in which resident subordinate males were provided an oppor-tunity to ascend in status in their familiar home environ-ments. Because we were interested in identifying early genomic responses that could regulate long-term physiolog-ical changes, we focused onegr-1(also calledzif268,NGFI-A, andzenk), which codes for a transcription factor important for neuronal plasticity and links membrane depolarization to expression of late-response target genes [18–21]. We com-paredegr-1expression in the aPPn of ascending males to that of stable subordinate and dominant males in similar circum-stances. To assess the specificity of the induction pattern we observed, we also examinedegr-1expression in four control regions: the optic tectum (OT), a subdivision of the cerebellum, the terminal nerve ganglion, and the midbrain tegmentum. Our results reveal a potential molecular mech-anism for translating social information into changes in fertility and contribute to the understanding of molecular and neurobiological mechanisms of social behavior.
Results
Using activity-dependent genes to map functional re-sponses of brain areas requires a paradigm in which behavioral changes can be measured on the same timescale as changes in gene expression and in which the behavioral context minimizes generalized disturbances that also induce gene expression that can confound results [22–24]. Because such studies had not been conducted before in fish, we developed a novel behavioral paradigm that met the require-ments of functional genomic mapping (see Materials and Methods). This paradigm generated novel behavioral re-sponses and allowed us to map the genomic consequences of social opportunity as described below.
Perception of Social Opportunity
In our behavioral paradigm, we controlled the social experience of all subjects over a 14-d period that concluded in an observation tank with four females and one or two males (see Materials and Methods). The individuals in the observation tank could see, but not physically interact with, large communities of fish in adjacent tanks. We then gave some subordinate males an opportunity to ascend to dominance in this familiar home environment by removing a resident dominant male 1 hr before onset of lights (using infrared night-vision goggles). This allowed us to link perception of social opportunity to light onset and to do so in the absence of stressful physical disturbances; prior approaches involved multiple physical disturbances [9–11].
We compared these ascending males to (1) stable subordinate males that experienced identical circumstances except for removal of the suppressing dominant male and that, there-fore, represent ascending males prior to social opportunity and (2) stable dominant males that expressed dominance in the same environment as ascending males but in the absence of new opportunity.
We found that subordinate males given an opportunity to ascend to dominance did so within minutes by changing their body coloration and behavior (Figure 1A–1D). Dominance coloration or behaviors were not displayed by stable subordinate males, which were in the continued presence of suppressing dominant males (Figure 1E); these males were behaviorally indistinguishable from ascending males prior to social opportunity (Figure 1C). Interestingly, we noted for the first time that stable dominant males did not display coloration aspects of dominance status before the lights came on, but re-expressed this trait along with dominance behaviors minutes after onset of lights (Figure 1F) with a similar latency to males undergoing social ascent (Figure 1D). This diurnal expression of body coloration in stable domi-nants suggests that the expression of dominance coloration is costly, and that it pays to express it only when receivers can see it. Furthermore, ascending males expressed dominance behaviors at similar rates as stable dominant males (Figure 1D versus 1F), in contrast to previous studies that observed dominance shifts occurring more gradually [11].
Although ascending males expressed dominance with similar latency as stable dominant males, their behavioral responses were not identical. Compared to stable dominants, ascending males courted females slightly more, visited the spawning site slightly less, chased other fish at a similar rate, and threatened dominant males in the adjacent tank more frequently (Figure 2). In contrast, stable subordinates pro-duced very few dominance-related behaviors (Figure 2), although they performed high rates of fleeing from the suppressing dominant males, a behavior not produced by ascending or stable dominant males (data not shown). There-fore, what differed between stable dominants and ascending males was the proportion of time spent producing a given dominance behavior; ascending males produced a higher proportion of threats toward neighboring dominant males.
To verify the reproductive status resulting from the prior 14-d social suppression on ascending and stable subordinate males, we calculated gonadosomatic index (GSI) as a measure of testes size relative to body size. Because GSI increases are only evident 1 wk after ascent [11], the 20 min of social dominance that ascending males experienced at the end of suppression is too short to cause increases in testes size. Socially suppressed males (mean GSI6standard error [SE]¼ 0.4660.06) had smaller testes relative to their body size than stable dominant males (0.7860.22), although the difference was not statistically significant (F1,8¼3.86,p¼0.085). Because the GSI of suppressed and stable dominant males in our study was similar to that of long-term subordinate (0.4360.06) and dominant (0.7460.05) males, respectively [11], we concluded that the lack of a statistical difference in our study may be the result of small sample sizes.
Rapid Genomic Response to Social Opportunity
We found that the rapid behavioral responses to social opportunity were matched by a rapid genomic response in
the aPPn: Males ascending to dominance had a greater than 2-fold induction ofegr-1compared to stable dominant and stable subordinate males (Figure 3). The stable dominants and stable subordinates did not differ from one another. The genomic response in the aPPn of ascending males was anatomically heterogeneous: induction was greatest in the central region (sections 4 and 5, approximately 168–224lm caudal of the anterior commissure), less strong in the flanking regions (sections 1–3 and 6–7), and undetectable in the caudal-most region (sections 8–10; Figure 3B). To determine whether the lack ofegr-1response in the caudal-most sections could be the result of an inherent inability of this region to induce egr-1, we compared the egr-1 levels of males in the experiment to a positive control male that had been injected with a glutamate receptor agonist, kainic acid, which induces high levels of egr-1 in the aPPn and elsewhere [25]. In the caudal-most region of the aPPn (sections 8–10), the kainic acid–injected male had 66% higheregr-1levels than ascend-ing males (Figure 3C). A negative control male, which was sacrificed minutes before onset of lights, had the lowest level ofegr-1expression (Figure 3C). Thus, the lower levels ofegr-1 in the caudal aPPn of ascending males cannot be explained by an inherent inability of this region to express higher levels of egr-1,and suggests thategr-1induction in the anterior part of the aPPn of ascending males represents a specific response rather than a general increase inegr-1.
To further characterize the specificity of the response in
the aPPn, we measured egr-1 expression in two control
regions: a sensory region, the OT, which integrates visual and
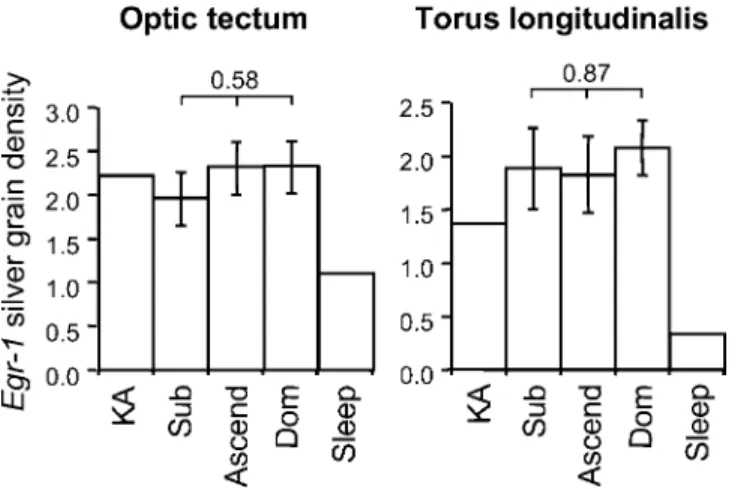
somatosensory information, and a motor region, the torus longitudinalis (TL), a subdivision of the teleost cerebellum, which integrates visual information with motor output. Although egr-1 was expressed in these brain regions, the expression levels did not vary with social status or social opportunity (Figure 4), nor was there a significant interaction between group and brain section. Social opportunity, there-fore, regulated induction ofegr-1in the aPPn, but not in these sensory and motor regions.
To determine whether the neuroanatomical heterogeneity ofegr-1induction in the aPPn was related to the distribution of GnRH1 neurons, we compared the aPPnegr-1response of ascending males with the number of neurons expressing GnRH1 on adjacent brain sections. Our GnRH1 probe was specific to GnRH1, which codes for the hypophysiotropic form of GnRH in this species [26]. We found that aPPnegr-1 induction was greatest in sections corresponding to those that had largest numbers of GnRH1 neurons and that this relationship accounted for 86% of the observed variation in egr-1 induction (Figure 5A and 5B). The increase in egr-1 expression in regions with high numbers of GnRH1 neurons is not due to generalized differences in cell density; our measure of egr-1 induction, silver grain density, took into account such differences. We determined whether the egr-1 was co-expressed with GnRH1by performing a double-label in situ hybridization. We found thategr-1 was expressed in bothGnRH1-expressing and non-GnRH1–expressing neurons (Figure 5C). We quantified the degree of double labeling among ascending males and found that the majority of
Figure 1.Time Course of Behavioral Response to Social Opportunity
(A and B) Males displaying subordinate and dominant status.
(C–F) Rate of dominance behaviors of individual ascending males the day before and during social opportunity, of stable subordinate males, and stable dominant males. Legends indicate latency (min:sec) to express dominance for each male on the day of sacrifice. Dominance behaviors are represented by composite scores consisting of the sum of chases, threat displays, courtship solicitations, and twice the number of spawning-site entries produced per minute.
GnRH1 neurons (78.5%) expressed egr-1 with a population median of 15 co-localized egr-1 silver grains (Figure 5D). Taken together, these data demonstrate that the region of the aPPn with the highest density of GnRH1 neurons was most responsive to social opportunity.
As a comparison, we also examined expression ofegr-1in the non-hypophysiotropic GnRH neuron populations, which do not demonstrate socially induced plasticity. We found that neither theGnRH2-expressing midbrain tegmentum neurons nor theGnRH3-expressing terminal nerve ganglion neurons expressedegr-1, even in the kainic acid–injected male (data not shown), suggesting that these cell populations are not capable of expressingegr-1. We determined that theA. burtoni GnRH1gene is a candidate target of the egr-1 transcription factor by localizing an egr-1 binding site (GCGGCGGCG [27]) 1,311 nucleotides upstream of the transcription start site [28]. Neither theGnRH2nor theGnRH3genes contain a putative egr-1 binding site.
Discussion
Using a novel behavioral paradigm, we found that the behavioral transformation from subordinate to dominant can occur within minutes, and that this transformation is associated with a rapid genomic response in the aPPn, the most anterior nucleus of the preoptic area. Below we describe the behavioral and physiological implications of our findings.
Perception of Social Opportunity
We found that ascending males rapidly adopted dominance coloration and produced the full array of dominance behaviors at rates that were similar to or higher than stable dominant males. The main difference we found was a greater number of threat displays produced by ascending males. Ascending males may have emphasized threat displays more than stable dominants in order to assert their new status with dominant males in neighboring tanks. Stable dominant males, in contrast, may have been less likely to be challenged by their familiar neighbors (i.e., the ‘‘dear enemy’’ phenomenon [29,30]) and could, therefore, invest more time engaging in reproductive behaviors, such as maintenance of the spawning site.
Perception of social opportunity requires a sophisticated integration of social cues because the information inherent in social opportunity is conveyed by the absence of a dominant male. The dominant male’s absence is salient because it provides information about the focal male’s future relation-ship to others within his complex social group. The response of ascending males suggests that they perceive the dominant male’s absence as an opportunity to ascend in status.
The shift to dominance by ascending males within minutes of social opportunity demonstrates a social perspicacity previously unknown to exist in this species. The most detailed prior time course of behavioral responses to social oppor-tunity measured changes over the course of days [11]. White et al. [11] reported that when subordinate males are moved to a new community where they are the largest, they increase their dominance within 1 d and continue to increase their levels of dominance until they are indistinguishable from stable dominant males 7 d later at the earliest. In contrast, we found that ascending males expressed dominance behaviors at rates similar to or greater than stable dominants within 14 min of social opportunity. Although no previous studies have reported the behavioral response to social opportunity on a timescale of minutes, in our personal experience, subordinate males do not ascend to dominance within 30 min of social opportunity when they are moved into a new community, the method used in prior studies [9–11]. Rather, when a male is caught and moved into a new environment, his initial response is to produce escape behaviors. The pronounced reduction in response time in our study is likely due to our method of presenting social opportunity that minimized disturbance to the focal subordinate male.
Social history may be another potentially important factor contributing to rapid responses to social opportunity. In our paradigm, subordinate males had been dominant 2 wk before, which differs from previous studies [9–11] that used males who had been subordinate for longer periods of time prior to social opportunity. Although there is no known mechanism for recent experience priming responses to social opportu-nity, we speculate that such a priming effect may enable males to respond quickly to rapidly changing social situations in nature. In a constant environment in the laboratory, males adopt stable social relationships that go unchanged for 7 to 9.5 wk on average [5]. However, fluctuating environments designed to mimic nature greatly shorten status tenure so that males remain subordinate for 4 wk and dominant for 3 wk on average [5]. Our study more closely resembled the fluctuating environment in terms of status tenure and, as
Figure 2.Behavioral Responses to Social Opportunity
The rate of individual dominance behaviors per minute (mean6SE) differed among stable subordinate (Sub), ascending (Ascend), and stable dominant (Dom) males.p-Values for individual comparisons are shown above bars.
DOI: 10.1371/journal.pbio.0030363.g002
such, may more closely resemble natural circumstances. If so, this would suggest that in naturally dynamic social situations, males are able to respond to socially opportunity without delay.
egr-1:Linking Social Opportunity to Reproductive Function
We found that males ascending to dominance induced high levels ofegr-1in their aPPn compared to stable subordinates
and dominants. Stable dominant males had low egr-1
expression in the aPPn at the same level as stable subordi-nates, despite the fact that stable dominants, like ascending males, were expressing dominance. Becauseegr-1 induction
may decline with repeated exposure to a stimulus [31], it is worth emphasizing that dominant males had not been expressing dominance for the previous 12 hr of darkness; they re-expressed dominance after lights-on, but did not induceegr-1to high levels in the aPPn. These findings suggest, therefore, thategr-1induction in the aPPn of ascending males is not a product of dominance per se, but a product of social opportunity.
Social opportunity is a complex experience that includes the perception of opportunity and the behavioral response to it. We wondered if theegr-1induction by social opportunity could be explained by the simple sensory or motor aspects of the experience. Since the sensory recognition of social
Figure 3.egr-1Induction in the aPPn
(A) Mean6SE silver grain density of the entire aPPn differed among subordinate (Sub), ascending (Ascend), and dominant (Dom) males.
(B) Induction ofegr-1(mean6SE silver grain density) in the aPPn of ascending males varied with section number (rostral to caudal) as compared to subordinate and dominant males. Asterisks represent contrasts withp,0.05.
(C) Mean6SE silver grain density in the three caudal-most sections of the aPPn of subordinate, ascending, and dominant males compared to a male injected with kainic acid (KA) and a male sacrificed just before onset of lights (Sleep).
(D) Photomicrographs ofegr-1expression in the aPPn of an ascending male (top) and a stable dominant male (bottom). We chose representative males and sections to be close to group means for the central aPPn. Arrows indicate examples ofegr-1-expresssing GnRH1 neurons identified by their distinctly large cellular morphology, arrowheads indicate examples of non-GnRH1 neurons, and the asterisks indicate the preoptic recess of the third ventricle. Scale bars represent 40lm.
opportunity requires a complex integration of social cues, which is mediated by the absence of a conspecific, induction of egr-1 in the aPPn is unlikely to be explained by simple sensory aspects of the experience. This is consistent with the idea that the preoptic area is not a primary sensory station,
but integrates internal and external information to regulate motivation and physiology [32]. The behavioral motor response to social opportunity is another possible candidate for mediating socially-induced egr-1expression in the aPPn because ascending males produced more threat displays than did stable dominants. However, we note that the ascending male with the highest egr-1 produced the fewest threat displays of this group (data not shown). Further, stable dominant males produced intermediate numbers of threat displays, whereas the subordinate males produced no more than one, yet theiregr-1expression levels in the aPPn were the same. From these data, it is difficult to conclude that there is a simple relationship between the motor production of threat displays and aPPn egr-1 expression. The more interesting possibility is that threat displays regulate egr-1 expression only in the context of social opportunity. Indeed, there is precedence for social context causing large differences in motor-driven egr-1 expression [24,33], suggesting that the stimulus context itself, or subtle behavioral motor differences between the two contexts, are able to cause large differences inegr-1expression. Similarly, past social context is known to influence subsequentegr-1expression [34,35]. In summary, we
propose that induction of egr-1 in the aPPn by social
opportunity is the result of a complex integration of social signals that transcends simple sensory or motor aspects of the experience.
egr-1 expression in the aPPn is a potential link between social opportunity and enhanced reproductive function. The
Figure 4.egr-1Induction in the OT and TL
Mean6SE silver grain density in the OT or the TL did not vary among subordinate (Sub), ascending (Ascend), and dominant (Dom) males. The
p-values for the effect of social opportunity are shown above bars. Shown for comparison is a male injected with kainic acid (KA) and a male sacrificed just before onset of lights (Sleep).
DOI: 10.1371/journal.pbio.0030363.g004
Figure 5.Relationship betweenegr-1and GnRH1 in the aPPn
(A) MeanþSE GnRH1 neuron number (indicated by an open circle) andegr-1silver grain density (indicated by a closed circle) by section number (rostral to caudal).
(B) Covariation of mean6SE GnRH1 neuron number andegr-1silver grain density within sections.
(C) Photomicrograph ofegr-1(silver grains) andGnRH1(brown precipitate) expressing neurons in the aPPn. Scale bar represents 10lm. (D) Histogram showing the number of GnRH1 neurons with the corresponding range of co-localizedegr-1silver grains.
DOI: 10.1371/journal.pbio.0030363.g005
egr-1induction in ascending males peaked in regions neuro-anatomically associated with GnRH1 neurons.egr-1was not expressed in the non-hypophysiotropic GnRH2 and GnRH3 neurons that lack socially induced plasticity [11]. Although neuronal egr-1 targets regulated by physiological stimuli in vivo have yet to be identified, candidate targets in vitro include synapsins [36,37] and neurofilaments, among others [20]. Such target genes may contribute to the dramatic structural enlargement that occurs in the GnRH1 neuron somas over the course of 7 d [11]. In addition, we determined that theGnRH1gene, but notGnRH2orGnRH3, contains a binding site for the egr-1 transcription factor. Thus, the coupling of aPPn egr-1 expression to social cues may be a mechanism for initiating structural changes in aPPn neurons, as well as changes in GnRH1 expression itself. Our finding that social information is transduced into molecular changes byegr-1reveals a potential molecular mechanism for trans-lating social information into changes in fertility and contribute to a growing understanding of social regulation of reproductive physiology [38–40].
Materials and Methods
Social manipulation.All subjects were adult males (6.75–8.25 cm standard length) raised from our laboratory stock that was originally derived from a wild population in Lake Tanganyika, Africa. All procedures were approved by the Stanford University Administrative Panel on Laboratory Animal Care committee. To perform behavioral molecular mapping with activity-dependent gene induction, we required a behavioral paradigm that would minimize disturbance of the social interactions and physical environment. Previous studies manipulated social environment by moving subordinate males to a new physical and social community (e.g., [11]) which may cause activation of gene regulation in many brain areas, and also inhibit rapid expression of dominance due to stress and/or the challenges of learning a new environment. Thus, we developed a paradigm where we tested a male’s response to social opportunity in a familiar social and physical environment. To create a social opportunity, we removed a resident dominant male, rather than moving the subordinate male of interest. We paid close attention to the relative sizes of individuals, and we minimized the time spent in the socially reduced environment needed to produce a social opportunity. We minimized disturbance of the subjects by visually isolating the experimental observation tank with a black curtain.
To control for recent social experience, we began with males who were identified by focal observations as dominant (totaln¼10). We
then placed these males in different social environments to manipulate their status. In group 1 (‘‘ascending males,’’n¼4), males were socially suppressed for 14 d in a two-stage process and then given an opportunity to ascend in status on day 15. We chose 14 d of social suppression because this is sufficient to suppress the reproductive axis as measured by testes size. In stage 1 of social suppression (days 1–12), males were transferred from their original home tank where they were dominant to a social suppression tank that contained multiple larger dominant males, other subordinate males, and females. In stage 2 (days 13–14), these males were transferred to an experimental observation tank isolated by a curtain, which contained one larger dominant male who had previously established his territory in the tank (the suppressor) and four females. During both stages of social suppression, we used focal observations to confirm that subjects maintained their subordinate status. We used this two-stage approach to minimize the amount of time spent in the reduced social environment of the observation tank because extended periods in dominant–subordinate dyads can lead to injury of subordinate males. The reduced social circumstance of a dominant–subordinate dyad was necessary to control which individ-ual ascends in status following removal of the dominant male. The observation tank was adjacent to two community tanks separated by transparent barriers; water circulation was shared among compart-ments. The adjacent community tanks contained multiple dominant males, subordinate males, and females that were all smaller in size than the males in the observation tank. Males visually interacted with other males across the transparent barrier. We reasoned that the
subordinate subjects would be more inclined to ascend in status upon the removal of the suppressor if he perceived himself to be the largest male among those males he could see.
On the morning of day 15, group 1 subjects were given an opportunity to ascend to dominance by the removal of the suppressor 1 hr before onset of the lights. We removed the suppressor in the dark with the aid of infrared night-vision goggles. This minimized the disturbance to the subjects by preventing them from seeing the experimenter or the net in the dark, and preventing them from detecting the absence of the suppressor until the lights were turned on. Becauseegr-1gene expression peaks at approximately 30 min following stimulation [25], we sacrificed group 1 males 20 min after they produced one of two behaviors that are typical of dominance: a threat display directed toward a dominant male in an adjacent community tank or three rapid sequential chases of the females in the observation tank (dominant males will chase other fish, including females, away from their territories unless engaged in courtship). We recorded behavior with a digital video camera the morning before (14th day) and morning of (15th day) sacrifice, beginning with the onset of lights, for later quantification.
In group 2 (‘‘stable subordinates,’’ n ¼ 3), we created stable subordinate males by socially suppressing males for 14 d in a two-stage process identical to that for group 1 males. On the morning of the 15th day, we simulated removal of the suppressor by dipping a net into the tank 1 hr before onset of the lights, and, beginning with the onset of lights, we recorded behavior with a digital video camera for later quantification. Because we did not remove the suppressor, group 2 males remained subordinate (see Results). Each male in group 2 was paired with a subject in group 1 and sacrificed at the same time relative to onset of lights.
In group 3 (‘‘stable dominants,’’n¼3), we created stable dominant males by leaving the dominant males in their original home tanks during the first 12 d of the experiment. On day 13, these dominant males were put into the observation tank containing four females and no other males. On the morning of the 15th day, we simulated removal of a fish by dipping a net into the tank 1 hr before onset of the lights, and, beginning with the onset of lights, we recorded behavior with a digital video camera for later quantification. To determine time of sacrifice for group 3 males, we used identical criteria to that of group 1 males. That is, we sacrificed them 20 min after they first produced an aggressive dominance behavior.
To verify the success of reproductive suppression of males in groups 1 and 2 compared to males in group 3, we measured body mass and testes mass at the time of sacrifice to calculate GSI (testes mass divided by body mass multiplied by 100) as a measure of relative testes size.
In addition to males who underwent social manipulation, we sacrificed two males for use as a positive and negative control in the
egr-1in situ hybridization. For the negative control, we sacrificed a dominant male minutes before onset of lights. For the positive control, we injected a male with kainic acid (10 mg per kg body mass) and sacrificed him 30 min later. A prior study [25] demonstrated that kainic acid causes an up-regulation ofegr-1in the aPPn, and males sacrificed before onset of lights have dramatically reduced egr-1
expression throughout the brain.
We quantified four behaviors (see [41] for details): two agonistic behaviors (chases and threat displays) and two reproductive behaviors (courtship solicitations and spawning-site entries). We defined chases as the subject forcibly swimming toward another fish (directed toward males and females). We defined threat displays (directed toward males) as lateral displays or border threats. We defined courtship solicitations (directed toward females) as presen-tation of the anal-fin egg spots and leading, whereby males invite the female to the spawning site. We defined spawning-site entries as any time the male entered the spawning site which, in the laboratory, is an over-turned pottery shard; the pot is where spawning would take place and it defines the center of a male’s territory. We recorded the latency to express dominance as the latency to perform a threat display or three rapid chases after onset of lights. We calculated the rate of each behavior (behavior per minute) within each 5-min bin from lights-on to sacrifice. For group 1, we also quantified these behaviors the day before social transition to verify that they were subordinate before transition. To graphically display the develop-ment of dominance in Figure 1, we calculated a composite score,
Analysis ofegr-1expression in situ.Males were sacrificed by rapid decapitation, and we removed, froze, and stored their brains at80 8C. We sectioned brains in three alternate series at 14 lm in the transverse plane. To detect egr-1 mRNA, we followed published radioactive in situ hybridization (ISH) procedures [25], dipped the slides in emulsion, processed them for autoradiography, and counterstained them with cresyl violet. We quantified expression of
egr-1by calculating the density of silver grains above cell bodies (number of silver grains per total cell area in pixels). Our method measures silver grain density for all cells in the field of view, which we estimated to be 350–1,250 cells per image (mean 830) for the aPPn, 485–2,535 cells per image (mean 1,322) for the OT, and 1,110–2,283 cells per image (mean 1,742) for the TL. For the aPPn, we calculated mean silver grain density of ten sequential sections (each separated by 42lm) for each subject beginning with its origin just caudal to the anterior commissure. For the OT, we calculated mean silver grain density of four sequential sections (each separated by 42lm), taking images of the left and right hemispheres separately and beginning with the most anterior sections in which the periventricular layer appeared. In the OT, we focused on the periventricular layer because it contains the cell bodies of neurons receiving incoming visual and somatosensory information. For the TL, we calculated mean silver grain density of four sections (each separated by 126lm), taking images of the left and right hemispheres separately and beginning with the origin of the TL.
We used an image analysis strategy modified from published reports [42–44] as follows. We captured three images per brain section using a 403objective and digital camera (Spot Camera, Diagnostic Instruments, Sterling Heights, Michigan, United States): one with a blue filter to de-emphasize cell bodies relative to the black silver grains, a second with a green filter to emphasize cell bodies, and a third image of the glass slide next to the brain section (with blue filter) to quantify the background density of silver grains. We converted all images to gray scale before analysis with ImageJ (National Institutes of Health, Bethesda, Maryland, United States) as follows. To measure the area covered by cells in the green image, we applied a binary threshold, filtered out small objects, measured the mean gray value of the image, and then converted that value to total cell area in pixels. We then added a 3-pixel halo to cells in the cell image in order to include silver grains near cell bodies. To quantify silver grains, we applied a binary threshold to the blue image and subtracted the binary cell image (including halo) to remove silver grains that did not occur above or near cell bodies. We then counted particles. For the blue background image, we similarly counted particles and calculated the area covered by silver grains without subtracting the binary cell image. We then calculated silver grain density per total cell area and subtracted from this the silver grain density of the background image. In the figures, egr-1 expression levels are represented as silver grains per cell area in pixels multiplied by 1,000.
Double-label ISH for egr-1 and GnRH1. To localize GnRH1 -expressing neurons and to determine whetheregr-1andGnRH1are co-expressed, we used a second series of sections for a double-label ISH combining isotopic(egr-1)with digoxygenin(GnRH1)detection. OurGnRH1probe (188 base pairs, corresponding to nucleotides 18– 206) was specific toGnRH1,which codes for the hypophysiotropic GnRH in this species. As part of a separate study, we also included a digoxygenin-labeled probe for arginine vasotocin, which is expressed in cells neuroanatomically and morphologically distinct fromGnRH1 -expressing cells [45]. The procedure for double detection was similar to the ISH foregr-1alone, except for the following changes: Sections were fixed for 10 min, we included theGnRH1probe (1 ng/ll) during hybridization which was carried out at 608C, RNAse treatment was reduced to 10 min at room temperature, high stringency washes were at 608C for 20 min each (once in 50% formamide and 23SSC, twice in 0.13SSC). After the 5-min room temperature 0.13SSC wash, we proceeded with detection of the digoxygenin-labeledGnRH1probe as follows. We washed for 5 min in PBS, quenched endogenous peroxidases in 3% H2O2(10 min), washed 5 min each in PBS and
PBS with 0.3% tween (PBSTw), blocked for 30 min in blocking solution (PerkElmer, Boston, Massachusetts, United States), in-cubated with anti-digoxygenin conjugated with HRP (1:250) for 2 hr, washed twice in PBSTw (5 min), incubated in TSA (1:50; Perkin-Elmer) for 5 min, washed twice in PBSTw (5 min), incubated for 30 min in avidin-HRP (1:100), washed in PBSTw and PBS (5 min each), incubated in diaminobenzidine (0.05%) with H2O2for 5 min, washed twice in PBS (5 min each), and dehydrated in increasing concentrations of alcohol. After exposure to film, slides were dipped in emulsion (1:1 dilution in distilled water; Kodak, New Haven, Connecticut, United States) and stored for 4.5 d before developing and counterstaining with cresyl violet. Sections that were hybridized with a sense probe did not show binding detectable above background.
To quantify the distribution ofGnRH1-expressing neurons in the aPPn, we used a 1003objective to identify and count the total number of GnRH1 neurons in each section. In addition, to assess the degree of double-labeling ofGnRH1andegr-1,we counted the number of silver grains aboveGnRH1-expressing neurons among ascending males. We used a threshold of five silver grains, at or above which we counted a GnRH1 neuron as expressingegr-1. However, due to a problem with the emulsion separating from some slides, we were unable to assess the degree of double-labeling in stable subordinate or dominant males.
Statistics.To test for differences in the rate of specific behaviors, we used an analysis of variance (ANOVA) for each behavior separately (chase, threaten, court, and enter spawning site) followed by multiple pairwise t-tests. To determine the effect of social suppression on testes size, we compared stable dominant males to males that were suppressed (stable subordinates and ascending males) using ANOVA. We used three two-way repeated measures ANOVAs to test for an effect of social opportunity onegr-1levels in the aPPn, OT, and TL, with group as a between-subjects factor and section number as the within-subjects factor. The main effect for group compares meanegr-1 levels across groups whereas the interaction (group3section) determines whether this induction pattern varied neuroanatomically. To determine in which sections ascending males showedegr-1induction in the aPPn, we compared ascending males to stable males (dominants and subordinates considered together) using a repeated-measures ANOVA with least significant difference post hoc contrasts. Among ascending males, we used Pearson’s correlation to assess the relationship between aPPn egr-1 levels and GnRH1 neuron number in corresponding sections. All ANOVAS used Type III sums of squares, and for all statistical tests we evaluated the likelihood of an effect using thep-value.
Supporting Information
Accession NumbersThe GenBank (http://www.ncbi.nlm.nih.gov/Genbank) accession num-bers for the genes and genetic material discussed in this paper are egr-1 mRNA (AY493348), GnRH1 mRNA (U31865), GnRH1 gene (AF076961),GnRH2gene (AF076962), andGnRH3gene (AF076963).
Acknowledgments
We thank Dr. Anna K. Greenwood for insight during the course of the study and manuscript preparation. We thank Ms. Vinita Kailasanath for assistance with behavioral analysis. Supported by National Institutes of Health (NIH) NS42984 to SSB, National Science Foundation Waterman Award to EDJ, and NIH J. Javits Award NS34950 to RDF.
Competing interests.The authors have declared that no competing interests exist.
Author contributions.SSB, EDJ, and RDF conceived and designed the experiments. SSB performed the experiments. SSB analyzed the data. RDF contributed reagents/materials/analysis tools. SSB, EDJ, and RDF wrote the paper. &
References
1. Abbott DH, Saltzman W, Schultz-Darken NJ, Tannenbaum PL (1998) Adaptations to subordinate status in female marmoset monkeys. Comp Biochem Physiol C Pharmacol Toxicol Endocrinol 119: 261–274. 2. Faulkes CG, Bennett NC (2001) Family values: Group dynamics and social
control of reproduction in African mole-rats. Trends Ecol Evol 16: 184–190. 3. Fraley NB, Fernald RD (1982) Social control of developmental rate in the
African cichlid fish,Haplochromis burtoni. Z Tierpsychol 60: 66–82.
4. Kozorovitskiy Y, Gould E (2004) Dominance hierarchy influences adult neurogenesis in the dentate gyrus. J Neurosci 24: 6755–6759.
5. Hofmann HA, Benson ME, Fernald RD (1999) Social status regulates growth rate: Consequences for life-history strategies. Proc Natl Acad Sci U S A 96: 14171–14176.
6. Abbott DH, Keverne EB, Bercovitch FB, Shively CA, Mendoza SP, et al. (2003) Are subordinates always stressed? A comparative analysis of rank differences in cortisol levels among primates. Horm Behav 43: 67–82.
7. Fox HE, White SA, Kao MHF, Fernald RD (1997) Stress and dominance in a social fish. J Neurosci 17: 6463–6469.
8. Gore AC (2002) Gonadotropin-releasing hormone (GnRH) neurons: Gene expression and neuroanatomical studies. Prog Brain Res 141: 193–208. 9. Davis MR, Fernald RD (1990) Social control of neuronal soma size. J
Neurobiol 21: 1180–1188.
10. Francis RC, Soma K, Fernald RD (1993) Social regulation of the brain-pituitary-gonadal axis. Proc Natl Acad Sci U S A 90: 7794–7798. 11. White SA, Nguyen T, Fernald RD (2002) Social regulation of
gonadotropin-releasing hormone. J Exp Biol 205: 2567–2581.
12. Greenwood AK, Fernald RD (2004) Social regulation of the electrical properties of gonadotropin-releasing hormone neurons in a cichlid fish
(Astatotilapia burtoni). Biol Reprod 71: 909–918.
13. Soma KK, Francis RC, Wingfield JC, Fernald RD (1996) Androgen regulation of hypothalamic neurons containing gonadotropin-releasing hormone in a cichlid fish: integration with social cues. Horm Behav 30: 216–226.
14. White SA, Fernald RD (1993) Gonadotropin-releasing hormone-containing neurons change size with reproductive state in femaleHaplochromis burtoni. J Neurosci 13: 434–441.
15. Bushnik TL, Fernald RD (1995) The population of GnRH-containing neurons showing socially mediated size changes project to the pituitary in a teleost,Haplochromis burtoni. Brain Behav Evol 46: 371–377.
16. Kauffman AS, Rissman EF (2004) A critical role for the evolutionarily conserved gonadotropin-releasing hormone II: Mediation of energy status and female sexual behavior. Endocrinol 145: 3639–3646.
17. Rissman EF (1992) Mating induces puberty in the musk shrew. Biol Reprod 47: 473–477.
18. Knapska E, Kaczmarek L (2004) A gene for neuronal plasticity in the mammalian brain: Zif268/Egr-1/NGFI-A/Krox-24/TIS8/ZENK? Prog Neuro-biol 74: 183–211.
19. Clayton DF (2000) The genomic action potential. Neurobiol Learn Mem 74: 185–216.
20. Mello CV (2004) Gene regulation by song in the auditory telencephalon of songbirds. Front Biosci 9: 63–73.
21. O’Donovan KJ, Tourtellotte WG, Millbrandt J, Baraban JM (1999) The EGR family of transcription-regulatory factors: Progress at the interface of molecular and systems neuroscience. Trends Neurosci 22: 167–173. 22. Jarvis ED, Nottebohm F (1997) Motor-driven gene expression. Proc Natl
Acad Sci U S A 94: 4097–4102.
23. Jarvis ED, Mello CV, Nottebohm F (1995) Associative learning and stimulus novelty influence the song-induced expression of an immediate early gene in the canary forebrain. Learn Mem 2: 62–80.
24. Jarvis ED, Scharff C, Grossman MR, Ramos JA, Nottebohm F (1998) For whom the bird sings: Context-dependent gene expression. Neuron 21: 775– 788.
25. Burmeister SS, Fernald RD (2005) Evolutionary conservation of the egr-1 immediate-early gene response in a teleost. J Comp Neurol 481: 220–232. 26. White SA, Kasten TL, Bond CT, Adelman JP, Fernald RD (1995) Three
gonadotropin-releasing hormone genes in one organism suggest novel roles for ancient peptide. Proc Natl Acad Sci U S A 92: 8363–8367. 27. Virolle T, Adamson ED, Baron V, Birle D, Mercola D, et al. (2001) The Egr-1
transcription factor directly activates PTEN during irradiation-induced signalling. Nat Cell Biol 3: 1124–1128.
28. White RB, Fernald RD (1998) Genomic structure and expression sites of three gonadotropin-releasing hormone genes in one species. Gen Comp Endocrinol 112: 17–25.
29. Leiser JK, Itzkowitz M (1999) The benefits of dear enemy recognition in three-contender convict cichlid(Cichlasoma nigrofasciatum)contests. Behav-iour 136: 983–1003.
30. Fostman P, Sherman PT (2003) Behavioral response to familiar and unfamiliar neighbors in a territorial cichlid,Neolamprologus pulcher. Ichthyol Res 51: 283–285.
31. Mello C, Nottebohm F, Clayton D (1995) Repeated exposure to one song leads to a rapid and persistent decline in an immediate early gene’s response to that song in zebra finch telencephalon. J Neurosci 15: 6919– 6925.
32. Wilczynski W, Allison JD, Marler CA (1993) Sensory pathways linking social and environmental cues to endocrine control regions of amphibian forebrains. Brain Behav Evol 42: 252–264.
33. Riters LV, Teague DP, Schroeder MB, Cummings SE (2004) Vocal production in different social contexts relates to variation in immediate early gene immunoreactivity within and outside of the song control system. Behav Brain Res 155: 307–318.
34. Sockman KW, Gentner TQ, Ball GF (2005) Complementary neural systems for the experience-dependent integration of mate-choice cues in the European starling. J Neurobiol 62: 72–81.
35. Sockman KW, Gentner TQ, Ball GF (2002) Recent experience modulates forebrain gene-expression in response to mate-choice cues in European starlings. Proc R Soc Lond B Biol Sci 269: 2479–2485.
36. Thiel G, Schoch S, Petersohn D (1994) Regulation of synapsin I gene expression by the zinc finger transcription factor zif268/egr-1. J Biol Chem 269: 15294–15301.
37. Petersohn D, Schoch S, Brinkmann DR, Thiel G (1995) The human synapsin II gene promoter. Possible role for the transcription factor zif268/egr-1, polyoma enhancer activator 3, and AP2. J Biol Chem 270: 24361–24369. 38. Burmeister SS, Wilczynski W (2005) Social signals regulate
gonadotropin-releasing hormone neurons in the green treefrog. Brain Behav Evol 65: 26– 32.
39. Cheng MF, Peng JP, Johnson P (1998) Hypothalamic neurons preferentially respond to female nest coo stimulation: Demonstration of direct acoustic stimulation of luteinizing hormone release. J Neurosci 18: 5477–5489. 40. Rissman EF, Li X (2000) Olfactory bulbectomy blocks mating-induced
ovulation in musk shrews(Suncus murinus). Biol Reprod 62: 1052–1058. 41. Fernald RD (1977) Quantitative behavioural observations ofHaplochromis
burtoniunder semi-natural conditions. Anim Behav 25: 643–653. 42. Mize RR (1994) Quantitative image analysis for immunocytochemistry and
in situ hybridization. J Neurosci Methods 54: 219–237.
43. Masseroli M, Bollea A, Bendotti C, Forloni G (1993) In situ hybridization histochemistry quantification: Automatic count on single cell in digital image. J Neurosci Methods 47: 93–103.
44. Lucas LR, Mize RR, Harlan RE (1994) Semiquantitative analysis of in-situ hybridization results using IMAGE software: A rapid method for counting reduced silver grains over mRNA–positive cells. J Neurosci Methods 52: 101–109.