ACPD
12, 18817–18851, 2012Variability in tropical upwelling and correlations with
tracers
M. Abalos et al.
Title Page
Abstract Introduction
Conclusions References
Tables Figures
◭ ◮
◭ ◮
Back Close
Full Screen / Esc
Printer-friendly Version Interactive Discussion
Discussion
P
a
per
|
Dis
cussion
P
a
per
|
Discussion
P
a
per
|
Discussio
n
P
a
per
|
Atmos. Chem. Phys. Discuss., 12, 18817–18851, 2012 www.atmos-chem-phys-discuss.net/12/18817/2012/ doi:10.5194/acpd-12-18817-2012
© Author(s) 2012. CC Attribution 3.0 License.
Atmospheric Chemistry and Physics Discussions
This discussion paper is/has been under review for the journal Atmospheric Chemistry and Physics (ACP). Please refer to the corresponding final paper in ACP if available.
Variability in upwelling across the tropical
tropopause and correlations with tracers
in the lower stratosphere
M. Abalos1, W. J. Randel2, and E. Serrano1
1
Depto. de Geof´ısica y Meteorolog´ıa, Universidad Complutense de Madrid, Madrid, Spain
2
National Center for Atmospheric Research, Boulder, Colorado, USA Received: 12 July 2012 – Accepted: 18 July 2012 – Published: 31 July 2012 Correspondence to: M. Abalos ([email protected])
Published by Copernicus Publications on behalf of the European Geosciences Union.
ACPD
12, 18817–18851, 2012Variability in tropical upwelling and correlations with
tracers
M. Abalos et al.
Title Page
Abstract Introduction
Conclusions References
Tables Figures
◭ ◮
◭ ◮
Back Close
Full Screen / Esc
Printer-friendly Version Interactive Discussion
Discussion
P
a
per
|
Dis
cussion
P
a
per
|
Discussion
P
a
per
|
Discussio
n
P
a
per
|
Abstract
Temporal variability of the upwelling near the tropical tropopause on daily to annual timescales is investigated using three different estimates computed from the ERA-Interim reanalysis. These include upwelling archived by the reanalysis, plus estimates derived from thermodynamic and momentum balance calculations. Substantial vari-5
ability in upwelling is observed on both seasonal and sub-seasonal time scales, and the three estimates show reasonably good agreement. Tropical upwelling should ex-ert strong influence on temperatures and on tracers with large vex-ertical gradients in the lower stratosphere. We test this behavior by comparing the calculated upwelling estimates with observed temperatures in the tropical lower stratosphere, and with 10
measurements of ozone and carbon monoxide (CO) from the Aura Microwave Limb Sounder (MLS) satellite instrument. Time series of temperature, ozone and CO are well correlated in the tropical lower stratosphere, and we quantify the influence of trop-ical upwelling on this joint variability. Strong coherent annual cycles observed in each quantity are found to reflect the seasonal cycle in upwelling. Statistically significant cor-15
relations between upwelling, temperatures and tracers are also found for sub-seasonal timescales, demonstrating the importance of upwelling in forcing transient variability in the lower tropical stratosphere.
1 Introduction
The mean circulation in the tropical lower stratosphere is characterized by upwelling, 20
which transports air masses across the tropical tropopause into the lower stratosphere. This constitutes the ascending branch of the global mean stratospheric circulation, which is completed by poleward flow in each hemisphere and subsidence at high lati-tudes (i.e. the so-called Brewer-Dobson circulation, Brewer, 1949; Dobson, 1956). This wave-driven circulation strongly influences the chemical composition and thermody-25
ACPD
12, 18817–18851, 2012Variability in tropical upwelling and correlations with
tracers
M. Abalos et al.
Title Page
Abstract Introduction
Conclusions References
Tables Figures
◭ ◮
◭ ◮
Back Close
Full Screen / Esc
Printer-friendly Version Interactive Discussion
Discussion
P
a
per
|
Dis
cussion
P
a
per
|
Discussion
P
a
per
|
Discussio
n
P
a
per
|
role of tropical upwelling in the stratospheric circulation, there are significant uncer-tainties regarding its intensity and variability and the associated forcing mechanisms. Due to its small magnitude (∼10−4m s−1) and the lack of direct measurements, lower stratospheric tropical upwelling is poorly constrained in current meteorological analysis systems; for example, Iwasaki et al. (2009) show substantial discrepancies in upwelling 5
among different reanalysis data sets. Alternatively, the tropical upwelling has been es-timated indirectly using thermodynamic balance (Gille et al., 1987; Rosenlof, 1995), momentum balance (Randel et al., 2002), and via variations in tracer concentration such as water vapor (e.g. Mote et al., 1996; Niwano et al., 2006; Schoeberl et al., 2008b). Observations show that fluctuations in tropical upwelling have an impact on 10
the thermal and chemical behavior of the tropical tropopause layer (TTL), a transition region characterized by strong dynamical and chemical vertical gradients (Fueglistaler et al., 2009a). For instance, the strong annual cycle in temperature observed above the tropical tropopause is linked to the seasonality of the Brewer-Dobson circulation (Reed and Vlcek, 1969; Yulaeva et al., 1994). Randel et al. (2002) show that the ver-15
tical structure of the amplitude of the temperature annual cycle (peaking near 70 hPa) is consistent with the long radiative time scales in this region. They also highlight that sub-seasonal variations in temperature and tropical upwelling are closely coupled.
High vertical resolution observations in the lower stratosphere also reveal a large annual cycle in ozone confined to a narrow region above the tropical tropopause (Lo-20
gan, 1999; Folkins et al., 2006; Randel et al., 2007). Folkins et al. (2006) reproduce quite successfully the observed annual cycle by using a simple model including sea-sonal variations in tropical upwelling and in high altitude convective outflow. Using ozonesonde and satellite observations Randel et al. (2007) show that the temporal phasing and vertical structure of the ozone seasonal cycle can be explained by the 25
seasonality in tropical upwelling acting on the strong background ozone vertical gradi-ent. They also note that the seasonal cycle in ozone is approximately in phase with the temperature cycle, and both amplitudes show a very similar vertical structure. Schoe-berl et al. (2008a) observe that there is almost no phase shift of the annual cycle in
ACPD
12, 18817–18851, 2012Variability in tropical upwelling and correlations with
tracers
M. Abalos et al.
Title Page
Abstract Introduction
Conclusions References
Tables Figures
◭ ◮
◭ ◮
Back Close
Full Screen / Esc
Printer-friendly Version Interactive Discussion
Discussion
P
a
per
|
Dis
cussion
P
a
per
|
Discussion
P
a
per
|
Discussio
n
P
a
per
|
ozone with height in the lower tropical stratosphere, and this is consistent with sea-sonal variations in upwelling driving annual variations in ozone. In addition, Folkins et al. (2006), Randel et al. (2007) and Schoeberl et al. (2008a) analyze the annual cy-cle in carbon monoxide (CO) observed in this region, and conclude that the upwelling also has a dominant role in forcing this cycle (because of the strong background ver-5
tical gradient above the tropopause). Furthermore, it has been suggested that a com-prehensive understanding of thermal behavior in this region must include a feedback of the ozone radiative effects on temperature (Chae and Sherwood, 2007; Fueglistaler et al., 2011). While there is general agreement on the origin of the annual cycle in tem-perature above the tropical tropopause, there is still controversy on the primary forcing 10
mechanism(s) of the observed annual cycle in tracer concentrations (ozone and CO). For instance, Konopka et al. (2010) and Ploeger et al. (2012) suggest that mixing of air from the extra-tropics into the TTL makes a major contribution to the seasonal cy-cle in ozone concentration above the tropical tropopause. In particular, they propose that horizontal transport associated with the upper-level circulation of the Asian mon-15
soon plays a dominant role in building the ozone maximum observed in boreal sum-mer. This result, based on simulations with the Chemistry Lagrangian Transport Model of the Stratosphere (CLaMS), is in contrast with the view that the seasonal cycle in ozone is mainly forced by tropical upwelling (e.g. Randel et al., 2007). In addition to the seasonal cycle, high-temporal resolution satellite measurements of ozone and CO 20
reveal variability on sub-seasonal timescales in this region. The analysis of these faster variations can provide complementary information on the relative roles of the different forcing mechanisms.
The aim of the present study is to investigate the relationships between tropical up-welling variability and the fluctuations in temperature and the concentrations of ozone 25
ACPD
12, 18817–18851, 2012Variability in tropical upwelling and correlations with
tracers
M. Abalos et al.
Title Page
Abstract Introduction
Conclusions References
Tables Figures
◭ ◮
◭ ◮
Back Close
Full Screen / Esc
Printer-friendly Version Interactive Discussion
Discussion
P
a
per
|
Dis
cussion
P
a
per
|
Discussion
P
a
per
|
Discussio
n
P
a
per
|
temperature, ozone and CO in terms of coherence with upwelling, focusing separately on seasonal and sub-seasonal time scales.
2 Data and upwelling calculations
2.1 Satellite and meteorological data
Observations from the Microwave Limb Sounder (MLS) onboard the Aura satellite (Wa-5
ters et al., 2006) cover now more than seven years (starting September 2004). We use zonal mean daily averaged measurements of ozone and CO for the period September 2004 to December 2010 on a 7.5◦latitude grid, and analyze the time series averaged over the latitude band±18.75◦. This band is representative of the width of the tropics in the lowermost stratosphere, based on the auto- and cross-correlations of temperature, 10
upwelling and tracers near the equator with other latitudes. There are three pressure levels within the tropical tropopause layer at which MLS measures carbon monoxide (147, 100 and 68 hPa) and five for ozone (147, 121, 100, 83 and 68 hPa). The vertical resolution of the MLS ozone is approximately 3 km (Froidevaux et al., 2006), while the resolution for CO is 4.5 km (Livesey et al., 2008). The present study focuses on the 15
effect of tropical upwelling at and above the tropical tropopause, so only the levels of 100 hPa and above are considered.
Upwelling estimates are derived from temperature and wind fields from the ERA-Interim reanalysis (Dee et al., 2011) generated at the European Centre for Medium-Range Weather Forecasts (ECMWF), with calculations described below. In view of 20
the results of Seviour et al. (2011), who show large diurnal variability in ERA-Interim upwelling results, we compute daily averages from 6-hourly data. The meteorologi-cal data is archived on 60 vertimeteorologi-cal levels, with a horizontal resolution of 1.5◦×1.5◦. The ERA-Interim reanalysis has been shown to provide an improved representation of the stratospheric Brewer-Dobson circulation and age of air compared to the previ-25
ous ECMWF reanalysis, ERA-40 (Monge-Sanz et al., 2007; Fueglistaler et al., 2009b).
ACPD
12, 18817–18851, 2012Variability in tropical upwelling and correlations with
tracers
M. Abalos et al.
Title Page
Abstract Introduction
Conclusions References
Tables Figures
◭ ◮
◭ ◮
Back Close
Full Screen / Esc
Printer-friendly Version Interactive Discussion
Discussion
P
a
per
|
Dis
cussion
P
a
per
|
Discussion
P
a
per
|
Discussio
n
P
a
per
|
Iwasaki et al. (2009) and Seviour et al. (2011) show that ERA-Interim yields less noisy Brewer-Dobson circulation compared to other reanalyses. We choose pressure lev-els for this analysis of 100, 80 and 70 hPa, to nearly match the levlev-els of constituent observations (broad layers centered at 100, 83 and 68 hPa).
Time series of tropical zonal mean temperatures in the lower stratosphere from the 5
ERA-Interim data are shown in Fig. 1 (averaged over 18◦N–S), together with ozone and CO concentrations from MLS as described above. Each of the time series in Fig. 1 is standardized to unit variance, and CO is plotted on an inverted scale. The results in Fig. 1 show coherence among the time series of reanalysis temperatures and the completely independent satellite constituent observations. The common variability is 10
especially evident in the large annual cycles, which are approximately in phase over the three pressure levels (with the – inverted – minimum in CO having a time lag of
∼2 months compared to the maxima in temperature and ozone at 70 hPa). There is an additional semi-annual component evident for CO at 100 hPa, related to season-ally dependent tropospheric sources and convective transport, as discussed further in 15
Sect. 3. There is also evidence for correlated sub-seasonal variability in Fig. 1, sug-gesting that these variations share a common forcing. In this study we examine the role of the tropical upwelling variability in forcing these joint fluctuations of temperature, ozone and CO.
2.2 Upwelling calculations 20
Three different estimates of zonal average tropical upwelling are obtained using the temperature and wind fields from ERA-Interim, including direct upwelling from the re-analysis, and estimates calculated from thermodynamic and momentum balances. The details of these latter calculations can be found in Randel et al. (2002); here we focus on highlighting the main uncertainties associated with each estimate. The first, which 25
ACPD
12, 18817–18851, 2012Variability in tropical upwelling and correlations with
tracers
M. Abalos et al.
Title Page Abstract Introduction Conclusions References Tables Figures ◭ ◮ ◭ ◮ Back Close
Full Screen / Esc
Printer-friendly Version Interactive Discussion Discussion P a per | Dis cussion P a per | Discussion P a per | Discussio n P a per |
in Andrews et al. (1987):
¯
w∗≡w¯ +a 1 cosϕ
∂
∂ϕ cosϕ v′T′
S
!
(1)
whereS is the static stability parameter, S=HN2/R, a function of the Brunt-V ¨ais ¨al ¨a frequency (N), with H=7 km and R=287 m2s−2K−1, and the rest of the notation is the same as in Andrews et al. (1987). In the deep tropics the v′T′ term in Eq. (1) is
5
small, so that ¯w∗primarily depends on the reanalysis zonal mean vertical velocity ( ¯w). Although one of the major improvements in this third-generation reanalysis compared to its predecessor ERA-40 is the weaker and hence more realistic stratospheric circu-lation (Dee et al., 2011), there are still large uncertainties in this magnitude, especially near the tropical tropopause.
10
The second estimate is calculated from the momentum balance using the expres-sion (11) in Randel et al. (2002), obtained combining the TEM momentum and conti-nuity equations:
hw¯m∗i(z)= −e z/H
cosϕ ϕ0
R
−ϕ0
acosϕd ϕ
∞ Z z
e−z′/H ˆ f(ϕ,z′)
DF (ϕ,z′)−u¯t(ϕ,z′)
¯
mdz
′
ϕ0
−ϕ0
(2)
Here DF is the scaled Eliassen-Palm flux divergence, ˆf =f(1/acosϕ)(∂/∂ϕ)( ¯ucosϕ), 15
wheref is the Coriolis parameter, and ¯ut is the zonal mean zonal wind tendency. This expression gives the tropical upwelling at a fixed pressure level and averaged over a latitudinal band (±ϕ0) which is in balance with the circulation and eddy forcing cal-culated from the reanalysis. To simplify the calculations, the integrand is computed on constant latitudes instead of along isolines of constant zonal mean angular momen-20
tum, since at the latitudinal boundaries we use (±18◦) these isolines are approximately vertical. The divergence of the Eliassen-Palm flux includes eddy fluxes calculated from
ACPD
12, 18817–18851, 2012Variability in tropical upwelling and correlations with
tracers
M. Abalos et al.
Title Page
Abstract Introduction
Conclusions References
Tables Figures
◭ ◮
◭ ◮
Back Close
Full Screen / Esc
Printer-friendly Version Interactive Discussion
Discussion
P
a
per
|
Dis
cussion
P
a
per
|
Discussion
P
a
per
|
Discussio
n
P
a
per
|
the three-dimensional temperature and wind fields from the reanalysis, such that a key uncertainty in the calculation of ¯wm∗ is associated with the unresolved waves that are not taken into account in these fluxes. As a note, the model simulations in Garcia and Ran-del (2008) and Calvo and Garcia (2009) suggest that, for the range of latitude/altitude considered here, resolved waves explain most of the upwelling.
5
The third estimate of upwelling is derived by iteratively solving the TEM thermody-namic equation (Eq. 4 below) neglecting the eddy transport term (last term on the right hand side in Eq. 4) and the TEM continuity equation:
1 acosϕ
∂ ∂ϕ( ¯v
∗cosϕ)
+ez/H ∂ ∂z
¯
w∗e−z/H=0 (3)
following the procedures described in Rosenlof (1995). In this calculation one relevant 10
source of uncertainty is associated to the heating rates (Q) in the thermodynamic equa-tion. For levels at and above 100 hPa, radiative heating is the primary diabatic forcing, and hence ¯wQ∗ can be estimated using an accurate radiative heating code. We use the heating rates from the National Center for Atmospheric Research Column Radiation Model (NCAR-CRM; Gettelman et al., 2004) with input of daily ERA-Interim tempera-15
tures and MLS ozone. The annual mean heating rates provided by this model agree reasonably well with other estimates near the tropical tropopause in terms of the mag-nitude and the vertical structure (Gettelman et al., 2004). Also the seasonality in our calculations is consistent with that shown in Yang et al. (2008), with highest values in DJF and lowest in JJA. Our results are∼0.1 K day−1higher in the annual mean com-20
pared to Yang et al. (2008), but this difference is within the range of uncertainty defined by the spread of a set of five different estimates shown in Gettelman et al. (2004). A more relevant difference is that our calculations do not result in near-zero heating rates during NH summer across∼70 to 50 hPa, as shown in Yang et al. (2008). As a consequence, the amplitude of the seasonal cycle in our heating rates over these 25
ACPD
12, 18817–18851, 2012Variability in tropical upwelling and correlations with
tracers
M. Abalos et al.
Title Page
Abstract Introduction
Conclusions References
Tables Figures
◭ ◮
◭ ◮
Back Close
Full Screen / Esc
Printer-friendly Version Interactive Discussion
Discussion
P
a
per
|
Dis
cussion
P
a
per
|
Discussion
P
a
per
|
Discussio
n
P
a
per
|
near-zero downward net mass flux outside the tropics in order to satisfy mass conti-nuity. Finally, we note that our calculations do not include the effects of clouds on the radiative balance. However, according to Yang et al. (2010), the net effect of clouds on the zonal mean heating rates in the tropics is relatively small (≤ −0.05 K day−1) at and above the tropical tropopause.
5
One aspect of the ¯wQ∗ calculations is that the computed vertical velocities may not satisfy the constraint of zero net mass flux across a pressure surface (Rosenlof, 1995). Hence, the calculated vertical velocities require some adjustment to enforce this con-straint, although the method of making this adjustment is arbitrary. Figure 2 shows a comparison of the latitudinal profile of the three estimates of upwelling, for the annual 10
mean of the entire period. Two different calculations of ¯wQ∗ are also included, based on making a constant adjustment independent of latitude or only adjusting values over 45◦N–S. The different adjustments yield very similar values of ¯wQ∗ at 70 hPa, but larger variations are found at lower levels, where the adjustment focused over low latitudes provides smaller values of upwelling. This could be related to the relatively larger con-15
tribution of the eddy term in the thermodynamic balance (Eq. 4) at these lower levels, which is confined to low latitudes (results based on analysis of ERA-Interim data and WACCM model output; not shown here). The eddy term is neglected in our calcula-tions of ¯wQ∗, and this is a source of biases for this estimate (particularly at 80 hPa, where this term is largest), as further discussed in Sect. 3.1. By adjusting ¯wQ∗ only in 20
the range 45◦N–S we partly account for these larger biases at low latitudes, and this is the ¯wQ∗ used throughout the rest of this work. On the other hand, the vertical veloc-ity can be obtained from momentum balance everywhere except in the deep tropics, where ˆf =f−∂u/∂y¯ →0, and hence Eq. (2) yields a constant value for ¯wm∗ throughout the width of the tropics (±18◦), as shown in Fig. 2.
25
2.3 Comparisons of upwelling estimates
The time average comparisons in Fig. 2 show overall agreement in the magnitude and latitudinal structure of all the estimates, with the upwelling from reanalysis, ¯w∗, showing
ACPD
12, 18817–18851, 2012Variability in tropical upwelling and correlations with
tracers
M. Abalos et al.
Title Page
Abstract Introduction
Conclusions References
Tables Figures
◭ ◮
◭ ◮
Back Close
Full Screen / Esc
Printer-friendly Version Interactive Discussion
Discussion
P
a
per
|
Dis
cussion
P
a
per
|
Discussion
P
a
per
|
Discussio
n
P
a
per
|
somewhat stronger tropical upwelling compared to ¯wm∗ and ¯wQ∗, especially at 100 hPa. Time series of each of the upwelling estimates averaged over 18◦N–S are shown in Fig. 3 for pressure levels 100, 80 and 70 hPa. This figure also shows corresponding mean seasonal cycles, calculated as monthly averages over the entire data record. The time series in Fig. 3 show overall good agreement in the magnitude and seasonal 5
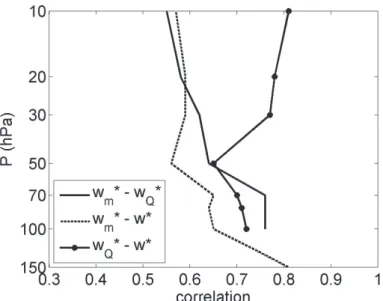
variation of the three upwelling estimates, especially between ¯wm∗ and ¯wQ∗. Inspection of the time series reveals strong similarities among the three estimates, showing numer-ous common fluctuations on a wide range of timescales. Note that the good agreement between ¯wm∗ and ¯wQ∗ suggests that ¯wm∗ may be accurately calculated from resolved fluxes alone. Correlations between the different estimates are shown in Fig. 4. The 10
correlations among ¯w∗, ¯wm∗ and ¯wQ∗ in the tropical lower stratosphere are around 0.64– 0.76. These fairly high correlations between the estimates are encouraging, given the uncertainties described above and the very different approaches followed to compute them. The degree of agreement among these estimates reflects an overall good un-derstanding of the seasonal and sub-seasonal variability in tropical upwelling.
15
3 Co-variations of upwelling, temperatures and tracers
Our hypothesis is that the strong correlation between temperatures and tracers in the tropical lower stratosphere (Fig. 1) results primarily from forcing by tropical upwelling. The origin of this coupling can be appreciated by examining the zonal mean thermo-dynamic and tracer mixing ratio continuity equations in the TEM formalism (Andrews 20
et al., 1987):
∂T¯ ∂t =−v¯
∗1
a ∂T¯ ∂ϕ−w¯
∗S
+Q¯− 1
e−z/H
"
e−z/H v′T′∂T /∂ϕ¯
a·S +w
′T′ !#
z
(4)
∂χ¯ ∂t =−v¯
∗1
a ∂χ¯ ∂ϕ−w¯
∗∂χ¯
ACPD
12, 18817–18851, 2012Variability in tropical upwelling and correlations with
tracers
M. Abalos et al.
Title Page
Abstract Introduction
Conclusions References
Tables Figures
◭ ◮
◭ ◮
Back Close
Full Screen / Esc
Printer-friendly Version Interactive Discussion
Discussion
P
a
per
|
Dis
cussion
P
a
per
|
Discussion
P
a
per
|
Discussio
n
P
a
per
|
In the continuity Eq. (5), ¯χ represents the zonal mean mixing ratio of the tracer,∇ ·M
is an eddy transport term (as in Andrews et al., 1987, Eq. 9.4.13) and P −L is the chemical production minus loss rate. Averaging over the tropics and for a given pres-sure level, these equations state that the changes in tropical mean temperature or tracer concentration arise from the combined effects of meridional and vertical advec-5
tion by the residual mean circulation (that is, mean meridional transport to/from the extra-tropics and upwelling acting on the background vertical gradient), eddy diffusive transport and diabatic heating in the case of temperature or chemical sources/sinks for tracers. Equations (4) and (5) form the basis for our analysis of temperature and tracer coupling with mean tropical upwelling, and we focus separately on the seasonal cycle 10
and sub-seasonal variations seen in Figs. 1 and 3.
3.1 Seasonal cycles
In order to evaluate the relative contribution of the different forcings to the seasonal cy-cles of temperature, ozone and CO, we analyze the monthly means for the entire period (2005–2010) of all the terms in Eqs. (4) and (5). Figure 5 shows the seasonal average 15
thermodynamic balance, after averaging Eq. (4) over a latitudinal band of±18◦, using the estimate of ¯wQ∗ for mean upwelling. ¯Qis calculated from the radiative heating code as described in Sect. 2.2.
The primary thermodynamic balance in the tropical lower stratosphere in Fig. 5 is between upwelling (adiabatic cooling) and radiative heating (i.e. ¯wQ∗S∼Q¯). The tem-20
perature tendency is a relatively small component of the balance, and the meridional advection term is negligible. We have included the eddy term in Fig. 5 (derived from the ERA-Interim eddy fields), even though it is not used to compute ¯wQ∗, as explained in Sect. 2.2. This term shows a maximum in the tropics near 80 hPa, which is mainly associated to the vertical convergence of the vertical eddy heat flux (w′T′) in Eq. (4).
25
There are small residuals in Fig. 5 at 70 hPa (where the eddy term is almost zero) and 100 hPa, indicating that the magnitude and seasonality of the computed estimate
¯
ACPD
12, 18817–18851, 2012Variability in tropical upwelling and correlations with
tracers
M. Abalos et al.
Title Page
Abstract Introduction
Conclusions References
Tables Figures
◭ ◮
◭ ◮
Back Close
Full Screen / Esc
Printer-friendly Version Interactive Discussion
Discussion
P
a
per
|
Dis
cussion
P
a
per
|
Discussion
P
a
per
|
Discussio
n
P
a
per
|
hand, at 80 hPa the residual approximately mirrors the relatively large negative eddy term. This implies that, as a result of neglecting the eddies in the thermodynamic equa-tion, the magnitude of the computed upwelling is overestimated at 80 hPa (by about
∼0.15 mm s−1). Nevertheless, it should be borne in mind that the vertical eddy heat flux (w′T′) in Fig. 5 is likely subject to large uncertainties associated to the
reanaly-5
sis eddy vertical velocity anomalies. The overall balances are similar if ¯wm∗ or ¯w∗ are used instead of ¯wQ∗, although larger residuals are derived when using ¯w∗ (especially at 100 hPa). The interpretation of the ¯wQ∗S∼Q¯ balance is that upwelling forces tropical temperatures below radiative equilibrium ( ¯Teq), and the atmosphere responds locally by longwave radiative heating. This radiative heating is due primarily to the effects of 10
CO2(e.g. Thuburn and Craig, 2000; Gettelman et al., 2004), and ¯Qcan be reasonably approximated in this region by Newtonian cooling: ¯Q∼ −αrad T¯ −T¯eq
, where αrad is an inverse radiative relaxation time scale and ¯Teq is a background radiative equilibrium temperature. The seasonal variations in upwelling are echoed in approximately mirror image variations in ¯Qat 70 and 80 hPa in Fig. 5: weaker NH summer upwelling results 15
in warmer temperatures and weaker radiative heating, and there is a slight delay in ¯
Q compared to ¯w∗ because of the ∼1–2 month radiative relaxation time scale in the lower stratosphere. The longer relaxation timescales (smallerαrad) also result in rela-tively larger temperature variations for these pressure levels (cf. Randel et al., 2002). Although the seasonal variation in upwelling at 100 hPa is around a factor of 2–2.5 20
(Fig. 3), the upwelling transport term in Fig. 5 at this level varies only∼1.5. This is because there is a seasonal cycle in static stabilityS at 100 hPa (with NH summer val-ues∼1.5 times larger than winter), so that the quantity ¯wQ∗S varies much less than ¯wQ∗ alone. This partial compensation results in smaller seasonal variations in ¯Qand∂T /∂t¯ at 100 hPa compared to higher levels.
25
ACPD
12, 18817–18851, 2012Variability in tropical upwelling and correlations with
tracers
M. Abalos et al.
Title Page
Abstract Introduction
Conclusions References
Tables Figures
◭ ◮
◭ ◮
Back Close
Full Screen / Esc
Printer-friendly Version Interactive Discussion
Discussion
P
a
per
|
Dis
cussion
P
a
per
|
Discussion
P
a
per
|
Discussio
n
P
a
per
|
from a long-term simulation using the WACCM (Whole Atmosphere Community Cli-mate Model) chemistry-cliCli-mate model (D. Kinnison, personal communication, 2011). The photochemical production in Fig. 6 shows a weak semi-annual cycle, following the solar declination in the tropics. Figure 6 also shows the residual of the calculated balance, which is a relatively large positive term at each level (∼4–5 ppbv day−1 at 5
70 hPa), and represents eddy transport terms plus uncertainties in the explicitly eval-uated terms. The presence of a significant residual in these calculations is consistent with the importance of eddy transport into the tropics (in-mixing) for the ozone bud-get, as suggested previously by Avallone and Prather (1996) using a one-dimensional model, and more recently by Konopka et al. (2010) using a three-dimensional transport 10
model. We note that the residuals in Fig. 6 do not show large annual variations, and only weak seasonality with a maximum in May–June is observed at 70 hPa.
The overall seasonal behavior of the ozone budget (Fig. 6) highlights tropical welling as a primary forcing term, with the ozone tendency closely following the up-welling term. There is strong similarity to the seasonal thermodynamic balance (Fig. 5), 15
and the dominant role of upwelling in both balances suggests that the in-phase annual cycles in ozone and temperature seen in Fig. 1 are linked as a response to the sea-sonal variation in upwelling. As in the case of temperature, the upwelling forcing on ozone has a smaller seasonal cycle at 100 hPa compared to the higher levels due to the partial cancellation between the annual cycles of tropical upwelling (largest during 20
NH winter) and ozone vertical gradient (smallest during NH winter; result not shown). In fact, the latter is very similar to the seasonal cycle of the static stability at this level.
The seasonal balance for zonal average CO at 70 hPa is shown in Fig. 7. This is the level where the relative vertical gradient in background CO is largest, and so it is anticipated that the vertical transport has a large influence on observed variabil-25
ity. In these budget calculations we have also included a chemical production minus loss term in Eq. (5) for CO; the loss is approximated by −β·CO, with β an inverse chemical damping timescale of 100 days (estimated from WACCM data), and a small chemical production term is also obtained from WACCM. The time average budget in
ACPD
12, 18817–18851, 2012Variability in tropical upwelling and correlations with
tracers
M. Abalos et al.
Title Page
Abstract Introduction
Conclusions References
Tables Figures
◭ ◮
◭ ◮
Back Close
Full Screen / Esc
Printer-friendly Version Interactive Discussion
Discussion
P
a
per
|
Dis
cussion
P
a
per
|
Discussion
P
a
per
|
Discussio
n
P
a
per
|
Fig. 7 reflects a balance between CO increase due to vertical transport and decrease due to photochemical loss. A seasonal variation of approximately a factor of 2 is found for the contribution of upwelling to the CO budget in Fig. 7 (which simply follows the annual cycle in ¯w∗), and the observed CO tendency approximately follows this sea-sonality. The photochemical loss approximately mirrors the upwelling tendency, with 5
a time lag of several months. The calculated residual is a relatively small component of the CO balance for most months, suggesting a relatively simple balance for CO in the tropical lower stratosphere. There is a larger residual during November–January in Fig. 7, which may be due to unresolved eddy transport effects or to uncertainties in calculations for the resolved terms. The seasonal CO budget at 100 hPa (not shown) 10
is dominated by the semi-annual cycle in CO concentrations seen in Fig. 1, and is somewhat more complicated than the 70 hPa results in Fig. 7. The characteristic dou-ble peak in CO in the tropical upper troposphere (seen for 100 hPa data in Fig. 1) is associated with emissions from biomass burning before the rain seasons, coupled with the semi-annual cycle in near-equatorial convection (Folkins et al., 2006; Schoeberl 15
et al., 2006; Liu et al., 2007).
3.2 Sub-seasonal variability
The time series in Fig. 1 reveal correlated variations between temperatures and tracers at timescales shorter than the annual cycle. Sub-seasonal variations in upwelling (as seen in Fig. 3) are one likely source for such correlated variability, and here we inves-20
tigate the links between upwelling and tracer variations on sub-seasonal time scales. In these analyses we focus on comparing time tendencies of temperature and tracers (i.e. ∂T /∂t¯ , ∂O3/∂t and ∂CO/∂t) with the various estimates of upwelling, following the expected relationships based on Eqs. (4) and (5).
Assuming the idealized case where for transient variations the vertical velocity 25
ACPD
12, 18817–18851, 2012Variability in tropical upwelling and correlations with
tracers
M. Abalos et al.
Title Page
Abstract Introduction
Conclusions References
Tables Figures
◭ ◮
◭ ◮
Back Close
Full Screen / Esc
Printer-friendly Version Interactive Discussion
Discussion
P
a
per
|
Dis
cussion
P
a
per
|
Discussion
P
a
per
|
Discussio
n
P
a
per
|
advection, eddy forcing, radiative or chemical forcing terms) Eqs. (4) and (5) reduce to:
∂T¯ ∂t =−w¯
∗S (6)
∂χ¯ ∂t =−w¯
∗χ¯
z (7)
with ¯χz≡∂χ /∂z¯ . These simplified equations directly relate the tendencies to ¯w∗, and 5
imply that for these idealized conditions (where ¯w∗ dominates the transport) the tem-perature and tracer tendencies are closely linked, i.e. the ratio
∂χ¯
∂t
∂T¯ ∂t
=χ¯z/S=constant (8)
(and similarly, the ratio of tendencies for different tracers are related by the ratios of their respective background vertical gradients). We note that the strong relationships 10
with upwelling are most likely to occur in the region of strongest background vertical gradients, i.e. near 70 hPa for ozone and CO (Randel et al., 2007).
In the following analyses we focus on sub-seasonal variations associated with time scales shorter than one year and longer than 6 days, isolated by harmonic analysis of the respective time series. The 6-day frequency cutoffis intended to remove the day-15
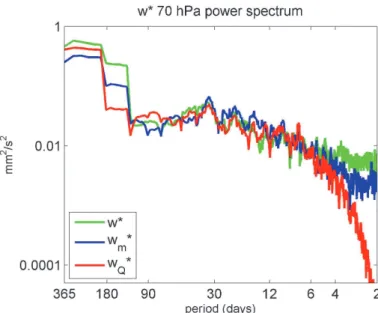
to-day variability in the different upwelling estimates, which shows large differences among the different calculations and little coherence with temperatures or tracers. In fact, the correlations in Fig. 4 increase by about∼0.1 if these high frequencies are fil-tered out. Figure 8 shows the power spectra of the three upwelling estimates at 70 hPa to illustrate the very different spectral behavior of the data at the highest frequencies, 20
motivating the high frequency (6-day) cutoff. Our detailed results are not sensitive to the exact choice of high frequency cutoff.
Figure 9 shows standardized anomalies of the temperature, ozone and CO tenden-cies at 70 hPa, together with corresponding time series of upwelling for a period of one year (2010), in order to focus on detailed sub-seasonal behavior. Visual inspection of 25
ACPD
12, 18817–18851, 2012Variability in tropical upwelling and correlations with
tracers
M. Abalos et al.
Title Page
Abstract Introduction
Conclusions References
Tables Figures
◭ ◮
◭ ◮
Back Close
Full Screen / Esc
Printer-friendly Version Interactive Discussion
Discussion
P
a
per
|
Dis
cussion
P
a
per
|
Discussion
P
a
per
|
Discussio
n
P
a
per
|
Fig. 9 shows coherent variations between∂T /∂t¯ and∂O3/∂tat 70 hPa, and somewhat lower agreement of∂CO/∂twith the other two series. Time series of the upwelling es-timates show highly coherent variations, which often show good correspondence with the temperature and tracer tendencies.
The correlations between sub-seasonal variations in upwelling and tendencies of 5
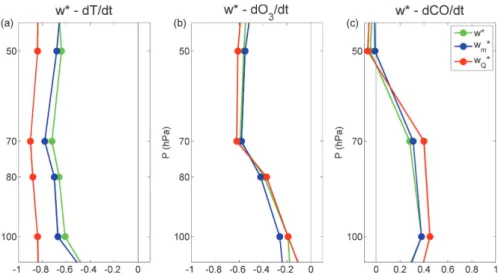
temperature and tracers are shown in Fig. 10 (calculated from data over all years 2005– 2010), for altitude levels over 100–50 hPa; these include results for each of the three different upwelling estimates. Taking into account the appropriate degrees of freedom for these data, correlations above 0.10 are significant at the 95 % level.
Temperature tendencies (Fig. 10a) show highly significant correlations with each 10
of the upwelling estimates, with small variations with altitude. Very high correlations (∼0.9) are found for ¯wQ∗, and this is expected as ¯wQ∗ is calculated using thermodynamic balance with observed ∂T /∂t¯ . Correlations of ∂T /∂t¯ with ¯wm∗ and ¯w∗ are somewhat lower but still highly significant (∼0.7), and this enhances confidence in these esti-mates.
15
Correlations between ozone tendencies and upwelling (Fig. 10b) show overall signif-icant values, with similar results for the different upwelling estimates. Largest correla-tions are found at pressure levels 70 and 50 hPa, and this is reasonable as the back-ground vertical gradient of ozone is larger at these levels. For CO tendencies (Fig. 10c), the correlations are somewhat lower compared to ozone, with a different vertical struc-20
ture that shows largest correlations at 100 and 70 hPa and almost zero at 50 hPa. It is important to note that due to the∼4.5 km vertical resolution of MLS CO observations, particular caution should be taken when drawing conclusions based upon the detailed vertical structure of CO. Also, near 50 hPa the absolute values of CO mixing ratio are very small (∼10–20 ppbv) and hence it is likely that measurements at these upper lev-25
ACPD
12, 18817–18851, 2012Variability in tropical upwelling and correlations with
tracers
M. Abalos et al.
Title Page
Abstract Introduction
Conclusions References
Tables Figures
◭ ◮
◭ ◮
Back Close
Full Screen / Esc
Printer-friendly Version Interactive Discussion
Discussion
P
a
per
|
Dis
cussion
P
a
per
|
Discussion
P
a
per
|
Discussio
n
P
a
per
|
Further confirmation that sub-seasonal variations in upwelling are driving the tracer fields is provided by comparing the observed ratios of tracer versus temperature ten-dencies to the theoretical estimate ( ¯χz/S, Eq. 8). Figure 11a shows a scatter diagram of ∂T /∂t¯ versus ∂O3/∂t for the 70 hPa data (as shown in Fig. 7 but for the entire period), showing a significantly correlated distribution (r =0.63) with a linear slope of 5
20.4±1.9 ppbv K−1 (estimated using least squares linear regression, including a 2-sigma uncertainty level). This observed slope compares quite well with the theoretical value ¯χz/S=23.4 ppbv K−1at 70 hPa, indicating that the observed variations are not far from the case of variability controlled by upwelling via Eqs. (6)–(8). Figure 11b shows a similar diagram for∂T /∂t¯ versus ∂CO/∂t statistics at 70 hPa. In this case there is 10
a larger dispersion of the scattered points and the correlation is lower (r =−0.47). This can be related to the coarser vertical resolution of CO observations discussed above. The slope given by Eq. (8) for this tracer is−0.90 ppbv K−1, and the linear regression gives a similar slope of −1.14±0.16 ppbv K−1. Overall the observed slopes for both ozone and CO in Fig. 11 are reasonably similar to calculations based on the highly ide-15
alized situation where upwelling is the dominant forcing mechanism for subseasonal variability (although the theoretical slopes lie outside of the 2-sigma (95 %) bounds of the regression slopes in both cases, which could result from data uncertainties or addi-tional forcing mechanisms). These results are consistent with the coherent fluctuations observed between upwelling and tracer tendencies in Figs. 9 and 10.
20
It is worth noting that the lines in Fig. 11 have a smaller slope than what a visual examination of the scattered data points suggests. A simple analysis with synthetic data was made to understand this discrepancy. We constructed two linearly related variables (y =mx) and added some noise (normally distributed random variations) to each variable independently. Inspection of the scatter diagrams for different noise lev-25
els revealed that the actual slope (=mby construction) coincides with the visual slope only if the amount of noise in both variables is comparable; the actual slope is smaller (larger) than the visual slope if the noise is larger (smaller) iny than in x. Accordingly, the discrepancy in Fig. 11 can be understood if there are larger uncertainties in MLS
ACPD
12, 18817–18851, 2012Variability in tropical upwelling and correlations with
tracers
M. Abalos et al.
Title Page
Abstract Introduction
Conclusions References
Tables Figures
◭ ◮
◭ ◮
Back Close
Full Screen / Esc
Printer-friendly Version Interactive Discussion
Discussion
P
a
per
|
Dis
cussion
P
a
per
|
Discussion
P
a
per
|
Discussio
n
P
a
per
|
tracer tendencies (y-axis) than in ERA-Interim temperature tendencies (x-axis). Fur-thermore, this exercise proved that, under this assumption, the slope given by the least squares regression of∂χ /∂t¯ onto∂T /∂t¯ (as shown in Fig. 11) is an accurate estimate of the actual slope of the data.
Overall, the observed statistically significant correlations between upwelling and tem-5
perature and tracer tendencies, together with the reasonable agreement between the slope of the tracer versus temperature tendencies and predictions from the idealized balance in Eqs. (6)–(8), are strong evidence that sub-seasonal variations in upwelling are a primary mechanism for corresponding variability in temperature, ozone and CO in the tropical lower stratosphere.
10
4 Summary and discussion
Tropical upwelling is a key aspect of the global stratospheric circulation, but funda-mental aspects such as forcing mechanisms and temporal variability are poorly under-stood. In this study we evaluated the variability and quality of zonal average tropical upwelling estimates derived from different techniques ( ¯w∗, ¯wm∗ and ¯wQ∗). Overall there is 15
good agreement among the three (independent) estimates, although the magnitude of ¯
w∗from ERA-Interim is somewhat larger than ¯wm∗ and ¯wQ∗ at 100 hPa. This consistency, particularly between ¯wm∗ and ¯wQ∗, reflected in Figs. 3 and 4, is the primarily evidence of the reality of the estimates. Furthermore, sub-seasonal variations are correlated with both temperatures and tracer concentrations in the tropical lower stratosphere. This 20
result implies that sub-seasonal variations in the upwelling estimates reflect – at least to the extent quantified by the correlations in Figs. 4 and 10 – actual fluctuations in the atmosphere, and hence gives further confidence in the variability of the indirect upwelling estimates on fast timescales. For instance, the reasonable agreement of ¯wm∗ with the other estimates suggests the possibility of analyzing the terms in the mo-25
ACPD
12, 18817–18851, 2012Variability in tropical upwelling and correlations with
tracers
M. Abalos et al.
Title Page
Abstract Introduction
Conclusions References
Tables Figures
◭ ◮
◭ ◮
Back Close
Full Screen / Esc
Printer-friendly Version Interactive Discussion
Discussion
P
a
per
|
Dis
cussion
P
a
per
|
Discussion
P
a
per
|
Discussio
n
P
a
per
|
Time series for 2005–2010 in Fig. 1 show coherence among temperature, ozone and CO in the tropical lower stratosphere, for both seasonal and sub-seasonal time scales. Because ozone, CO and (potential) temperature all exhibit enhanced vertical gradients in the tropical lower stratosphere, the observed relationships suggest that upwelling plays a central role in producing this coherent behavior. We have evaluated explicitly 5
the zonal mean thermodynamic and tracer continuity equations to quantify the influ-ence of upwelling, focusing separately on seasonal and sub-seasonal time scales. The seasonal calculations (based on monthly averaged data) show that upwelling is a dom-inant term in all cases (Figs. 5, 6 and 7), so that the seasonal cycle in upwelling (max-imum during NH winter) is a simple mechanism responsible for the coupled seasonal 10
variations in temperature, ozone and CO. This summary statement is most applicable for altitudes where the background gradients are strongest, i.e. near 70 hPa for ozone and CO.
An important caveat is that the seasonal ozone and CO budgets in our calculations (Figs. 6 and 7) have significant residuals, which are likely due to eddy transport not 15
resolved in our analyses plus uncertainties in the resolved terms. The importance of eddy transport for ozone in the tropical lower stratosphere has been suggested by Aval-lone and Prather (1996) and more recently by Konopka et al. (2009, 2010) and Ploeger et al. (2012). The results of Konopka et al. (2009, 2010) and Ploeger et al. (2012) deserve further discussion. Their calculations, based on analysis of Lagrangian trajec-20
tories on isentropic levels, suggest that the seasonal cycle of ozone in the tropical lower stratosphere is primarily a response to horizontal eddy transport (in-mixing), rather than upwelling. Our results, based on TEM budget calculations on altitude (log-pressure) surfaces (Fig. 6), clearly highlight the dominance of vertical transport for the ozone seasonal cycle; understanding the very different results from these distinct calculations 25
will require further analysis.
Sub-seasonal variations in upwelling show statistically significant correlations with temperature and tracer tendencies. In addition, the slopes of the observed ratios of temperature versus ozone and CO tendencies (Fig. 11a) are relatively close to the
ACPD
12, 18817–18851, 2012Variability in tropical upwelling and correlations with
tracers
M. Abalos et al.
Title Page
Abstract Introduction
Conclusions References
Tables Figures
◭ ◮
◭ ◮
Back Close
Full Screen / Esc
Printer-friendly Version Interactive Discussion
Discussion
P
a
per
|
Dis
cussion
P
a
per
|
Discussion
P
a
per
|
Discussio
n
P
a
per
|
idealized situation where variability is primarily controlled by fluctuations in upwelling (Eqs. 6–8). This confirms the importance of upwelling in forcing transient variability of ozone and CO. These results for sub-seasonal variability are also consistent with our findings for the respective seasonal cycles, and highlight the central role of tropical upwelling across a broad range of time scales.
5
Acknowledgements. We thank Mijeong Park for providing MLS data, Fei Wu for calculating the
radiative heating rates and Doug Kinnison for providing the chemical production and loss rates for ozone and CO from WACCM. The ECMWF provided ERA-Interim data used in this work. We thank John Bergman and Rolando R. Garcia for constructive comments on the manuscript. This work was partially supported under the NASA Aura Science Program. Most of the work
10
has been carried out at NCAR during visits of Marta Abalos funded by the FPI program from the Spanish Ministry of Science and Innovation. The National Center for Atmospheric Research is operated by the University Corporation for Atmospheric Research, under sponsorship of the National Science Foundation.
References 15
Andrews, D. G., Holton, J. R., and Leovy, C. B.: Middle Atmosphere Dynamics, Academic Press, Orlando, Florida, 489 pp., 1987.
Avallone, L. M. and Prather, M. J.: Photochemical evolution of ozone in the lower tropical strato-sphere, J. Geophys. Res., 101, 1457–1461, 1996.
Bernath, P. F., McElroy, C. T., Abrams, M. C., Boone, C. D., Butler, M., Camy-Peyret, C.,
Car-20
leer, M., Clerbaux, C., Coheur, P. F., Colin, R., DeCola, P., DeMazi `ere, M., Drummond, J. R., Dufour, D., Evans, W. F. J., Fast, H., Fussen, D., Gilbert, K., Jennings, D. E., Llewellyn, E. J., Lowe, R. P., Mahieu, E., McConnell, J. C., McHugh, M., McLeod, S. D., Michaud, R., Mid-winter, C., Nassar, R., Nichitiu, F., Nowlan, C., Rinsland, C. P., Rochon, Y. J., Rowlands, N., Semeniuk, K., Simon, P., Skelton, R., Sloan, J. J., Soucy, M. - A., Strong, K., Tremblay, P.,
25
ACPD
12, 18817–18851, 2012Variability in tropical upwelling and correlations with
tracers
M. Abalos et al.
Title Page
Abstract Introduction
Conclusions References
Tables Figures
◭ ◮
◭ ◮
Back Close
Full Screen / Esc
Printer-friendly Version Interactive Discussion
Discussion
P
a
per
|
Dis
cussion
P
a
per
|
Discussion
P
a
per
|
Discussio
n
P
a
per
|
Brewer, A. W.: Evidence for a world circulation provided by the measurements of helium and water vapour distribution in the stratosphere, Q. J. Roy. Meteor. Soc., 75, 351–363, 1949. Calvo, N. and Garcia, R. R.: Wave forcing of the tropical upwelling in the lower stratosphere
under increasing concentrations of greenhouse gases, J. Atmos. Sci., 66, 3184–3196, 2009. Chae, J. H. and Sherwood, S. C.: Annual temperature cycle of the tropical tropopause: a simple
5
model study, J. Geophys. Res., 112, D19111, doi:10.1029/2006JD007956, 2007.
Dee, D. P., Uppala, S. M., Simmons, A. J., Berrisford, P., Poli, P., Kobayashi, S., Andrae, U., Balmaseda, M. A., Balsamo, G., Bauer, P., Bechtold, P., Beljaars, A. C. M., van de Berg, L., Bidlot, J., Bormann, N., Delsol, C., Dragani, R., Fuentes, M., Geer, A. J., Haimberger, L., Healy, S. B., Hersbach, H., H ´olm, E. V., Isaksen, L., K ˚allberg, P., K ¨ohler, M., Matricardi, M.,
10
McNally, A. P., Monge-Sanz, B. M., Morcrette, J.-J., Park, B.-K., Peubey, C., de Rosnay, P., Tavolato, C., Th ´epaut, J.-N., and Vitart, F.: The ERA-interim reanalysis: configuration and performance of the data assimilation system, Q. J. Roy. Meteor. Soc., 137, 553–597, doi:10.1002/qj.828, 2011.
Dobson, G. M. B.: Origin and distribution of the polyatomic molecules in the atmosphere, P. R.
15
Soc. A, 236, 187–193, doi:10.1098/rspa.1956.0127, 1956.
Folkins, I., Bernath, P., Boone, C., Lesins, G., Livesey, N., Thompson, A. M., Walker, K., and Witte, J. C.: Seasonal cycles of O3, CO, and convective outflow at the tropical tropopause,
Geophys. Res. Lett., 33, L16802, doi:10.1029/2006GL026602, 2006.
Froidevaux, L., Livesey, N. J., Read, W. G., Jiang, Y. B., Jimenez, C., Filipiak, M. J.,
20
Schwartz, M. J., Santee, M. L., Pumphrey, H. C., Jiang, J. H., Wu, D. L., Manney, G. L., Drouin, B. J., Waters, J. W., Fetzer, E. J., Bernath, P. F., Boone, C. D., Walker, K. A., Jucks, K. W., Toon, G. C., Margitan, J., J., Sen, B., Webster, C. R., Christensen, L. E., Elkins, J. W., Atlas, E., Lueb, R. A., and Hendershot, R.: Early validation analyses of at-mospheric profiles from EOS MLS on the Aura satellite, IEEE T. Geosci. Remote, 44, 1106–
25
1121, 2006.
Fueglistaler, S., Dessler, A. E., Dunkerton, T. J., Folkins, I., Fu, Q., and Mote, P. W.: Tropical tropopause layer, Rev. Geophys., 47, RG1004, doi:10.1029/2008RG000267, 2009a.
Fueglistaler, S., Legras, B., Beljaars, A., Morcrette, J. J., Simmons, A., Tompkins, A. M., and Uppala, S.: The diabatic heat budget of the upper troposphere and lower/mid stratosphere
30
in ECMWF reanalysis, Q. J. Roy. Meteor. Soc., 135, 21–37, doi:10.1002/qj.361, 2009b.
ACPD
12, 18817–18851, 2012Variability in tropical upwelling and correlations with
tracers
M. Abalos et al.
Title Page
Abstract Introduction
Conclusions References
Tables Figures
◭ ◮
◭ ◮
Back Close
Full Screen / Esc
Printer-friendly Version Interactive Discussion
Discussion
P
a
per
|
Dis
cussion
P
a
per
|
Discussion
P
a
per
|
Discussio
n
P
a
per
|
Fueglistaler, S., Haynes, P. H., and Forster, P. M.: The annual cycle in lower stratospheric tem-peratures revisited, Atmos. Chem. Phys., 11, 3701–3711, doi:10.5194/acp-11-3701-2011, 2011.
Garcia, R. R. and Randel, W. J.: Acceleration of the Brewer-Dobson circulation due to increases in greenhouse gases, J. Atmos. Sci., 65, 2731–2739, 2008.
5
Gettelman, A., Forster, P., Fujiwara, M., Fu, Q., V ¨omel, H., Gohar, L., Johason C., and Am-merman, M.: The radiation balance of the tropical tropopause layer, J. Geophys. Res., 109, D07103, doi:10.1029/2003JD004190, 2004.
Gille, J. C., Lyjak, L. V., and Smith, A. K.: The global residual mean circulation in the middle atmosphere for the northern winter period, J. Atmos. Sci., 44, 1437–1452, 1987.
10
Iwasaki, T., Hamada, H., and Miyazaki, K.: Comparisons of Brewer-Dobson circulations diag-nosed from reanalyses, J. Meteorol. Soc. Jpn., 87, 997–1006, 2009.
Konopka, P., Grooß, J.-U., Ploeger, F., and M ¨uller, R.: Annual cycle of horizontal in-mixing into the lower tropical stratosphere, J. Geophys. Res., 114, D19111, doi:10.1029/2009JD011955, 2009.
15
Konopka, P., Grooß, J.-U., G ¨unther, G., Ploeger, F., Pommrich, R., M ¨uller, R., and Livesey, N.: Annual cycle of ozone at and above the tropical tropopause: observations versus simulations with the Chemical Lagrangian Model of the Stratosphere (CLaMS), Atmos. Chem. Phys., 10, 121–132, doi:10.5194/acp-10-121-2010, 2010.
Liu, C., Zipser, E., Garrett, T., Jiang, J. H., and Su, H.: How do the water vapor and carbon
20
monoxide “tape recorders” start near the tropical tropopause?, Geophys. Res. Lett., 34, L09804, doi:10.1029/2006GL029234, 2007.
Livesey, N. J., Filipiak, M. J., Froidevaux, L., Read, W. G., Lambert, A., Santee, M. L., Jiang, J. H., Pumphrey, H. C., Waters, J. W., Cofield, R. E., Cuddy, D. T., Daffer, W. H., Drouin, B. J., Fuller, R. A., Jarnot, R. F., Jiang, Y. B., Knosp, B. W., Li, Q. B., Perun, V. S.,
25
Schwartz, M. J., Snyder, W. V., Stek, P. C., Thurstans, R. P., Wagner, P. A., Avery, M., Brow-ell, E. V., Cammas, J.- P. E. Christensen, L., Diskin, G. S., Gao, R.-S., Jost, H.-J., Loewen-stein, M., Lopez, J. D., Nedelec, P., Osterman, G. B., Sachse, G. W., and Webster, C. R.: Val-idation of Aura Microwave Limb Sounder O3and CO observations in the upper troposphere
and lower stratosphere, J. Geophys. Res., 113, D15S02, doi:10.1029/2007JD008805, 2008.
30
ACPD
12, 18817–18851, 2012Variability in tropical upwelling and correlations with
tracers
M. Abalos et al.
Title Page
Abstract Introduction
Conclusions References
Tables Figures
◭ ◮
◭ ◮
Back Close
Full Screen / Esc
Printer-friendly Version Interactive Discussion
Discussion
P
a
per
|
Dis
cussion
P
a
per
|
Discussion
P
a
per
|
Discussio
n
P
a
per
|
Monge-Sanz, B. M., Chipperfield, M. P., Simmons, A. J., and Uppala, S. M.: Mean age of air and transport in a CTM: Comparison of different ECMWF analyses, Geophys. Res. Let., 34, L04801, doi:10.1029/2006GL028515, 2007.
Mote, P. W., Rosenlof, K. H., Mclntyre, M. E., Carr, E. S., Gille, J. C., Holton, J. R., Kinner-sley, J. S., Pumphrey, H. C., Russell III, J. M., and Waters, J. W.: An atmospheric tape
5
recorder: the imprint of tropical tropopause temperatures on stratospheric water vapor, J. Geophys. Res., 101, 3989–4006, 1996.
Niwano, M., Yamazaki, K., and Shiotani, M.: Seasonal and QBO variations in ascent rate in the tropical lower stratosphere as inferred from UARS HALOE trace gas data, J. Geophys. Res., 108, 4794, doi:10.1029/2003JD003871, 2003.
10
Ploeger, F., Konopka, P., M ¨uller, R., Fueglistaler, S., Schmidt, T., Manners, J., Grooss, J.-U., G ¨unther, G., de Forster, P. M., and Riese, M.: Horizontal transport affecting trace gas seasonality in the Tropical Tropopause Layer (TTL), J. Geophys. Res., 117, D09303, doi:10.1029/2011JD017267, 2012.
Randel, W. J., Garcia, R. R., and Wu, F.: Time-dependent upwelling in the tropical lower
strato-15
sphere estimated from the zonal-mean momentum budget, J. Atmos. Sci., 59, 2141–2152, 2002.
Randel, W. J., Park, M., Wu, F., and Livesey, N.: A large annual cycle in ozone above the tropical tropopause linked to the Brewer-Dobson circulation, J. Atmos. Sci., 64, 4479–4488, 2007. Reed, R. J. and Vlcek, C. L.: The annual temperature variation in the lower tropical stratosphere,
20
J. Atmos. Sci., 26, 163–167, 1969.
Rosenlof, K. H.: Seasonal cycle of the residual mean meridional circulation in the stratosphere, J. Geophys. Res., 100, 5173–5191, 1995.
Seviour, W. J. M., Butchart, N., and Hardiman, S. C.: The Brewer-Dobson circulation inferred from ERA-Interim, Q. J. Roy. Meteor. Soc., 138, 878–888, doi:10.1002/qj.966, 2011.
25
Schoeberl, M. R., Duncan, B. N., Douglass, A. R., Waters, J., Livesey, N., Read, W., and Filipiak, M.: The carbon monoxide tape recorder, Geophys. Res. Lett., 33, L12811, doi:10.1029/2006GL026178, 2006.
Schoeberl, M. R., Douglass, A. R., Newman, P. A., Lait, L. R., Lary, D., Waters, J., Livesey, N., Froidevaux, L., Lambert, A., Read, W., Filipiak, M. J., and Pumphrey, H. C.: QBO and
an-30
nual cycle variations in tropical lower stratosphere trace gases from HALOE and Aura MLS observations, J. Geophys. Res., 113, D05301, doi:10.1029/2007JD008678, 2008a.
ACPD
12, 18817–18851, 2012Variability in tropical upwelling and correlations with
tracers
M. Abalos et al.
Title Page
Abstract Introduction
Conclusions References
Tables Figures
◭ ◮
◭ ◮
Back Close
Full Screen / Esc
Printer-friendly Version Interactive Discussion
Discussion
P
a
per
|
Dis
cussion
P
a
per
|
Discussion
P
a
per
|
Discussio
n
P
a
per
|
Schoeberl, M. R., Douglass, A. R., Stolarski, R. S., Pawson, S., Strahan, S. E., and Read, W.: Comparison of lower stratospheric tropical mean vertical velocities, J. Geophys. Res., 113, D24109, doi:10.1029/2008JD010221, 2008b.
Thuburn, J. and Craig, G. C.: Stratospheric influence on tropopause height: the radiative con-straint, J. Atmos. Sci., 57, 17–28, 2000.
5
Waters, J. W., Froidevaux, L., Harwood, R. S., Jarnot, R. F., Pickett, H. M., Read, W. G., Siegel, P. H., Cofield, R. E., Filipiak, M. J., Flower, D. A., Holden, J. R., Lau, G. K., Livesey, N. J., Manney, G. L., Pumphrey, H. C., Santee, M. L., Wu, D. L., Cuddy, D. T., Lay, R. R., Loo, M. S., Perun, V. S., Schwartz, M. J., Stek, P. C., Thurstans, R. P., Boyles, M. A., Chandra, K. M., Chavez, M. C., Gun-Shing, C., Chudasama, B. V., Dodge, R.,
10
Fuller, R. A., Girard, M. A., Jiang, J. H., Yibo, J., Knosp, B. W., LaBelle, R. C., Lam, J. C., Lee, K. A., Miller, D., Oswald, J. E., Patel, N. C., Pukala, D. M., Quintero, O., Scaff, D. M., Van Snyder, W., Tope, M. C., Wagner, P. A., and Walch, M. J.: The Earth Observing System Microwave Limb Sounder (EOS MLS) on the Aura Satellite, IEEE T. Geosci. Remote, 44, 1075–1092, 2006.
15
Yang, Q., Fu, Q., Austin, J., Gettelman, A., Li, F., and V ¨omel, H.: Observationally derived and general circulation model simulated tropical stratospheric upward mass fluxes, J. Geophys. Res., 113, D00B07, doi:10.1029/2008JD009945, 2008.
Yang, Q., Fu, Q., and Hu, Y.: Radiative impacts of clouds in the tropical tropopause layer, J. Geophys. Res., 115, D00H12, doi:10.1029/2009JD012393, 2010.
20
ACPD
12, 18817–18851, 2012Variability in tropical upwelling and correlations with
tracers
M. Abalos et al.
Title Page
Abstract Introduction
Conclusions References
Tables Figures
◭ ◮
◭ ◮
Back Close
Full Screen / Esc
Printer-friendly Version Interactive Discussion
Discussion
P
a
per
|
Dis
cussion
P
a
per
|
Discussion
P
a
per
|
Discussio
n
P
a
per
|
Fig. 1. Time series of standardized anomalies of daily temperatures from ERA-Interim and ozone and CO mixing ratio measurements from MLS averaged over 18◦N–S at three pressure levels across the tropical tropopause (70, 80 and 100 hPa from top to bottom). 3-days running means were applied to the daily series. CO concentrations are plotted on a reversed scale in order to highlight the common fluctuations.
ACPD
12, 18817–18851, 2012Variability in tropical upwelling and correlations with
tracers
M. Abalos et al.
Title Page
Abstract Introduction
Conclusions References
Tables Figures
◭ ◮
◭ ◮
Back Close
Full Screen / Esc
Printer-friendly Version Interactive Discussion
Discussion
P
a
per
|
Dis
cussion
P
a
per
|
Discussion
P
a
per
|
Discussio
n
P
a
per
|
Fig. 3.Time series and mean seasonal cycles of the three upwelling estimates averaged over 18◦N–S at 70, 80 and 100 hPa (top to bottom panels). Green: residual circulation ( ¯w∗), blue: momentum balance estimate ( ¯wm∗), and red: thermodynamic estimate ( ¯wQ∗). Time series are
11-days running means. The annual cycles are calculated as monthly means over 2005–2010 (mm s−1).
ACPD
12, 18817–18851, 2012Variability in tropical upwelling and correlations with
tracers
M. Abalos et al.
Title Page
Abstract Introduction
Conclusions References
Tables Figures
◭ ◮
◭ ◮
Back Close
Full Screen / Esc
Printer-friendly Version Interactive Discussion
Discussion
P
a
per
|
Dis
cussion
P
a
per
|
Discussion
P
a
per
|
Discussio
n
P
a
per
|
Fig. 5.Mean seasonal cycle (monthly means for the period 2005–2010) of the terms in the thermodynamic equation (Eq. 4) averaged over 18◦N–S for the three pressure levels indicated. The purple line is the residual from the explicitly evaluated terms (K day−1).