ORIGINAL ARTICLE
Effect of salt stress (NaCl) on biomass and K
+/Na
+ratio in cotton
Basel Saleh
Department of Molecular Biology and Biotechnology, AECS, P.O. Box 6091, Damascus,
Syria
E-mail:
ascientific@aec.og.sy
Received August 8, 2011
A pot experiment was conducted to evaluate performance of five Upland cotton (Gossypium hirsutum
L.) varieties, Aleppo118 (A118), Aleppo33/1 (A33/1), Aleppo90 (A90), Raqqa5 (Raq5) and Deir-Ezzor22 (DE22), grown under different salinity concentration 0, 50, 100 and 200 mM NaCl for 56 days. Results indicated that increasing salinity decreased fresh and dry leaf and root weights. Also, leaf K+/Na+ ratio was decreased as increasing salinity levels in all tested varieties. This reduction for
the all indicators tested was relatively more pronounced in A118 than DE22. Thereby, DE22 variety relatively performed better under salinity compared to the other tested varieties. Based on this investigation, it can be concluded that DE22 and Raq5 are relatively characterized as salt tolerant, while A90 as moderate salt tolerant. On the other hand, A118 and A33/1 could be considered as salt sensitive.
Key words: Biomass / Content / Cotton / K / Na / Salt stress / Variety.
Salinity is one of the most serious factors that
limiting crop production, especially for the sensitive
species (Manivannan et al 2007). Plants show
variable capacity to salinity tolerance that could be
range from negligible effect to plant death.
Considerable differences are found between plant
species. For example, after exposure to 200 mM
NaCl, a salt- tolerant species such as sugarbeet
might have a reduction of only 20% in dry weight,
whereas, a moderately tolerant species such as
cotton might have a 60% reduction, and a sensitive
species such as soybean might die (Munns 2002).
Different strategies commonly used by plants to
improve salt stress tolerance: maintain desirable
K+/Na+ ratio in the cytosole, regulation of K+ uptake
and prevention of Na+ entry, efflux of Na+ from cell
or compartmentalize Na+ into vacuole (Munis et al
2010, Munns 2002). The ionic toxicity of the salt
could be attributed to the replacement of K+ by Na+
through biochemical interactions as well as
structural changes, lack of protein functions as a
result of uptake of ions Cl
and Na+
and interference
of interactions between amino acids (Zhu 2003).
Many researches reported that K+
/Na+
considered as useful indicator for plant salinity
tolerance (Ahmad et al 2002, Khan et al 2009,
Munis et al 2010).
In Syria, about 50% of irrigated soil suffers from
salinity that has been considered as the main
limitation of agricultural production. Cotton is a
very economically important crop in Syria, with a
cultivated area amount to 175.000 ha, and a
production of 700.000 t of seed cotton and lint
production is estimated at 235,000 t (USDA 2009).
This study aimed to investigate the biomass, leaf
and root Na+
and K+
content and leaf K+
/Na+
ratio in
some cultivated cotton varieties grown in Syria
under different salinity concentration 0, 50, 100 and
200 mM NaCl for 56 days.
MATERIALS AND METHODS
Plant materials
Seeds of Upland cotton (G. hirsutum. L) Aleppo
118, Aleppo 33/1, Aleppo 90, Raqqa 5 and
Deir-Ezzor 22 were provided by the GCSAR – Syria
(Table 1). The seeds were soaked in distilled H2O
for 24 h and then planted in pots filled with a 1/3:2/3
(v/v) mixture of perlite:peat mosse. Germination
was carried out in the greenhouse at temperature of
180C, 12 h photoperiod and relative humidity of
80%. Seedlings were allowed to grow in the
greenhouse under controlled conditions (temperature
of 250C, 12 h photoperiod and relative humidity of
80%).
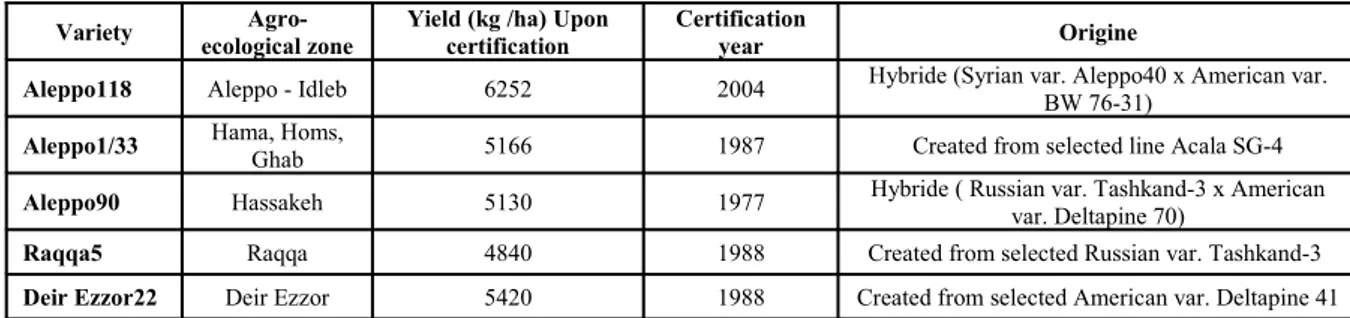
Table 1. Descriptive of 5 certificated cotton varieties used in this study
Variety Agro-ecological zone
Yield (kg /ha) Upon certification
Certification
year Origine
Aleppo118 Aleppo - Idleb 6252 2004 Hybride (Syrian var. Aleppo40 x American var. BW 76-31)
Aleppo1/33 Hama, Homs, Ghab 5166 1987 Created from selected line Acala SG-4
Aleppo90 Hassakeh 5130 1977 Hybride ( Russian var. Tashkand-3 x American var. Deltapine 70)
Raqqa5 Raqqa 4840 1988 Created from selected Russian var. Tashkand-3
Deir Ezzor22 Deir Ezzor 5420 1988 Created from selected American var. Deltapine 41
Source: General Commission for Agricultural Research Damascus – Duma, Syria (GCSAR).
Seedlings were watered for 1 week with 0.1
Hoagland nutrient solution before the initiation of
NaCl treatment. The seedlings were subjected to salt
stress by adding NaCl (0, 50, 100 and 200 mM) to
the nutrient solution. The same environmental
conditions were maintained during the experimental
period. All solutions were changed twice a week.
Plants were harvested 56 days after salt application
(three replicates by treatment). Plants were
up-rooted carefully and washed properly with tap water.
Then, they were separated into roots and leaves for
mineral analysis.
Statistical analysis
All statistical analyses were performed using
Statview 4.5 statistical package (ABACUS 1996)
significance level (P = 0.05). Data were subjected to
analysis of variance (ANOVA) for the determination
of differences in means between tested plants of
each concentration of NaCl applied. Differences
between means were tested for significance by
Fisher's PLSD test. Data are expressed as mean of
three replicates.
Plant sampling and mineral analysis
Leaf and root fractions were oven-dried at 70◦C
for 48 h, weighed, crushed in a hammer-mill and
stored at room temperature. Nutrient analyses were
carried out on dried leaves and roots. Samples were
400C for 4 h. The resulting ashes were dissolved in
100 ml of 0.5N concentrated nitric acid.
Determination of Na+
and K+
was carried out using
flame photometer procedure.
RESULTS AND DISCUSSION
Analysis of variances of data for the different
investigated parameters for the five cotton varieties
tested in this study was summarize in Table 2.
Table 2. Analysis of variances (mean squares) of data for the five cotton varieties after 56 days growth at 0, 50, 100 and 200 mM NaCl
S.O.V df FWR FWL DWR DWL Biomass
K+/Na+
ratio
V 4 1.047* 5.758* 0.138ns
0.611* 3.391* 42.666*
T 3 5.099* 7.793* 0.496* 0.667* 11.428* 89.958*
V x T 12 0.102ns
0.653ns
0.095ns
0.077ns
1.189* 32.271*
Error 40 0.242 0.487 0.067 0.039 0.3 6.496
* : significant at 0.05 level, ns: Non-significant, V: variety, T: treatment.
Table 3. Fresh weight (g) of five cotton varieties 56 days after NaCl (0, 50, 100 and 200 mM) treatment
Variety Control 50 mM 100 mM 200 mM Control 50 mM 100 mM 200 mM
Leaf Root
A118 5.25 aX 3.25 bY 2.54 cZ 2.56 bZ 3.45 aX 2.64 bY 2.43 aY 2.02 aZ
A33/1 4.14 bX 3.28 bY 2.95 bY 2.63 bZ 3.57 aX 3.26 aX 2.69 aY 2.23 aZ
A90 5.49 aX 4.79 aY 4.71 aY 3.31 aZ 3.33 aX 2.78 bY 2.56 aY 1.77 bZ
Raq5 3.29 cX 2.66 cY 2.67 cY 2.06 bZ 3.42 aX 3.07 aX 2.55 aY 1.73 bZ
DE22 3.71 bX 3.79 bX 3.46 bX 2.55 bY 2.69 bX 2.07 cY 1.98 bY 1.76 bY
LSD 0.05 (T) = 0.52 LSD 0.05 (T) = 0.36
LSD 0.05 (V) = 0.58 LSD 0.05 (V) = 0.41
Mean with the same letters in each column (a-c) and each row (X-Z) don’t differ significantly at P = 0.05. (T): treatment; (V): variety.
Table 4. Dry weight (g) of five cotton varieties 56 days after NaCl (0, 50, 100 and 200 mM) treatmen
Variety Control 50 mM 100 mM 200 mM Control 50 mM 100 mM 200 mM
Leaf Root
A118 1.14 bX 0.54 cY 0.58 bY 0.49 bY 1.09 aX 0.89 bY 0.75 aY 0.75 aY
A33/1 0.96 cX 0.61 bY 0.35 cZ 0.37 cZ 1.05 aX 1.18 aX 0.46 bY 0.53 bY
A90 1.34 aW 1.18 aX 0.95 aY 0.54 bZ 1.13 aX 0.91 bY 0.79 aY 0.42 bZ
Raq5 0.45 eX 0.42 cX 0.42 cX 0.23 cY 0.68 bY 1.05 aX 0.79 aY 0.57 aZ
DE22 0.77 dX 0.76 bX 0.63 bX 0.75 aX 0.61 bX 0.64 cX 0.53 bX 0.57 aX
LSD 0.05 (T) = 0.15 LSD 0.05 (T) = 0.19
LSD 0.05 (V) = 0.16 LSD 0.05 (V) = 0.21
Mean with the same letters in each column (a-e) and each row (W-Z) don’t differ significantly at P = 0.05. (T): treatment; (V): variety.
Fresh and dry weights biomass
Salinity significantly (p<0.001) reduced the fresh
weight of leaf (FWL) and root (FWR) (Table 3).
This reduction was more pronounced for A118,
A33/1, A90 and Raq5 than for DE22.
On the other hand, decline in dry weight of leaf
(DWL) and root (DWR) (Table 4) was recorded for
all tested varieties regardless the concentration of
NaCl applied. A significant reduction (P<0.001) in
DWR and DWL was observed in all varieties due to
significant decrease in both leaf and root dry weight
was recorded for DE22 (Table 4) which seems to be
the most salt tolerant variety relative to the other
varieties in this study. While, DWR increased
significantly above the control plants in Raq5 by
55% and 16% at 50 mM and 100 mM respectively.
The observed reduction in DW resulting from
the increasing in salinity might be attributed to the
combination effect of osmotic and specific ion of Cl-
and Na+ (Basal 2010, Hajer et al 2006). It was
noticed that, the reduction in DWR index exceeded
62% with increasing salt level from 0 to 200 mM,
and differences among cotton varieties were
significant. These results are in agreement with
Munns (2002). The highest reduction in DWR was
found for A90 (63%), and the lowest reduction was
observed for DE22 (7%) at high NaCl salinity level
(200 mM). At the same range of NaCl (200 mM), a
reduction in DWL was also observed among the
different tested cotton varieties es. The lowest
decrease in this parameter was recorded for DE22
(3%), whereas, the highest reduction was found in
A33/1 (62%).Several researchers reported that fresh
and dry weights of cotton plants might be affected
under saline conditions (Ahmad et al 2002, Akhtar
et al 2010, Basal 2010, Khan et al 1995). Deir-Ezzor
22 variety is differed by showing high salt tolerance
relative to Aleppo 118 and Aleppo 33/1 varieties
(unpublished). Similar observation has also been
recorded in tomato (Hajer et al 2006) and Maize
(Zea mays L.) (khatoon et al 2010).
Total biomass production
Salt stress significantly (p<0.001) impaired total
plant dry weight (leaf, root and stem) for all tested
varieties below the control (Fig.1). This inhibition
was less pronounced in Raq5 and DE22 compared to
the other tested varieties. At low NaCl concentration
(50 mM), this reduction ranged between 5% (DE22)
to 44% (A118). While, at moderate NaCl treatment
(100 mM), the reduction rate varied from 34%
(DE22) to 62% (A33/1).
It is worth noting that the previous parameter
increased in Raq5 at 50 mM and 100 mM NaCl by
29% and 10% respectively over the control.
Whereas, the highest reduction was recorded at high
NaCl concentration (200 mM). It could be
concluded that the decline in this parameter is can be
arranged as the following: Raq5 (25%) < DE22
(34%) < A118 (53%) < A33/1 (56%) < A90 (64%).
These values fall within the same range of Munns
(2002) who reported that the reduction in dry weight
of cotton tissues reach 60%.
Similarly, Ahmad et al (2002), Akhtar et al 2010,
Basal (2010) and Munis et al (2010) found that
biomass production was negatively affected by NaCl
application in cotton. However, based on our study,
Raq5 and DE22 could relatively be classified as salt
tolerant varieties compared to other tested varieties.
Na+ and K+ content
Differences in Na+
, K+
content in leaves and
roots showed different patterns of ion accumulation
in all tested varieties (Fig. 2). Sodium content was
higher in leaves than in roots for all tested varieties
in both the control and the salt stressed plants. Data
revealed that an increase of leaf Na+ accumulation
with increasing salinity was evident in all varieties.
In leaves, DE22 and Raq5 varieties showed the
lowest Na+content while, A33/1 has the highest one
(Fig. 2A). This result was in agreement with Akhtar
et al (2010) and Munis et al (2010) who mentioned
that the cotton tolerant cultivars had lower
concentration of Na+ in leaves than the sensitive
ones.
In root, A90 accumulates the highest Na+ value
compared to the tested varieties (Fig. 2B). Based
in leaf K content was observed for all tested
varieties (Fig. 2C). This previous parameter was
constant in Raq5 regardless to salinity level. While
at root level, slight decrease was recorded for A118
(Fig. 2D). A slight increase in this parameter was
recorded for Raq5. However, this parameter was
constant for A33/1 and remarkably for DE22 (Fig.
2D). This observation was in accordance with
Ahmad et al (2003), Akhtar et al (2010) and Munis
et al (2010) in cotton. In this respect, DE22 and
Raq5 varieties could be relatively considered as salt
tolerant variety compared to other tested varieties.
Leaf K+/Na+ ratio
Estimated leaf K+
/Na+
ratio was negatively
affected by NaCl application (Table 5). At 100 mM
NaCl, DE22 and Raq5 were classified in the first
rank according to this previous index while the other
tested varieties were in the least rank (Table 5). To
avoid the toxicity resulting from an excess salt,
plants tend to accumulate more K+ over Na+ at leaf
level and thus maintained high K+/Na+ ratio. These
plants could be characterized as salt-tolerants
relative to the other treated plants. According to
Abdullah and Ahmad (1986), Ahmad et al (2002),
Khan et al (2009), Khorshidi et al (2009), Munis et
al (2010), Wyn Jones et al (1979) and Zhu (2003),
K+/Na+ ratio has been considered as a critical
indicator for salt tolerance selection in some crops.
Genotypic variation exists among the five cotton
varieties for investigated characters under control
and salt treatments. In general, NaCl application
reduced leaf K+/Na+ ratio (Table 5) in all tested
varieties. Leaf K+/Na+ ratio was decreased to less
than 1.0 in A118 (about 0.39), A33/1 (about 0.41)
and slightly increased to more than 1.0 in DE22 and
Raq5 (about 1.23 and 1.38 respectively).
These findings available at all external NaCl
regimes except at the highest NaCl treatment (200
mM) where this ratio became below 1.0 in all tested
varieties. It is worth to note that, K+/Na+ ratio
decreased with increasing salinity in all tested
varieties. However, it was found that K+/Na+ ratio is
higher in DE22, i.e., 0.62 than in A118 (0.27).
Figure 2. Leaf Na+ (A), root Na+ (B), leaf K+ (C) and root K+ (D) content of five cotton varieties after 56 days
Table 5. Leaf K/Na ratio of five cotton varieties 56 days after NaCl (0, 50, 100 and 200 mM) treatment
Variety Control 50 mM 100 mM 200 mM
A118 2.27 bX 2.07 aX 0.39 aX 0.27 aY
A33/1 1.26 cX 1.03 aX 0.41 aX 0.12 aX
A90 4.04 bX 1.91 aY 1.04 aY 0.71 aY
Raq5 3.95 bX 2.52 aX 1.38 aY 0.82 aY
DE22 17.79 aX 2.48 aY 1.23 aY 0.62 aY
LSD 0.05 (T) = 1.88 LSD 0.05 (V) = 2.10
Mean with the same letters in each column (a-c) and each row (X-Y) don’t differ significantly at P = 0.05. (T): treatment; (V): variety.
This study revealed that Raq5 and DE22
varieties retained low Na+
concentration and
maintained high K+
/Na+
ratio and thus it's reflecting
a better salt tolerance. While A118 and A33/1
varieties could be declared as a salt-sensitive variety
due to there high accumulation of Na+ and
maintaining lower K+/Na+ ratio. Similar finding was
reported in cotton (Ahmad et al 2003, Akhtar et al
2010, Munis et al 2010) and in wheat (Khan et al
2009).
These results are also in accordance with the
previous studies of Abdullah and Ahmad (1986) and
Ahmad et al (2002) who found that a positive
relationship between high K+/Na+ ratio and salt
tolerance in cotton. Maintenance of higher K+/Na+
ratio in salt tolerant cultivars may have been one of
the factors for their relative superiority in growth
under saline conditions, since Wyn Jones et al
(1979) suggested a minimum value for K+/Na+ of 1.0
for normal growth of plants subjected to saline
substrate.
It is obvious to notice that at highest salinity
levels (200 mM) this index was higher in A90, Rak5
and DE22 comparing to the other tested varieties.
Where, Raq5 and DE22 restricted the Na+ and
accumulated K+ and thus maintained high K+/Na+.
While A118 and A33/1 behaved conversely. The
increased of K+
observed in some previous varieties
towards salt application could be attributed to
efficient K+
absorbance by selective inclusion of Na+
by cortical cells. Our results were in accordance of
Ahamad et al (2003) and Munis et al (2010) in
cotton. A high leaf K+
/Na+
ratio in the cytosol is
essential for normal cellular functions of plants. Na+
competes with K+ uptake through Na+/K+
cotransporters, and may block the K+ specific
transporters of root cells under salinity (Zhu 2003).
In conclusion, biomass production and leaf
K+/Na+ ratio could be considered as useful
parameters for screening salt tolerance among
different cotton varieties cultivated in Syria.
Thereby, cotton varieties that could be considered as
salt tolerants will help in boosting crop production
in salt affected regions. Ionic analysis performance
(another ions and cations analyses), further
determinants such as e.g. transpiration rate and
osmolytes accumulation, are needed for a better
understanding of the response towards salt treatment
among these tested varieties.
ACKNOWLEDGMENTS
We thank Dr. I. Othman (Director General of
AECS) and Dr. N. Mirali (Head of Molecular
Biology and Biotechnology Department in AECS)
for their support, and also the Plant Biotechnology
REFERENCES
ABACUS Concept (1996) Statview 4.5 Statistical
Program Abacus Concepts Corporation,
Berkeley, CA, USA.
Abdullah, Z. and Ahmad, R. (1986) Salinity induced
changes in the reproductive physiology of
cotton plants. In: R. Ahmad and A. San Pietro
(Editors), Prospects for Biosaline Research.
Department of Botany, University of Karachi,
Pakistan, pp: 125-137.
Ahmad, S., Khan, N.I., Iqbal, M.Z., Hussain, A. and
Hassan, M. (2002) Salt tolerance of cotton
(Gossypium hirsutum L.). Asian. J. Plant. Sci.,
1,715-719.
Ahmad, S., Khan, N.U.L., Iqbal, M., Attique Sadiq,
M. and Hussain, A. (2003) Influence of sodium
chloride on ion accumulation and fibre quality
in cotton (Gossypium hirsutum L.). OnLine J.
Biol. Sci., 3,699-710.
Akhtar, J., Saqib, Z.A., Sarfraz, M., Saleem, I. and
Hao, M.A. (2010) Evaluating salt tolerant
cotton genotypes at different levels of NaCl
stress in solution and soil culture. Pak. J. Bot.,
42,2857-2866.
Basal, H. (2010) Response of cotton (Gossypium
hirsutum L.) genotypes to salt stress. Pak. J.
Bot., 42,505-511.
Hajer, A.S., Malibari, A.A., Al-Zahrani, H.S. and
Almaghrabi, O.A. (2006) Responses of three
tomato cultivars to sea water salinity 1. Effect
of salinity on the seedling growth. African J.
Biotec., 5,855-861.
Hoagland, D.R. and Arnon, D.I. (1950) The water
culture method for growing plants without soil.
circular 347, college of Agriculture, University
of California, Berkeley; college Agriculture
circular No.347.
Khan, A.N., Qureshi, R.H. and Ahmad, N. (1995)
Selection of cotton cultivars for salinity
tolerance at seedling stage. Sarhad J. Agric.,
1,153-159.
Khan, M.A., Shirazi, M.U., Muhammad, A.K.,
Mujtaba, S.M., Islam, E., Mumtaz, S., Shereen,
A., Ansari, R.U. and Afhraf, Y. (2009) Role of
proline, K/Na ratio and chlorophyll content in
salt tolerance of wheat (Triticum aestivum L.).
Pak. J. Bot., 41,633-638.
Khatoon, T., Hussain, K., Majeed, A., Nawaz, K.
and Farrukh Nisar, M. (2010) Morphological
variations in maize (Zea mays L.) under
different levels of NaCl at germinating stage.
World Appl. Sci. J., 8 ,1294-1297.
Khorshidi, M.B., Yarnia, M. and Hassanpanah, D.
(2009) Salinity effect on nutrients accumulation
in alfalfa shoots in hydroponic condition. J.
Food, Agric & Environ., 7,787-790.
Manivannan, P., Jaleel, C. A., Sankar, B.,
Somasundaram, R., Mural, P.V., Sridharan, R.
and Panneerselvam, R. (2007) Salt stress
mitigation by calicium chloride in Vigna
radiata (L.) Wilczek. Acta. Biol. Cracov. Bot.,
49,105-109.
Munis, M.F.H., Tu, L., Ziaf, K., Tan, J., Deng, F.
and Zhang, X. (2010) Critical osmotic, ionic
and physiological indicators of salinity
tolerance in cotton (Gossypium hirsutum L.) for
cultivar selection. Pak. J. Bot., 42,1685-1694.
Munns, R. (2002) Comparative physiology of salt
and water stress. Plant Cell. Environ., 25,
239-250.
USDA (2009) Syria cotton and products annual
cotton report,GAIN Report, Date: 23/04/2009.
Published in internet, available in
Wyn Jones, R.G., Brady, C.J. and Speirs, J. (1979)
Ionic and osmotic regulation in plants. In: D.L.
Laidman and R.G. Wyn Jones (Editors), Recent
Advances in the Biochemistry of Cereals.
Academic Press London, New York, San
Francisco, pp: 63-103.
Zhu, J.K. (2003) Regulation of ion homeostasis
under salt stress. Curr. Opin. Plant Biol.,