Intra-Individual Variation in Working Memory Capacity
Alexander A. Stevens1,2*, Sarah C. Tappon1,2, Arun Garg1, Damien A. Fair2
1Department of Psychiatry, Oregon Health & Science University, Portland, Oregon, United States of America,2Department of Behavioral Neuroscience, Oregon Health & Science University, Portland, Oregon, United States of America
Abstract
Background:Cognitive abilities, such as working memory, differ among people; however, individuals also vary in their own day-to-day cognitive performance. One potential source of cognitive variability may be fluctuations in the functional organization of neural systems. The degree to which the organization of these functional networks is optimized may relate to the effective cognitive functioning of the individual. Here we specifically examine how changes in the organization of large-scale networks measured via resting state functional connectivity MRI and graph theory track changes in working memory capacity.
Methodology/Principal Findings: Twenty-two participants performed a test of working memory capacity and then underwent resting-state fMRI. Seventeen subjects repeated the protocol three weeks later. We applied graph theoretic techniques to measure network organization on 34 brain regions of interest (ROI). Network modularity, which measures the level of integration and segregation across sub-networks, and small-worldness, which measures global network connection efficiency, both predicted individual differences in memory capacity; however, only modularity predicted intra-individual variation across the two sessions. Partial correlations controlling for the component of working memory that was stable across sessions revealed that modularity was almost entirely associated with the variability of working memory at each session. Analyses of specific sub-networks and individual circuits were unable to consistently account for working memory capacity variability.
Conclusions/Significance:The results suggest that the intrinsic functional organization of ana priori defined cognitive control network measured at rest provides substantial information about actual cognitive performance. The association of network modularity to the variability in an individual’s working memory capacity suggests that the organization of this network into high connectivity within modules and sparse connections between modules may reflect effective signaling across brain regions, perhaps through the modulation of signal or the suppression of the propagation of noise.
Citation:Stevens AA, Tappon SC, Garg A, Fair DA (2012) Functional Brain Network Modularity Captures Inter- and Intra-Individual Variation in Working Memory Capacity. PLoS ONE 7(1): e30468. doi:10.1371/journal.pone.0030468
Editor:Lawrence M. Ward, University of British Columbia, Canada
ReceivedSeptember 22, 2011;AcceptedDecember 21, 2011;PublishedJanuary 20, 2012
Copyright:ß2012 Stevens et al. This is an open-access article distributed under the terms of the Creative Commons Attribution License, which permits unrestricted use, distribution, and reproduction in any medium, provided the original author and source are credited.
Funding:This work was supported by grants from the Fischer Family Foundation, the National Institute for Mental Health (MH077105), and the National Institute of Drug Abuse (DA021695) to AAS. The Oregon Clinical and Translational Research Institute grant MH091238, Medical Research Foundation, United Negro College Fund/Merck, and Ford Foundation funded DAF. The funders had no role in study design, data collection and analysis, decision to publish, or preparation of the manuscript.
Competing Interests:DAF received funding from the United Negro College Fund/Merck. This does not alter the authors9adherence to all the PLoS ONE policies on sharing data and materials.
* E-mail: stevenal@ohsu.edu
Introduction
Common experience reminds us that on some days we do not feel as mentally astute as on others. A poor night’s sleep, illness, or stressful life events all may influence our cognitive faculties and lead to variability in performance on different days. This intra-individual variability stands in contrast to the well-documented individual differences in intellectual performance.
Working memory, as measured by visual short-term memory (VSTM) capacity, is typically considered a stable characteristic of an individual’s cognitive functions and is closely linked to individual differences in human intellectual abilities [1–3]. However, endog-enous and exogendog-enous factors such as sleep disruption [4], psychosocial stress [5], and pharmacological manipulations [6] create intra-individual variability in cognitive performance, such
performance across different domains tends to vary together. Measures of functional organization of control systems may capture important sources of variability both between and within individuals across time.
We hypothesized that the functional organization of a system of brain regions implicated in a broad range of cognitive functions may predict working memory capacity in terms of individual differences. Furthermore, when measured on different days, the organization of these networks may also predict intra-individual variability in working memory capacity. The coherent organiza-tion of these networks during the absence of externally directed tasks (i.e., ‘‘resting state’’) may reflect the latent cognitive abilities of the brain at that time. Indeed, previous studies have demonstrated that low frequency variation in functional connec-tivity between brain regions, measured in the absence of experimenter imposed tasks, is associated with the functional roles attributed to those brain regions [15,16]. Graph-theoretic tools provide quantitative measurements of complex patterns of organization across a network, and have been effective in informing brain-behavior relationships based on functional and structural connectivity [17–20]. Recently, graph-theoretic analysis has been applied to human functional brain connectivity and specifically to detection and characterization of community structure in networks [21–24]. For example, small-world measures calculated on resting-state functional connectivity have revealed that network efficiency predicted individual differences in intellectual ability [25]. These findings suggest that the quantita-tive measures of network organization at a global network level capture important information about brain and behavior rela-tionships, even when measured in the absence of experimenter-imposed tasks [26]. Here, we tested the hypothesis that graph-theoretic measures of a functional brain network vary across days, and that this variation is linked to variation in visual short-term memory capacity both between and within individuals across time. We examined 34 brain regions (Table 1) that have been empirically identified in previous neuroimaging studies across a range of cognitive tasks [8,23,27,28]. We were particularly interested in the organizational properties of the network as a whole rather than specific connections or sub-networks. Therefore, we focused on network modularity, a statistic reflecting how well an entire network is organized into modules of densely interconnected nodes, but with the modules only sparsely interconnected [29–31]. Modularity captures an important organizational principle critical to biological systems; integration within sub-systems allows efficient local processing, while sparse connections between sub-systems reduce the propagation of noise [32]. We specifically hypothesized that since greater modularity characterizes optimal system organization, then the modularity of a network of brain regions associated with broad cognitive mechanisms should relate to cognitive performance, measured here as working memory capacity. Similarly, we expected another measure of network efficiency, small-worldness, to be associated with VSTM capacity. Small-worldness provides a somewhat different measure of organization of networks, reflecting high local inter-connectivity coupled with a shorter than expected distances between any two nodes due to sufficient inter-module connectivity or the presence of ‘‘hubs,’’ nodes that are densely connected to other nodes [33].
Results
Twenty- two participants completed an initial session and 17 returned three weeks later for a second identical session. At each session, they performed a VSTM task to provide memory capacity
estimates (Fig. 1B) followed by resting-state fMRI scans to measure the functional connectivity among 34 regions (Fig. 1A, Table 1). Network statistics presented here were calculated on each participant’s binarized graphs with a correlation threshold of r = 0.25. This threshold was based on several criteria (Text S1); however, the results hold over multiple thresholds (Fig. S1).
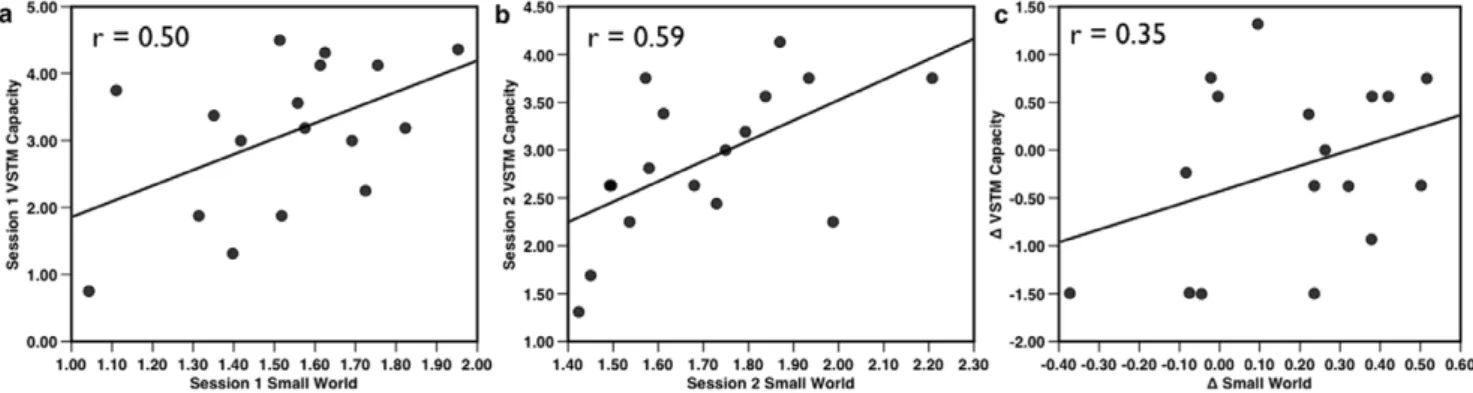
Individual modularity values ranged over 0.21–0.49, while the within-subject changes in modularity ranged from 0.01–0.14. Thus, modularity within individuals tended to be relatively stable compared to the differences between individuals. Visual short-term memory capacity was comparable across Session 1 (mean = 3.09) and Session 2 (mean = 2.89): paired t(16) = 0.834, p = 0.34. Individual’s network modularity and VSTM capacity were positively correlated at both Session 1 (r(20) = 0.56, p = 0.009) (Fig. 2a), and Session 2 (r(15) = 0.57, p = 0.008), indicating that working memory capacity indeed varies reliably with network modularity. (When only the 17 participants who completed both Sessions 1 and 2 were included in the analysis, the correlation between network modularity and VSTM at Session 1was comparable: r(15) = 0.54, p = 0.013). Strikingly, within-individual changes in VSTM capacity between Session 1 and Session 2 also correlated with the change in their network modularity between the two sessions (r(15) = 0.54, p = 0.013). Thus, network modularity not only captured significant variability in individual differences in working memory capacity, but also tracked the within-individual changes in memory between sessions. Importantly, another measure of global network organi-zation, small-worldness (Fig. 3), yielded similar correlations with VSTM capacity at both Session 1 (r (20) = 0.50, p = 0.042) and Session 2 (r(15) = 0.59, p = 0.013). However, unlike modularity, between-session changes in small-worldness were only weakly associated with changes in VSTM capacity (r(15) = 0.35, p = 0.17) (Fig. 3). Thus, like modularity, small-worldness is sensitive to individual differences in VSTM capacity; however, unlike modularity, it is relatively insensitive to intra-individual variability in capacity.
Modularity is associated with working memory variability
the partial correlations were comparable to their respective zero-order correlations between same-session modularity and capacity (Fig. 2). Modularity accounted for 25% of the variability in VSTM capacity measured on the same day over and above the variance accounted for by the same individual’s capacity measured at the other testing session. This indicates that network modularity was indeed linked more closely to variability in VSTM capacity rather than to the working memory capacity component that was stable across sessions. Together the stable component of working memory capacity (the correlation between working memory capacity sessions 1 and 2) and the variable component in working memory capacity that was accounted for by modularity in sessions 1 and 2, accounted for over 50% of participants’ working memory capacity at each session.
Working memory is not associated with sub-network components
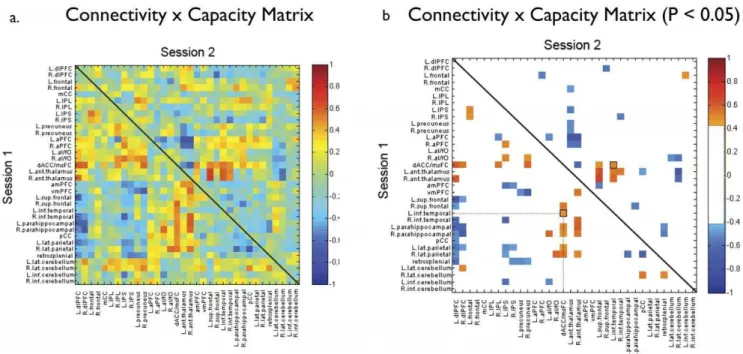
In order to ensure that the observed association between network level measures and inter- and intra-individual differences in working memory capacity were not due to simple connections between pairs of nodes or other sub-network information, we examined the relationship between all possible node pairs and VSTM capacity at both sessions. Only one pair of nodes (right parahippocampus – right thalamus) was correlated with capacity at both sessions (uncorrected for multiple correlations) (Fig. 4). Based on an uncorrected probability of p#0.05 at Session 1 and Session 2, we would expect 1.4 node pairs to be significantly correlated with VSTM capacity at both sessions by chance. The specific organization of the nodes within the modules of the Table 1.Regions of interest used as nodes in the network network analysis, drawn from [22,23].
Coordinates
Whole-brain region of interest (ROIs) Abbreviation X Y Z Module
dorsoloateral prefrontal cortex L.dlPFC 243 22 34 Fonto-parietal
dorsoloateral prefrontal cortex R.dlPFC 43 22 34 Fonto-parietal
Frontal L.frontal 241 3 36 Fonto-parietal
Frontal R.frontal 41 3 36 Fonto-parietal
mid cingulate cortex mCC 0 229 30 Fonto-parietal
inferior parietal lobule L.IPL 251 251 36 Fonto-parietal
inferior parietal lobule R.IPL 51 247 42 Fonto-parietal
intraparietal sulcus L.IPS 231 259 42 Fonto-parietal
intraparietal sulcus R.IPS 30 261 39 Fonto-parietal
Precuneus L.precuneus 29 272 37 Fonto-parietal
Precuneus R.precuneus 10 269 39 Fonto-parietal
anterior Prefrontal cortex L.aPFC 228 51 15 Cingulo-Opercular
anterior Prefrontal cortex R.aPFC 27 50 23 Cingulo-Opercular
anterior insula/frontal operculum L.aI/fO 235 14 5 Cingulo-Opercular anterior insula/frontal operculum R.aI/fO 36 16 4 Cingulo-Opercular
dorsal anterior cingulate/medial superior frontal cortex dACC/msFC 21 10 46 Cingulo-Opercular superior frontal cortex L.ant.thalamus 212 215 7 Cingulo-Opercular
anterior thalamus R.ant.thalamus 10 215 8 Cingulo-Opercular
anterior thalamus amPFC 1 54 21 Cingulo-Opercular
ventromedial prefrontal cortex vmPFC 23 39 22 Default
superior frontal cortex L.sup.frontal 214 38 52 Default
superior frontal cortex R.sup.frontal 17 37 52 Default
inferior temporal L.inf.temporal 261 233 215 Default
inferior temporal R.inf.temporal 65 217 215 Default
parahippocampal L.parahippocampal 222 226 216 Default
parahippocampal R.parahippocampal 25 226 214 Default
posterior cingulate cortex pCC 22 236 37 Default
lateral parietal L.lat.parietal 247 267 36 Default
lateral parietal R.lat.parietal 53 267 36 Default
retrosplenial retrosplenial 3 251 8 Cerebellar
lateral cerebellum L.lat.cerebellum 232 266 229 Cerebellar
lateral cerebellum R.lat.cerebellum 31 261 229 Cerebellar
inferior cerebellum L.inf.cerebellum 219 278 233 Cerebellar
inferior cerebellum R.inf.cerebellum 18 280 233 Cerebellar
network did not appear to be critical to working memory capacity. For instance, connection density within the modules of the network, which were defined in previous reports [22,23], may have accounted for the observed relationship between modularity
and working memory. Therefore, we determined the connection density based on the binarized and thresholded networks, and summed the weights of connections within the sub-networks. However, for none of the individual modules did the degree of Figure 1. Study design for a single session.The visual short-term memory task was administered prior to the resting state scans in Session 1 and three weeks later at Session 2.a) Functional MRI was conducted while subject maintained relaxed fixation on a crosshair. Low-frequency time course data was extracted from 34 brain regions (nodes) for each subject and a correlation matrix of all 34 nodes was constructed and binarized at a threshold of r = 0.25 for each participant. The community structure (modularity) of each participant’s network was determined using a modularity maximization technique [30], and is here visualized using a spring-embedded graph, with node colors indicating module membership (see Supplement for details).b) Example of the six-object VSTM task used to estimate working memory capacity. The individual participant’s capacity estimate and network modularity measures were used to computec) the correlation at each session and changes between sessions.
Figure 2. Association of Modularity and Visual short-term memory (VSTM) capacity.VSTM capacity measures were reliably correlated acrossa) Sessions 1 and 2 (p = 0.014).b) Modularity and VSTM capacity measured in Session 1 (n = 22) were correlated (p = 0.009) as well asc) when measured three weeks later at Session 2 (p = 0.017, n = 17).d) Individual participant’s changes in modularity and VSTM capacity between Session 1 and Session 2 were also strongly correlated (p = 0.014), indicating that changes in subject’s VSTM capacity were reflected in the change in their network modularity. All tests two-tailed.
doi:10.1371/journal.pone.0030468.g002
global intra-modular connectivity reliably account for working memory capacity. Similarly, the connectivity strength between modules of these previously defined nodes failed to produce significant correlation with working memory capacity (Table 2). These results suggest that the organization of the nodes into specific modules is not critical, and that there may be many ways in which these neural systems can create effective functional organizations.
One logical alternative network that could account for working memory capacity is the set of regions reported to be active during a VSTM task [34,35]. Therefore we used as nodes, the six regions of interest specifically related to VSTM capacity identified in the study reported by Xu and Chun [34], which subsumed the regions reported by Todd and Marois [35]. Because the set of six regions was too small to submit to meaningful graph analysis, we calculated the correlation matrix among all six nodes and determined if any functional connections consistently predicted VSTM capacity (Fig. 5). No consistent correlation between
VSTM capacity and connectivity between node-pairs was evident, indicating that resting state connectivity is likely tapping into brain interactions that are different from those detected during task-related activity. This result may reflect the possibility that separate mechanisms important for information processing may be detected by these different functional imaging approaches. For instance, resting-state may be capturing general functional organization of the brain (the cognitive ‘‘tone’’ of the brain), while event-related fMRI captures the actual responsiveness of these brain regions during task-based activity.
Discussion
The current study used network theoretic measures applied to resting state fMRI data to determine if the organization of a specific network of generalized control regions was associated with variability in working memory capacity. Modularity, and to a similar degree, small-worldness of this network, reliably accounted for individual differences in working memory capacity at both session 1 and session 2. The replication of this relationship at two separate sessions provided a robust test of the reliability of the relationship between network organization and working memory. More strikingly, the change in an individual’s network modularity between the two sessions predicted the change in working memory capacity. These observations together suggest that organizational characteristics of a broad functional network across a variety of cognitive tasks contain information about latent cognitive functions [8].
We specifically focused on these global network variables due to mounting evidence that organizational properties of an entire functional network are linked to intellectual functions and learning [25,26], and therefore may capture properties of effective cognitive functioning. Working memory, which contributes to many aspects of daily cognition, is likely to be a particularly good bell-weather for variation in cognitive performance. It is important to stress that we do not interpret the relationship between modularity and Figure 4. The correlation matrix for connection weights between nodes and VSTM.Capacitya) in Session 1 (lower triangle) and Session 2 (upper triangle).b) For clarity, the same correlation matrix with non-significant connections eliminated (threshold r = 0.47, p#0.05, uncorrected for multiple correlations).
doi:10.1371/journal.pone.0030468.g004
Table 2.Correlations between VSTM capacity and intra-module connection density, and between intra-module connectivity.
Network modules Session 1 Session 2 Change
Fronto-Parietal 0.28 0.09 20.12 Cingulate-Operculum 20.06 20.58* 20.35 Default Mode Network 20.31 20.41 0.13 Within-module connectivity across
network
20.17 20.78** 20.33
Between Module Connectivity 20.35 20.11 20.25
*P,0.05, uncorrected; **P,0.01, uncorrected.
working memory capacity to indicate that the defined network is responsible for working memoryper se.Rather, we interpret these results to reflect brain-behavioral relationships that are likely to extend across a variety of cognitive demands. This interpretation is consistent with the set of ROIs used here, which were selected based on their consistent activity across a wide range of cognitive tasks and studies [22,23,37,38]. It is possible that systemic factors, life stressors, and sleep quality, which all have demonstrable effects on cognitive functions, including working memory [4–6], may leave their imprint on the functional organization of neural systems associated with a broad array of generalized control related functions.
One issue that remains only partially resolved in this study is whether specific circuits among the nodes accounts for working memory capacity equally well or better than their global organization as measured via modularity. While we did not exhaust the full extent of possibilities, we did attempt to rule out some alternative explanations of this sort. For example, we did not find a reliable association with working memory capacity at the level of single nodal connections (Figure 5), nor at the level of sub-networks (Table 2). This included an examination of fronto-parietal systems that are clearly involved in visuo-spatial working memory functions [12,13,36]. In the same vein, we tested a set of posterior parietal regions identified in previous event-related fMRI studies of working memory capacity that employed very similar VSTM tasks to the task used in the current study to measure working memory capacity [11,34,35]. These studies converged on a small set of posterior parietal regions that were very closely linked to working memory capacity. However, the analysis of resting-state connectivity among this small set of nodes [11,35] also failed to detect an association with working memory capacity. These results do not rule out the possibility that there is an optimal set of nodes whose organization predicts working memory from resting state data, nor can we be sure that other brain regions not included in the network may provide important predictive information about latent cognitive functions. However, brain regions included as nodes in this study have been repeatedly implicated in a wide range of control related functions identified during fMRI studies where active tasks were compared to resting baseline conditions [8,37–39]. Therefore, the information con-tained in resting state networks appears to complement evidence from event-related fMRI studies [11,35] and electrophysiological evoked potential data [10].
The current work does not attempt to identify whether there is a single optimal brain organization that determines cognitive performance. However, there is some evidence that while performance appears to be determined by the efficient neural interactions among brain systems, multiple ‘‘optimal’’ configura-tions may exist. For example, a recent fMRI study by Bassett and colleagues, reported changes in functional connectivity while individuals acquired a complex motor task [26]. They found that while modularity of the group was relatively stable across time, a measure of ‘‘flexibility’’, described as the degree to which individual nodes would shift between modules, was predictive of subsequent changes in motor learning [26]. Bassett and colleagues did not report modularity as a predictor of individual perfor-mance, but their results suggest that a specific organization may not be a critical starting point as long as modularity is reasonably high.
A limitation to this study, common to most ‘‘resting-state’’ investigations, is that the experimenter gives up control over the structure of the stimulation of the brain. Consequently, it is possible that the correlation we observed may reflect differences in the internal thought-processes of the individuals, or other unconstrained variable, which may be directly or indirectly related to working memory capacity. However, such a variable must also be linked to the modularity and small-world characteristics of the functional network.
these regions combined with the interactions between them (even when unchallenged by an externally imposed task), reflect the state of organization of neural systems necessary for complex cognitive tasks [43].
Materials and Methods
Ethics Statement: This research protocol was reviewed and approved by the OHSU Research Integrity Office’s Internal Review Board
Participants. In the initial experimental session, 22 indivi-duals (15 females, 7 males; mean age = 27.5 yrs; SD = 4.8 yrs) participated in the first session after providing written informed consent. Seventeen of the original participants returned for an identical session three weeks after their first visit. All participants were right-handed, had normal or corrected-to-normal vision, and had no history of brain damage, learning disability, psychiatric diagnosis, or neurological problems. Informed written consent was obtained from all participants.
Visual Short-Term Memory task. The visual working memory procedure was based on the task described by Vogel and colleagues [40]. It required participants to remember two or six colored squares presented briefly (100 ms) on a computer monitor. Following a 2500 ms delay, a probe stimulus was displayed and participants indicated whether it was the same color and location as one of the squares from the original stimulus set. In a third of the trials, the two colored squares were presented with four distracters in the form of colored rectangles. Participants were told to ignore the distracters and only remember the squares [40]. Working memory capacity estimates were computed for the six-stimulus condition, as capacity K =s*(H - F), where s is the number of stimuli in the memory array, H is the number of hits and F is the number of false alarms [41]. At each session, participants completed 192 trials, 64 of each condition inter-mixed in four blocks of 48 trials.
MRI data acquisition. All MRI scans were performed on a Siemens 3 Tesla TIM-TRIO system. Structural images were obtained using a sagittal magnetization-prepared rapid gradient echo (MP-RAGE) three-dimensional T1-weighted sequence (TR = 9.7 ms, TE = 4 ms, flip angle = 12u, TI = 300 ms, voxel size = 1.256161 mm, slices = 128). Functional images were obtained using a gradient-echo, echo-planar sequence sensitive to blood oxygen level-dependent (BOLD) contrast (TR = 2000 ms; TE = 30 ms; FOV = 240 mm3; flip angle = 90u). Participants completed two scans consisting of 150 acquisitions of 33 contiguous interleaved 3.8 mm axial slices, which were acquired parallel to the plane transecting the anterior and posterior commissure. This covered the entire cerebrum and all but the most inferior portion of the cerebellum. Steady state magnetization was assumed after four frames (,8 seconds).
Functional MRI Data preprocessing. The resting state fMRI preprocessing included (i) removal of a central spike caused by MR signal offset, (ii) correction of odd vs. even slice intensity differences attributable to interleaved acquisition without gaps, (iii) correction for head movement within and across runs, and (iv) within-run intensity normalization to a whole brain mode value gradient of 1000. Atlas transformation3of the functional data was computed for each individual via the MP-RAGE. Each rs-fMRI run was then resampled in atlas space on an isotropic 3.0 mm3 grid combining the six parameters for movement correction and atlas transformation in one interpolation. All subsequent operations were performed on the atlas-transformed volumetric time series. As previously described [4], several additional preprocessing steps were used to reduce spurious variance
unlikely to reflect neuronal activity. These steps included: (a) a temporal band-pass filter (0.009 Hz,f,0.08 Hz) and spatial smoothing (6 mm full width at half maximum), (b) regression of six parameters obtained by rigid body head motion correction, (c) regression of the whole brain signal averaged over the whole brain, (d) regression of ventricular signal averaged from ventricular ROI, and (e) regression of white matter signal averaged from white matter ROI. Regression of first order derivative terms for the whole brain, ventricular, and white matter signals were also included in the correlation preprocessing.
Motion-related signal was also removed from all analyses between graph theoretic measures and VSTM capacity. For each subject, the root mean square of the sum of the estimates of the six orthogonal motion parameters was calculated for each fMRI scan and averaged within-session. This was then regressed against the statistic of interest (e.g., Modularity) and the residual of the regression used as the corrected estimate of the statistic. The residuals were re-expressed in original units around the mean value of the statistic (e.g., corrected Modularity).
Regions of interest. The ROIs (Table 1) were selected based on earlier studies of cortical regions that were detected across multiple studies using a variety of cognitive tasks. The ROIs included nodes identified as part of the default-mode network [27,28]. Each ROI (node) consisted of a 10 mm3sphere centered on the peak loci of activation reported in those studies. Mean time courses were extracted from the 34 ROIs in previous work. Each participant’s ROI timecourses were inter-correlated to form a 34634 connectivity matrix representing the strength of connection between every pair of ROIs. Subsequent network analyses were performed on these matrices.
Graph Construction
two nodes in the graph, must not differ significantly from 1.0. Setting T to correlations of 0.25 to 0.30 satisfied these conditions for all individual subject connectivity maps. We note that this approach allows the number of connections included in the network to vary across participants.
We also performed the network thresholding using the connection density thresholds to binarize the individual partici-pants correlation matrices (Text S1). Unlike correlation based thresholds which allow the number of connections in the network to vary between subjects, connection density holds the number of connections in the network constant by retaining the specified proportion of connections determined by correlation strength. While this approach produced similar results at session 1, in terms of the relationship between small-worldness and VSTM capacity, it failed to reveal the same relationship at Session 2 (see Figure S2).
Reachability. A measure of the proportion of nodes that are connected by any path, regardless of the path length (i.e. the number of intervening nodes that must be traversed in order to reach one node from the other). A low reachability score implies a fragmented graph where some nodes are completely disconnected from all others in the network, which is biologically implausible as a model of the brain [8].
Small-worldness. A measure of global network organization, reflects high local inter-connectivity coupled with a shorter than expected distances between any two nodes due to the presence of ‘‘hubs’’ - nodes that are densely connected to other nodes. It is defined in terms of clustering coefficient and characteristic path length [10,11]. Characteristic path length (l)
is a measure of the mean number of links that must be traversed in order to travel between any two nodes in the network. Clustering coefficient (C) is a measure of the average proportion of a node’s nearest neighbors that are also connected to each other. Small-world networks possess a clustering coefficient that is much larger than a random graph, and a characteristic path length that is equal or only slightly larger than in a random graph. The ‘small-worldness’ of a network (S) can thus be quantified as (Creal/ Crandom)/(lreal/lrandom) [11,12].
Modularity estimation. Modularity, or community structure, is a technique for subdividing the network into separate modules (communities), which maximize the connections within each module and minimize the connections between modules [8,9,13]. Modularity is estimated using optimization algorithms. Network modularity values in the current study were estimated using the method of Newman [9] and then confirmed using the algorithm developed by Blondel [13]. As the Blondel modularity algorithm is non-deterministic and can yield slightly different values of modularity for a given network across multiple runs, we calculated modularity using both these techniques for each subject by averaging across 100 iterations of the algorithm. The two different modularity estimates converged to near unity at both sessions (Session 1: r(15) = 0.98, p,0.001; Session 2: r(15) = 0.98, p,0.001). We further tested the reliability of the modularity values using the Variation of Information, a measure of the stability of the network’s organization [42] (Text S1, Figure S3).
Supporting Information
Figure S1 Graphs demonstrating the divergence of the real graphs from random graphs as a function of matrix thresholds for different measures of network organiza-tion.The individual networks obtained in Session 1 and Session 2 were compared to random networks constructed with the same number of nodes, connections and connection density.a) Reach-ability did not differ significantly from 100% when thresholds correlations were set below r = 0.30 (maximum t(16)=21.5,
p= .16), indicating that these thresholds preserve full connected-ness of the network in most individual networks.b) Characteristic path length, and c) clustering coefficient were significantly different from the random graphs across all threshold correlations (r), where 0.05#r#0.50. c) Small-worldness (S), calculated as a ratio (Clusteringreal/Clusteringrandom)/(Path Lengthreal/Path Length
ran-dom), such that values different from 1.0 reflect a departure from randomness.d) Small-worldness for Sessions 1 and 2 had values greater than 1.0 at all threshold values $0.05. None of the network properties varied significantly between the two sessions at any threshold. Error bars in all graphs are61 standard errors of the mean.e) The correlation between modularity and visual short-term memory capacity varied as a function of threshold but showed comparable trends across sessions and thresholds. (TIFF)
Figure S2 The effect of connection density (i.e., cost) threshold level on the correlation between network modularity and VSTM capacity. Connection density reflects the proportion of connec-tions included in the network from all possible connecconnec-tions among the 34 nodes.
(TIFF)
Figure S3 Variation of Information (VOI) for the real and random graphs for Session 1 and Session 2, calculated individually for each subject and then averaged. Alpha is the proportion of connections between nodes that are randomly reassigned. Increased VOI reflects the loss of information between in perturbed network compared to the unperturbed network, with larger changes reflecting greater instability. Dashed line indicates the value VOI would have if 20% of the nodes were randomly assigned to new modules relative to their assignment in the original network. This reassignment was 0.15 for real networks but only 0.02 for the random networks. Note that the random networks show an immediate increase in VOI, reflecting the instability of their modularity estimates.
(TIFF)
Text S1 Description of supplementary network thresh-olding analyses.
(DOC)
Acknowledgments
The authors thank A. McGee for editorial help with the manuscript.
Author Contributions
Conceived and designed the experiments: AAS AG. Performed the experiments: SCT. Analyzed the data: AAS SCT DAF. Contributed reagents/materials/analysis tools: DAF. Wrote the paper: AAS SCT AG DAF.
References
1. Engle RW, Kane MJ, Tuholski SW (1999) Individual differences in working memory capacity and what they tell us about controlled attention, general fluid
2. Cowan N, Elliott EM, Scott Saults J, Morey CC, Mattox S, et al. (2005) On the capacity of attention: Its estimation and its role in working memory and cognitive aptitudes. Cognitive psychology 51: 42–100.
3. Fukuda K, Vogel E, Mayr U, Awh E (2010) Quantity, not quality: the relationship between fluid intelligence and working memory capacity. Psychon Bull Rev 17: 673–679.
4. Chee MWL, Tan JC, Zheng H, Parimal S, Weissman DH, et al. (2008) Lapsing during sleep deprivation is associated with distributed changes in brain activation. Journal of Neuroscience 28: 5519.
5. Schoofs D, Preuss D, Wolf OT (2008) Psychosocial stress induces working memory impairments in an n-back paradigm. Psychoneuroendocrinology 33: 643–653.
6. Vijayraghavan S, Wang M, Birnbaum SG, Williams GV, Arnsten AFT (2007) Inverted-U dopamine D1 receptor actions on prefrontal neurons engaged in working memory. Nat Neurosci 10: 376–384.
7. Spoormaker (2010) Development of a Large-Scale Functional Brain Network during Human Non-Rapid Eye Movement Sleep. N Engl J Med 30: 11379–11387.
8. Dosenbach NU, Visscher KM, Palmer ED, Miezin FM, Wenger KK, et al. (2006) A core system for the implementation of task sets. Neuron 50: 799–812. 9. Bressler SL, Menon V (2010) Large-scale brain networks in cognition: emerging
methods and principles. Trends Cogn Sci.
10. Vogel EK, Machizawa MG (2004) Neural activity predicts individual differences in visual working memory capacity. Nature 428: 748–751.
11. Todd JJ, Marois R (2005) Posterior parietal cortex activity predicts individual differences in visual short-term memory capacity. Cognitive, Affective, & Behavioral Neuroscience 5: 144–155.
12. Duncan J (2001) An adaptive coding model of neural function in prefrontal cortex. Nat Rev Neurosci 2: 820–829.
13. Miller EK, Cohen JD (2001) An integrative theory of prefrontal cortex function. Annu Rev Neurosci 24: 167–202.
14. McNab F, Klingberg T (2007) Prefrontal cortex and basal ganglia control access to working memory. Nat Neurosci 11: 103–107.
15. Hampson M, Peterson BS, Skudlarski P, Gatenby JC, Gore JC (2002) Detection of functional connectivity using temporal correlations in MR images. Hum Brain Mapp 15: 247–262.
16. Hampson M, Driesen NR, Skudlarski P, Gore JC, Constable RT (2006) Brain connectivity related to working memory performance. J Neurosci 26: 13338–13343.
17. Tononi G, Sporns O, Edelman GM (1994) A measure for brain complexity: relating functional segregation and integration in the nervous system. Proc Natl Acad Sci U S A 91: 5033.
18. Sporns O, Tononi G, Edelman GM (2000) Theoretical neuroanatomy: relating anatomical and functional connectivity in graphs and cortical connection matrices. Cerebral Cortex 10: 127.
19. Sporns O, Chialvo DR, Kaiser M, Hilgetag CC (2004) Organization, development and function of complex brain networks. Trends Cogn Sci 8: 418–425.
20. Bullmore E, Sporns O (2009) Complex brain networks: graph theoretical analysis of structural and functional systems. Nat Rev Neurosci 10: 186–198. 21. Achard S, Salvador R, Whitcher B, Suckling J, Bullmore E (2006) A resilient,
low-frequency, small-world human brain functional network with highly connected association cortical hubs. J Neurosci 26: 63–72.
22. Dosenbach NU, Fair DA, Miezin FM, Cohen AL, Wenger KK, et al. (2007) Distinct brain networks for adaptive and stable task control in humans. Proc Natl Acad Sci U S A 104: 11073–11078.
23. Fair DA, Cohen AL, Power JD, Dosenbach NU, Church JA, et al. (2009) Functional brain networks develop from a ‘‘local to distributed’’ organization. PLoS Comput Biol 5: e1000381.
24. Meunier D, Achard S, Morcom A, Bullmore E (2009) Age-related changes in modular organization of human brain functional networks. Neuroimage 44: 715–723.
25. van den Heuvel MP, Stam CJ, Kahn RS, Hulshoff Pol HE (2009) Efficiency of functional brain networks and intellectual performance. J Neurosci 29: 7619–7624.
26. Bassett DS, Wymbs NF, Porter MA, Mucha PJ, Carlson JM, Grafton ST (2011) Dynamic reconfiguration of human brain networks during learning. Proc Natl Acad Sci U S A.
27. Fox MD, Snyder AZ, Vincent JL, Raichle ME (2007) Intrinsic fluctuations within cortical systems account for intertrial variability in human behavior. Neuron 56: 171–184.
28. Dosenbach NUF, Fair DA, Cohen AL, Schlaggar BL, Petersen SE (2008) A dual-networks architecture of top-down control. Trends Cogn Sci 12: 99–105. 29. Girvan M, Newman MEJ (2002) Community structure in social and biological
networks. Proc Natl Acad Sci U S A 99: 7821.
30. Newman MEJ (2006) Modularity and community structure in networks. Proceedings of the National Academy of Sciences 103: 8577.
31. Rubinov M, Sporns O (2010) Complex network measures of brain connectivity: uses and interpretations. Neuroimage 52: 1059–1069.
32. Simon HA (1962) The architecture of complexity. Proceedings of the American Philosophical Society 106: 467–482.
33. Strogatz SH (2001) Exploring complex networks. Nature 410: 268–276. 34. Todd JJ, Marois R (2004) Capacity limit of visual short-term memory in human
posterior parietal cortex. Nature 428: 751–754.
35. Xu Y, Chun MM (2006) Dissociable neural mechanisms supporting visual short-term memory for objects. Nature 440: 91–95.
36. Goldman-Rakic PS (1988) Topography of cognition: parallel distributed networks in primate association cortex. Annu Rev Neurosci 11: 137–156. 37. Posner MI, Petersen SE (1990) The attention system of the human brain. Annu
Rev Neurosci 13: 25–42.
38. Shulman GL, Corbetta M, Buckner RL, Fiez JA, Miezin FM, et al. (1997) Common blood flow changes across visual tasks: I. Increases in subcortical structures and cerebellum but not in nonvisual cortex. J Cogn Neurosci 9: 624–647.
39. Duncan J, Owen AM (2000) Common regions of the human frontal lobe recruited by diverse cognitive demands. Trends Neurosci 23: 475–483. 40. Vogel EK, McCollough AW, Machizawa MG (2005) Neural measures reveal
individual differences in controlling access to working memory. Nature 438: 500–503.
41. Cowan N (2001) The magical number 4 in short-term memory: a reconsideration of mental storage capacity. Behav Brain Sci 24: 87–114; discussion 114–85.
42. Karrer B, Levina E, Newman MEJ (2008) Robustness of community structure in networks. Phys Rev E Stat Nonlin Soft Matter Phys 77: 46119.