Identifying Metabolic Subpopulations from
Population Level Mass Spectrometry
Christine M. DeGennaro1☯, Yonatan Savir2☯, Michael Springer1 *
1Department of Systems Biology, Harvard Medical School, Boston, Massachusetts, 02115, United States of America,2Department of Physiology, Biophysics and Systems Biology, Faculty of Medicine, Technion, Haifa, 31096, Israel
☯These authors contributed equally to this work. *[email protected]
Abstract
Metabolism underlies many important cellular decisions, such as the decisions to proliferate and differentiate, and defects in metabolic signaling can lead to disease and aging. In addi-tion, metabolic heterogeneity can have biological consequences, such as differences in out-comes and drug susceptibilities in cancer and antibiotic treatments. Many approaches exist for characterizing the metabolic state of a population of cells, but technologies for measur-ing metabolism at the smeasur-ingle cell level are in the preliminary stages and are limited. Here, we describe novel analysis methodologies that can be applied to established experimental methods to measure metabolic variability within a population. We use mass spectrometry to analyze amino acid composition in cells grown in a mixture of12C- and13C-labeled sugars; these measurements allow us to quantify the variability in sugar usage and thereby infer information about the behavior of cells within the population. The methodologies described here can be applied to a large range of metabolites and macromolecules and therefore have the potential for broad applications.
Introduction
Many biological assays involve bulk measurements. While extremely powerful, these mea-surements cannot identify underlying stochastic variation and heterogeneity, which are com-mon in many biological processes [1]. Single cell heterogeneity underscores many important biological behaviors such as bacterial persistence [2,3] and has helped to identify new sub-populations of cells [4–6]. In each case, novel techniques were required to monitor single cell variability.
Cellular metabolism determines the energetics and redox state of the cell, and proper regu-lation of metabolic pathways are critical for cell function. Defects in metabolism are associ-ated with aging, neurodegeneration, obesity, diabetes, and cancer, and characterizing the cellular metabolic state in these diseases is critical for understanding and treating them (reviewed in [7–9]). Methods exist for characterizing the metabolic state of a population of cells. For example, isotopic labeling can be used in conjunction with constraint based OPEN ACCESS
Citation:DeGennaro CM, Savir Y, Springer M (2016) Identifying Metabolic Subpopulations from Population Level Mass Spectrometry. PLoS ONE 11(3): e0151659. doi:10.1371/journal.pone.0151659
Editor:Akos Vertes, The George Washington University, UNITED STATES
Received:November 11, 2015
Accepted:March 2, 2016
Published:March 17, 2016
Copyright:© 2016 DeGennaro et al. This is an open access article distributed under the terms of the
Creative Commons Attribution License, which permits unrestricted use, distribution, and reproduction in any medium, provided the original author and source are credited.
Data Availability Statement:All mass spectrometry data files and code files are available from the Dryad database (doi:10.5061/dryad.gf80t).
Funding:This study was supported by the National Science Foundations Grant 1349248 and the National Institutes of Health P50 GM107618 (M.S.), the Milton Fellowship and Novartis Postdoctoral Fellowship (C.M.D.), and the Human Frontier Science Program (Y.S.). The funders had no role in study design, data collection and analysis, decision to publish or preparation of the manuscript.
modeling to quantify the activity of metabolic pathways. However, in some cases, such as in a tumor, there may be significant cellular heterogeneity, and characterizing this variation could be critical for treatment. While there are several methods under development that use approaches such as micropipetting, microfluidics, and cell arraying to allow single cell mass spectrometry analysis (reviewed in [10,11]), these approaches are highly specialized and tech-nically difficult. Several recent studies have developed analytical approaches to deconvolve a mixed population using mass spectrometry measurements of metabolic incorporation of13C labeled carbohydrates. One study used species specific peptides to characterize the flux of two populations within a microbial community [12]. However, this approach requires that the two subpopulations be different at the proteomic level, and precludes analysis of diver-gent behaviors within a genetically identical population. Another study characterized the flux and population size of twoE.colimutants with divergent metabolic behaviors by fitting flux models assuming one or two behaviors within the population [13]. However, this approach worked best with [1,2-13C]glucose labeling, and involved normalization of the flux of glucose into the cell, and therefore was intended for cells grown in a single carbon environment. Here, we take a similar analysis approach to determine metabolic variance in a population grown in a mixture of carbon sources, in order to address questions about metabolic choice. Our approach takes advantage of established experimental techniques and knowledge about population based mass spectrometry measurements [14,15], but extends the analysis to allow fitting of multiple subpopulations. We use a simple and easily adaptable model, which, rather than determining the flux within in the pathway, can easily identify divergent uptake behav-iors. This model works well with [U-13]C labeled carbohydrates, which maximizes opportu-nity to identify metabolic mixing and reflux [16]. We validate and characterize this analysis using a variety of experimental, rather than simulated, data to ensure the robustness of our approach. For all these reasons, this approach is simple to perform and transferrable to many biological systems.
Results
An Amino Acid Biosynthetic Model Recapitulates the Different Behavior
of One- and Two-State Populations
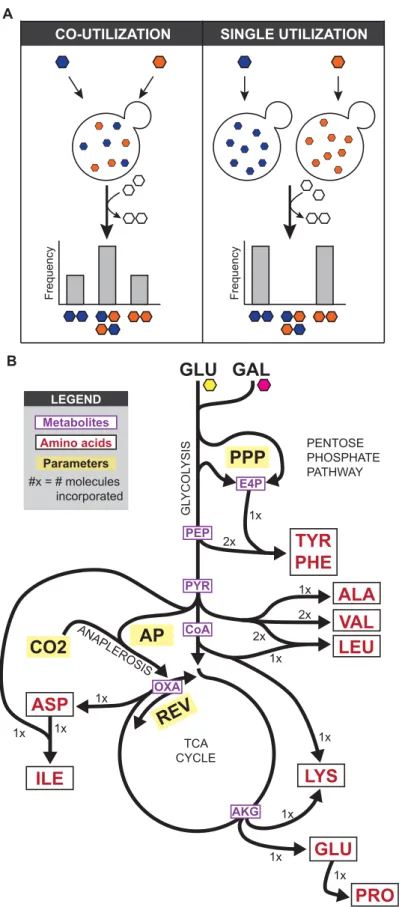
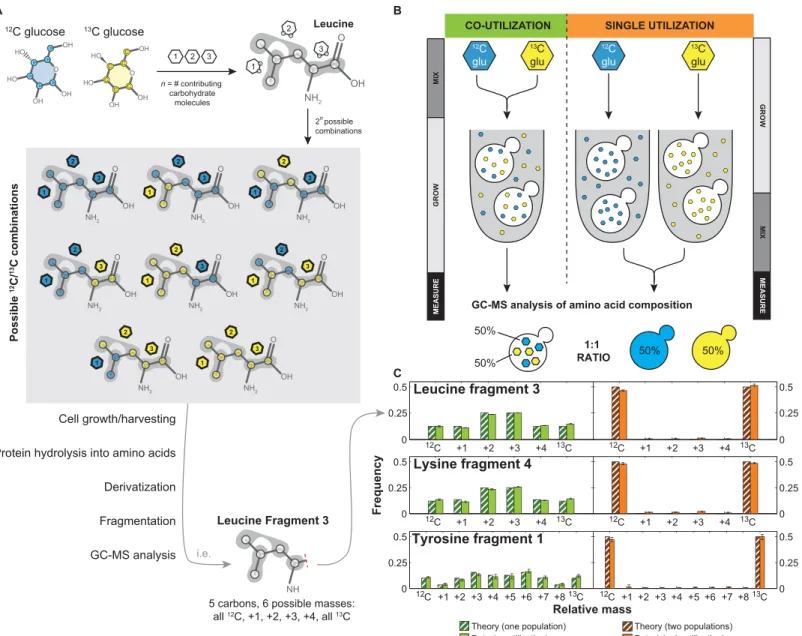
We used amino acid composition as a read-out of sugar utilization in yeast, as amino acids are built from multiple metabolic precursors derived from sugars like glucose and galactose. As we were mainly interested in differences in uptake, we simplified current models of metabolism [17], taking into account only the major pathways responsible for amino acid synthesis from glucose and galactose, including glycolysis, anaplerotic reactions, and the tricarboxylic acid (TCA) cycle (Fig 1B). Additionally we fit the relative flux at each of the following metabolic branch points: anaplerotic synthesis versus TCA cycle (AP), the reverse vs forward TCA cycle (REV), the composition of erythose-4-phosphate produced by the oxidative and non-oxidative pentose phosphate pathway (PPP), and the fraction of carbon dioxide incorporated from the air versus recaptured from glycolysis (CO2) (Fig 1B). We modeled all isotopic species, and then calculated cumomer distributions for each of the amino acid fragments. This model then allowed us to predict the composition of each amino acid given single or co-utilization under specific biochemical conditions; for example, leucine is composed of carbons derived from three metabolites (an acetyl CoA and two pyruvates) derived from independent carbohydrate molecules, producing 23, or 8, possible isotopomers (Fig 2A). Cultures were grown in a mixture of heavy and light sugars; for all experiments, we used [U-13C] glucose as the heavy sugar, as it is optimal for differentiation of subpopulations. After harvesting, cells were processed as previ-ously described [17]. Briefly, the proteins were acid hydrolyzed into amino acids, which were then derivatized with N-tertbutyldimethylsilyl-N-methyltrifluoroacetamide and measured by GC-MS. Previous work has shown this can produce 5 distinctly measurable fragment of most amino acids [18]; our model can predict the theoretical mass distribution of each of these frag-ments in the case of co-utilization and single utilization.
In order to validate our method, we performed a proof-of-principle experiment where we grew cells in scenarios where they co-utilized or single utilized carbon sources. To achieve this, we either grew cells in a 50%-50% mixture of12C and13C glucose (experiment referred to as
“mix then grow”) or grew them independently in either 100%12C or13C glucose and then mixed them in a 50%-50% ratio just before cell lysis (experiment referred to as“grow then mix”) (Fig 2B). The12C and13C glucose are biologically equivalent and should cleanly be co-utilized and single co-utilized, respectively.
Using our model, we calculated the expected amino acid distributions for single and co-uti-lization in glucose (Fig 2C). GC-MS analysis of the experimental samples showed that the data closely matched our theory for the appropriate number of subpopulations (Fig 2C). For the 29 amino acid fragments that we will analyze here (S1 Table), the overall Pearson correlation for the mix then grow (one-state model) experiment is 0.97 for the one-state theory and the grow then mix (two-state model) experiment is 1.00 for two-state. When using the wrong model (i.e. the two-state model to fit the one-state experiment or one-state model to fit the two-state If cells are co-utilizing both metabolites (left) there will be macromolecules composed of a mixture, while if there are subpopulations of single utilizing cells (right), there will be only pure macromolecules. (B) A model for amino acid biosynthesis from glucose (GLU) and galactose (GAL) in yeast, based on a simplified version of central carbon metabolism. Amino acids are shown in red, metabolites are shown in purple, and free biochemical parameters are highlighted in yellow. Numbers indicate the number of each metabolite incorporated into the amino acid.
experiment) the correlation coefficient drops to 0.33 and 0.35 respectively, which is similar to that of the one- and two-state theories to each other (0.33). The remaining correlation is partly due to the fact that fragments produced from a single carbon source (i.e. fragment 5) have the same distribution in both models; removing these fragments decreases the correlation coeffi-cient to 0.13 and 0.15 for the wrong models, and the model-to-model correlation to 0.14. How-ever, the coefficient for the correct models, even without these fragments, remains 0.96 and 1.00. These results indicate, first, that one- and two-state populations are distinguishable by Fig 2. Amino acid composition reflects sugar utilization.(A) Differentially labeled12C and13C glucose are incorporated into amino acids; for example, leucine contains contributions from three different carbohydrate molecules, creating 23, or 8, possible12C/13C combinations. After derivatization, this creates amino acid fragments with carbohydrate compositions predictable by our model. (B) Proof of principle co-utilization experiment created by mixing12C and 13C glucose and growing cells in the mixture (
“mix then grow”) and single utilization experiment created by growing cells separately in each carbon source and combining them (“grow then mix”). (C) The amino acid metabolic model recapitulates amino acid composition data from GC-MS analysis of these experiments, with co-utilization closely matching the one-state model and single utilization of subpopulations closely matching the two-state model (Pearson’s correlation is 0.997 and 0.967, respectively, over all fragments). For the data, bars represent the mean of three biological replicates, with error bars corresponding to the standard error of the mean. For the theory, the following biochemical parameters were used to calculate the distributions: CO2 = 0.1, AP = 0.9, REV = 0.5, PPP = 0.5.
this method, and second, that our model accurately recapitulates the observed amino acid distributions.
Fitting GC-MS Data with One- and Two-State Models Allows Inference
of Subpopulation Characteristics
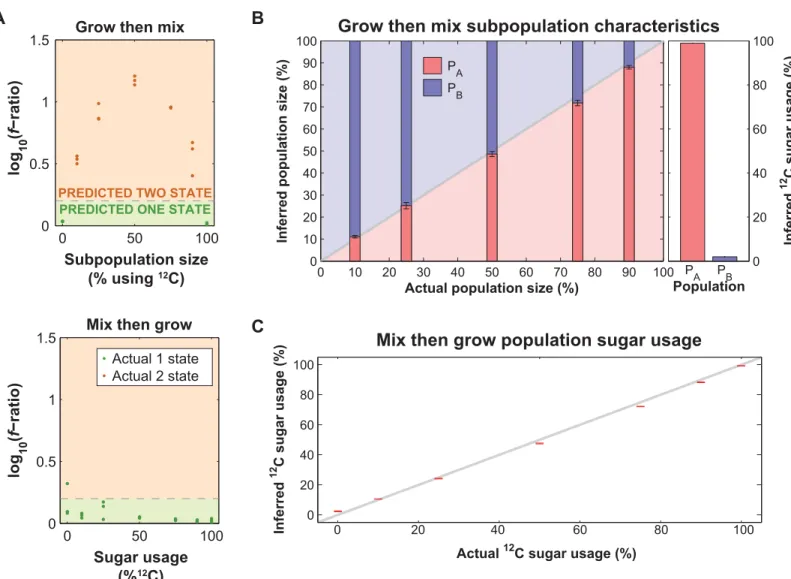
Given the success of our model at simulating the experimental data, we asked if fitting our model to the amino acid data could predict (1) if subpopulations are present, (2) the relative size of any subpopulations, and (3) the sugar usage fraction of each subpopulation (in this case, the fraction of13C-glucose and12C-glucose used). To evaluate the models and determine whether subpopulations are present, we calculate the square root of the sum squared of the residuals between the measurement and theory (f). Because the two-state model has more parameters than the one-state model (11 vs. 5), it always has a lowerfvalue than the one-state model even if the one-state model is correct, due to overfitting. We found that neither the Akaike information criterion [19] nor Bayesian information criterion [20] discriminated between the models, likely due to the relatively low number of total measurements compared to the number of parameters. We therefore chose an empiric threshold of 0.2 for the log differ-ence offas a cut-off to distinguish between one- and two-state models (Fig 3A, bottom panel). Above this threshold, the two-state model is determined to fit best; below this threshold, a one-state model is determined to fit best. This threshold corresponds approximately to a 5% false discovery rate (20/21 experiments classified as two-state), but given the limited number of sam-ples it is not possible to rigorously define the threshold in this way.
Using this threshold defined by analysis of the one-state model, we tested whether this threshold was able to accurately classify two-state models. We created 15 two-state“grow then mix”experiments by growing cultures in pure12C- or pure13C-glucose and pooling in varying ratios (Fig 2B). Additionally, we included 6 new samples grown either in pure12C or13C as controls, allowing us to test our predictions. We found that this threshold correctly predicted the number of states in all 21 of the one and two-state population samples; as expected the dif-ference inf-ratio is maximized when the12C or13C glucose samples are mixed 50:50% (Fig 3A, top panel). Additionally, we find that the two-state model accurately predicts both the fraction of cells (average absolute deviation of 1.9 ± 1.3%; error is one standard deviation) and the sugar usage percentage (average absolute deviation of 1.5 ± 0.7%) of each subpopulation (Fig 3B). These results show that our analysis can separate between single and co-utilization.
Limitations on Subpopulation Characterization
We have shown that we can predict the presence, size and sugar utilization of subpopulations when they are each exclusively using different sugars, but we wanted to determine whether we could distinguish two subpopulations of cells that are both co-utilizing, but at different ratios, while still accurately predicting the subpopulation size and sugar utilization. To test this, we first prepared“mix then grow”cultures in triplicate in varying ratios of12C- and13C-glucose and fit the resultant amino acid distributions with one- and two-state models. We observed that the predicted sugar usage in the one-state model correlates closely with the known experimental ratio (average absolute deviation = 1.7 ± 0.94%, error is one standard deviation) (Fig 3C).
mix”experiment and compared them to the equivalent experimental result. The raw data from the experimental pooling was statistically indistinguishable from the computational pools (S1A Fig). Fitting of these computationally pooled distributions (S1B and S1C Fig) produced results similar to the experimental data (Fig 3B), with an average absolute deviation of 0.87 ± 0.61% for population size and 1.6 ± 1.0% for sugar utilization.
Given the consistency of the results, we expanded our computational pooling approach to test the ability to accurately infer varying the sugar utilization of each subpopulation. To do this we pooled the one-state experimental data (Fig 3B) in a 50–50% ratio. We found that under these conditions, the two-state model can predict the size (average absolute devia-tion = 7.0 ± 11%) and sugar utilizadevia-tion (average absolute deviadevia-tion = 4.2 ± 8.2%) of subpopula-tions with at least a 25% difference in sugar utilization (Fig 4B). The larger the difference in Fig 3. Fitting of amino acid composition with one and two-state models can predict population behavior.(A) Prediction of the number of states in the population for the“grow then mix”(top) and“mix then grow”(bottom) data, based on the fit of the one and two-state models. The gray dashed line indicates the threshold where the log10of the ratio offone-statetoftwo-stateis 0.2; a population is predicted to be one-state below this threshold (green) and two-state
above this threshold (orange). Color of the points indicates whether the population is actually one- or two-states (green and orange, respectively). (B) Inferred subpopulation size (left) and sugar usage (right) based on fitting of the“grow then mix”data. Bars represent the mean of three replicates, with error bars corresponding to the standard error of the mean. (C) Sugar utilization in the“mix then grow”(co-utilization) experiment determined by fitting the data with a one-state model, compared to its actual sugar usage. Error bars represent the standard error of the mean (n= 3).
sugar utilization, the higher the accuracy of the predictions; for example, subpopulations with at least a 40% difference had average absolute deviation of 2.9 ± 4.4% and 2.1 ± 2.4% in size and overall sugar usage (including both subpopulations), respectively (Fig 4C).
In order to more completely determine the limitations in separating between one and two populations we tested our ability to infer relative subpopulation size and the sugar utilization Fig 4. The difference in sugar utilization between two subpopulations is the major determinant of inference error.(A) Computational pooling was performed by summing two sets of experimental GC-MS amino acid distributions (GC-MSA/B) with different12C usage fractions (12
CA/B), weighted by the
desired population ratio (PAand 1-PA). The minimum population size (min(PA,(1-PA))) and difference in12C usage between subpopulations (abs( 12C
A -12C
B))
were determined for each computational pool. (B) Inferred subpopulation number based on the log10f-ratio of the computationally pooled data, with dashed
line indicating the 0.2 threshold. Boxes represent the interquartile range with a red line at the median, and outliers>1.5x the interquartile range are shown as a red plus sign. (C) Inference error in subpopulation size (blue) and sugar usage (red) from computationally pooled data that fit best with a two-state model. Boxes represent the interquartile range with a line at the median, and outliers (>1.5x the interquartile range) are shown as a plus sign.
ratios when both are varied. In order to characterize the limitations of these two characteristics within the entire space, we calculated the average absolute deviation of the inferred subpopula-tion size and sugar utilizasubpopula-tion while varying the thresholds (S2A Fig). When the difference in sugar utilization was at least 25%, the average absolute deviation was 5.5 ± 7.8% for inferred subpopulation size and 7.8 ± 16% for inferred sugar usage; when the difference in sugar utiliza-tion was at least 40%, those statistics dropped to 3.2 ± 5.6% and 4.1 ± 9.0%, respectively. Hence, the primary limitation in separating between one- and two-state models, as well as accurately inferring subpopulation size and sugar utilization is the difference in sugar utiliza-tion between the two subpopulautiliza-tions, with the subpopulautiliza-tion size playing a minor role (S2A Fig). The limitations calculated in this section are sensitive to the threshold chosen; one can increase the accuracy of the inferred fits by raising thef-ratio threshold, thereby increasing the stringency of calling something a two-state population (S2B Fig). This approach will produce more false negatives (one-state predictions when a two-state model is correct), but provide more confidence in the inference in populations identified as two-state. Depending on the application and the intended follow-up, a more or less stringent threshold may be beneficial.
Inferring Subpopulation Characteristics after a Sugar Shift
The experiments described up to this point were conducted at steady state. However, depend-ing on the biological and technical details of an experiment, it is not always possible to grow cells to steady state. Our approach has two potential complication when monitoring a popula-tion in a dynamic environment. First, when switching carbon sources, how long does it take the population to reach steady state? If there is a significant time before the composition of new synthesized macromolecules reflect current usage (e.g. because of internal stores) this will contribute to our inference. Second, if a population of cells is switching back and forth between carbon utilization strategies, macromolecule composition could appear similar to co-utiliza-tion. Both of the scenarios share the same limitation, namely, the time scale it takes for the internal composition to reflect current usage of metabolites. One can measure this by shifting cells from12C to13C glucose. If there are no internal stores or recycling, amino acids will be composed of only pure12C and13C amino acids, with no intermediate mass species. For exam-ple, in a shift from a12C to a13C carbon source, there will be a population of light12C amino acids that were synthesized before the shift (Pold) and heavy13C amino acids synthesized after-wards (Pnew), but no mixed12C/13C amino acids. Conversely if there is a significant contribu-tion of internal stores and recycling, mixed12C/13C amino acids will be generated for a
considerable time after the shift. Our model cannot distinguish between intermediate mass spe-cies from internal stores and those from co-utilization, so this could make transition period measurements inaccurate (Fig 5A).
To determine the magnitude of the internal stores, we switched cells from12C-glucose to 13C-glucose, and monitored the amino acid composition for the subsequent 9 doublings. To
acids decays exponentially as would be expected from dilution by growth rate with no new syn-thesis (Fig 5C). In total, we found that cells convert to using pure13C in less than 1 doubling.
We fit this data with our one and two-state models. Because this is a kinetic, rather than a steady state, experiment, the variability in the amino acids identified here arises from a tem-poral change (before and after the sugar shift), rather than differences between cells. Our Fig 5. Switching between carbohydrate sources causes minimal production of intermediate mass amino acids.(A) When cells are subjected to a shift in carbon sources, production of intermediate mass amino acids (indicated by green bar) depends on the time scale of depletion of free intracellular sugar. (B) The relative mass distribution of three amino acid fragments over 9 doublings after a carbon source switch. Pure12C species are shown in blue, pure13C species in yellow and mixed, intermediate mass species in green. Bars represent the mean of two biological replicates. (C) The mean percent of pure12C amino acid fragments, corresponding to the blue species in (B). Red error bars represent the standard error of the mean over all 29 amino acid fragments. The mean for each fragment was calculated from two biological replicates. The gray line represents decay of the pure12C species by growth rate mediated dilution. Points represent the mean of glutamate fragments 1 and 2 (yellow and green, respectively). (D) Time course data was fit with both one and two state models, and the inferred subpopulation size (left) and sugar utilization (right) were determined. Subpopulation size of Poldis shown by blue x’s, with error bars corresponding to the range (n= 2), and dilution by growth rate shown by the black line. Sugar utilization of Poldand Pnewover all time points is
shown in blue and red, respectively, with the box representing the interquartile range and a line indicating the median value. (E) The relative mass distribution of three amino acid fragments over 9 doublings after a carbon source switch after correction for dilution, plotted as described in (B). (F) Fitting of the corrected data with one- and two-state models allowed inference of the number of subpopulations (left) and sugar utilization (right). Boxes represent the interquartile range with a line at the median, and outliers>1.5x the interquartile range are shown as a plus sign.
beginning time point is at steady-state (~100%12C-amino acids) and at the end of our assay we have reached a new steady-state (~100%13C-amino acids). When the cells have doubled once, half the amino acids should be12C and half13C. As expected, after a small number of dou-blings, we find that the two-state model fits best. The model infers both the old,12C population of amino acids (Pold) and the new,13C population (Pnew) for 4.5 doublings, at which point Pold represents only 2−4.5, or ~5% of the overall pool of amino acids. After growth rate mediated dilution causes Poldto drop below 5%, it is no longer detectable by our method and a single population model best fits our data. All the fits accurately infer both the relative population sizes (average absolute deviation = 1.2 ± 1.4%) and the12C/13C composition of the amino acids in both populations (average absolute deviation = 1.9 ± 1.2%) (Fig 5D). This supports the pre-diction that the recycling rate of the internal amino acid stores is not the same order of magni-tude as import.
Given that Polddecays predictably according to growth rate, it should be possible to cor-rect for this population and fit Pnewto a single or two state model, even at the initial time points. While this is a rough correction, if it works well, the best fitting model should be one in which all new amino acids are made from13C. To test this, we corrected each time point by subtracting out the amino acid distributions from the previous time point, weighted by the amount of dilution (2-doublings), and dividing by the total to renormalize to 1. After correc-tion, the amino acid fragments are composed almost entirely of13C, even at 0.9 doublings (Fig 5E). Fitting the corrected data predicts a single population (Pcorrected) using>95%13C at all time points (Fig 5F), reflecting only the sugar usage after the switch (Pnew). This demon-strates that this method can correctly infer the behavior of a population, even shortly after a sugar shift.
It is possible that switching between nutrients could elicit higher rates of metabolite recy-cling. To test this we switched the carbon source (13C-glucose to12C-galactose and12 C-raffi-nose to13C-glucose). Like the switch from12C-glucose to13C-glucose, the pre-switch carbon source decays by growth rate dilution and the population achieves rapid steady state with the presence of minimal mass intermediates (S3 Fig); using the same metric as above, we observed an overall mean of 3.6% intermediate mass species across all of the carbon shifts. Therefore, amino acid and metabolite recycling does not substantially contribute to the metabolite pool for new amino acid synthesis (Fig 5C,S3 Fig). In contrast, we observe that glutamate fragments decay at a rate greater than predicted by doubling alone (Fig 5C). This difference is expected as glutamate is converted into proline and therefore has an effective decay rate that is larger than dilution alone. Overall, these experiments show that there are minimal limitations on this anal-ysis after nutrient switching.
A Wild Yeast Strain Co-Utilizes Glucose and Galactose
In a model system for studying co-utilization, populations of the budding yeast,Saccharomyces cerevisiae, simultaneously deplete glucose and galactose from media [22]. While this could be due to co-utilization, another study suggested that this depletion could be attributed to noise in the assay or variability in single cell behavior, proposing instead that the sugars were used sequentially [23]. In order to separate between these two possibilities, we grew a culture of the wild yeast strain BC187 at a steady state concentration of glucose and galactose known to cause roughly equal depletion of both sugars from the medium (Fig 6A). Briefly, we shifted a culture from pre-growth in12C-raffinose to medium containing 0.022% glucose and 2% galactose and measured the amino acid composition over four doublings.
acids from growth in raffinose and new amino acids of an unknown isotopic mixture from growth after the shift. To correct for this old population, we calculated the expected dilution due to growth rate as above and subtracted this fraction from the isotopic distribution for each amino acid fragment. This correction was done between each consecutive pair of time points because the cells induce genes that can affect the relative uptake rate of glucose and galactose. We then fit the remaining population of amino acids, allowing us to detect whether the new population of amino acids is generated by co-utilization or single utilization. If different cells were using each sugar, or if the sugars were used sequentially, we would expect a two-state model to fit the data. However, we found that a one-state model fit the data best at all time points, supporting co-utilization of glucose and galactose (Fig 6B). At 1 doubling, the culture is using 40%12C-galactose and 60%13C-glucose ± 3% (Fig 6C). The utilization shifts gradually over time, reaching 84% galactose and 16% glucose ± 6% by 4 doublings. Given the low density of cells in the experiment, this is probably due to induction of galactose transporters [24]. These results support our previous assertion that yeast strains are able to co-utilize glucose and galactose in a mixed sugar environment [22].
Fig 6. The wild yeast strain, BC187, can co-utilize glucose and galactose.(A) In order to distinguish co-utilization and single utilization of glucose and galactose, cultures were grown at steady state in a sugar concentration regime that leads to depletion of both glucose and galactose from the media at roughly equal rates (2%12C galactose and 0.022%13C glucose). (B) Inferred subpopulation number after correction for dilution from cell growth (n= 3). Subpopulation inference is based on the log10f-ratio of the data, shown by boxes representing the interquartile range with a line at the median. The dashed gray line indicates the 0.2 threshold; below this (green), populations are predicted to be one-state, indicating co-utilization, and above (orange) two-states are predicted. (C) Inferred sugar utilization of the population, after correction for dilution from cell growth. Mean12C-raffinose (pink with black diagonal lines),12 C-galactose (pink), and13C-glucose (yellow) utilization are represented by bars (n= 3), with error bars corresponding to the standard error of the mean. Data reflects the glucose and galactose utilization specifically during the current doubling, after correction for previous species.
Discussion
Here we present a novel analysis method for mass spectrometry data that allows the detection of metabolic variation within a population. This method builds off of standard metabolomics methodologies but uses a constraint-based model that allows for the existence of two subpopu-lations of cells. We show in a number of proof of principle experiments that this methodology is able to distinguish between a population co-utilizing two carbon sources and two subpopula-tions with different carbon utilization characteristics, over a wide range of sugar utilization strategies and relative population sizes. Specifically, as implemented here, our approach can infer the relative size and sugar utilization of each subpopulation, with an average absolute deviation of less than 8%, as long as the difference in utilization of the heavy and light sugar is at least 25% between the two subpopulations.
Additionally, our proof of principle experiments support or extend several observations. Previous work has shown that free intracellular metabolites are rapidly turned over. Other studies had reported a second, less labile pool of amino acids stored in the yeast vacuole [25]. By measuring the amount of intermediate mass isotopic species after a nutrient shift, we show that the vast majority of new amino acids are made from newly imported sugars rather than internal stores. Furthermore, after a media switch, the decay of most old amino acids was expo-nential, suggesting that amino acid turnover does not contribute substantially to synthesis of new amino acids. The exceptions to this are glutamate and arginine, which both decay more rapidly than expected by dilution alone, which is expected, as these amino acids or their inter-convertible species are used as precursors for proline, isoleucine, methionine, threonine, argi-nine, and lysine synthesis.
We then used this approach to resolve an outstanding biological question—do yeast co-uti-lize glucose and galactose in a mixed sugar environment? Several lines of evidence have sug-gested that it is possible for isogenic populations to have a bistable metabolism [26,27] or bistable expression of sugar utilization systems [28,29]. Additionally, a recent study found that there is isogenic variability in the response time of the galactose utilization genes, leading to the argument that co-utilization in individual cells was minimal [23]. Instead, we found here that yeast do co-utilize glucose and galactose. In our growth conditions, there was no evidence of a subpopulation of cells with a distinct sugar utilization strategy.
In this work we used a simplified model of carbon metabolism, which was sufficient to achieve our initial biological goal of detecting heterogeneity in sugar utilization strategies. In the future, this work could be extended in a number of ways that would broaden its applicabil-ity. A more extensive model could be used to allow measurement of metabolic variabilapplicabil-ity. This analysis would be aided by choosing isotopic media components that are optimized for differ-entiating between choices in metabolic flux [18]. Our current model only incorporates isotopic data from amino acids, but this could be extended to any other metabolite that can be synthe-sized from multiple metabolic precursors. These extensions of the system will be critical for applications in human cells, where many amino acids are essential. Our current model also ignores the potential for cross-feeding between cells but this could be included in scenarios where it is relevant [30,31]; in our experiments we believe cross-feeding to be negligible given the similarity in profiles of all amino acids and the greatly reduced rates of growth in yeast strains forced to cross-feed [32]. Finally, our model assumed up to two discrete underlying metabolic states. The analysis could be extended to determine the most likely distribution of metabolic states that account for a given set of isotopic measurements.
use this technique to measure normal or cancerous human tissue. While useful in its own right, we believe one of the great benefits of this method is that these analysis concepts can be easily translated to other systems. For example, proteins are made from multiple amino acids, so a method similar to the one described here should allow one to determine whether cells with different metabolic profiles have different proteomic profiles. We believe the basic strategy pro-vided will be creatively used by others in the community to infer information that was previ-ously unmeasurable.
Methods
Strains, Media, and Culture Conditions
PrototrophicSaccharomyces cerevisiaestrains were grown at 30°C in synthetic media (1.45 g yeast nitrogen base without amino acids or ammonium sulfate and 5 g ammonium sulfate per liter) supplemented with either12C-glucose,12C-galactose,12C-raffinose or13C6-glucose (99% purity from Cambridge Isotope; CLM-1396-PK). All strains were S288c, except for the wild BC187 strain. Cells were harvested by spinning for 3 minutes at 3000xg, and cell pellets were stored at -80°C until processing for mass spectrometry.
Grow then Mix and Mix then Grow Experiments
Cells were grown in triplicate to saturation in synthetic media supplemented with12C-glucose. Cells were then diluted 1:50 into the fresh media and grown for 4 hours to reach mid-log. Each replicate was diluted 1:10 using synthetic media with no carbon source, washed three times with synthetic media with no carbon source and grown for 16 hours at 30°C in 1mL of syn-thetic media. For the mix then grow experiment, this media contained the following ratios of 12C-glucose to13C-glucose: 1:0 1:9, 1:3, 1:1, 3:1, 9:1, or 0:1. For the grow then mix experiment,
this media was supplemented with either12C-glucose or13C-glucose, and these cultures were pooled after growth at ratios of 1:0 1:9, 1:3, 1:1, 3:1, 9:1, and 0:1.
Switch and Dynamics Experiments
Cells were grown to saturation in synthetic media supplemented with12C-glucose. Cells were then diluted 1:50 into the same media, grown for 4 hours to reach mid-log, washed three times with synthetic media with no carbon source and resuspended in synthetic media with13 C-glu-cose to an OD600 of 0.195. This sample was serially diluted two-fold in synthetic media with 13C-glucose, resulting in 10 samples with different initial densities. The OD
600of each sample was measured before harvesting and was used to calculate the number of doublings. For the sugar shift experiments, cells were grown to saturation in media containing the initial carbon source, diluted back 1:10,000 and grown to saturation again in the initial media. Cells were then diluted 1:50 into the initial media, grown for 4 hours to reach mid-log, washed 3 times in media lacking a carbon source and resuspended in the media containing the second carbon source. For the glucose/galactose co-utilization experiment, a BC187 strain was pre-grown in YPD, diluted back into synthetic media + 2%12C-raffinose and grown to early mid-log, washed three times in synthetic media without sugar and resuspended in synthetic media with 2%12 C-galactose and 0.022%13C-glucose.
GC-MS Analysis
for 24 hours to dry the hydrolysate. The hydrolysate was derivatized with N-tert-Butyldi-methylsilyl-N-methyltrifluoroacetamide with 1% tert-Butyldimethylchlorosilane (Sigma 375934) in dimethylformamide (Sigma 227056) at 85°C for 1 hour and transferred to a GC-MS vial. A GC-MS standard with equimolar amounts of all amino acids was prepared and deriva-tized as well. Samples were analyzed on a Waters Quattro micro GC/MS/MS with an Agilent 6890 GC and CTC CombiPAL autosampler as previously described [33].
Processing of GC-MS Data
The resulting data was extracted and processed used FiatFlux [33], with one modification. Fiat-Flux calculates the distribution of12C and13C isotope by deconvolution; instead, we calculated the expected observed isotopic distribution for each specific isotopic species (this is a distribu-tion due to the fact that neither the12C or13C carbohydrates are completely pure) and deter-mined the weighting of each specific isotopic species that best fit the data. Raw amino acid fragment mass distributions derived from FiatFlux are documented inS2 Table. The modified code is available on the Dryad Digital Repository (doi:10.5061/dryad.gf80t).
Fitting the GC-MS Data
A simplified model of amino acid biosynthesis was developed as schematized inFig 1A, accounting for glycolysis, anaplerosis, the TCA cycle, and parts of the pentose phosphate path-way (S1 Text). Normalized amino acid distributions were fit to the one-state (5 free parame-ters) and two-state (11 free parameparame-ters) models in MATLAB using the fmincon function. For fitting,S1 Tableidentifies the 29 amino acid fragments used for fitting, as well as the subset of 8 fragments used to analyze the mass intermediates after a carbon source shift inFig 4andS3 Fig. Fit was evaluated by square root of the sum squared of the residuals between the measure-ment and theory, omitting single outliers at both ends of the distribution. The best model was selected using a threshold of log10(fone-state/ftwo-state) of 0.2, above which the population was considered to be two-state. Fitting data from experimental and computational data, including all biochemical parameters are listed inS3andS4Tables. The code is available on the Dryad Digital Repository (doi:10.5061/dryad.gf80t).
Supporting Information
S1 Fig. Analysis of computationally pooled data produces equivalent results to analysis of experimental data.(A) Amino acid distributions are equivalent in the experimental and com-putationally pooled data. The relative percent of each mass species in the 29 amino acid frag-ments used for this analysis in the experimental and computationally pooled data (3696 total, across 3 biological replicates) is plotted as a blue x. The gray line represents x = y, and Pearson’s correlation was used to calculater. (B) Prediction of the number of states in the population based on the fit of the one and two-state models. The gray dashed line indicates the threshold where the log10of the ratio offone-statetoftwo-stateis 0.2; a population is predicted to be one-state below this threshold (green) and two-state above this threshold (orange). The color of the cir-cles indicates whether the population is actually one- or two-states (green and orange, respec-tively). (C) Inferred subpopulation size (left) and sugar usage (right) based on fitting of the pooled data. Bars represent the mean of three replicates, with error bars corresponding to the standard error of the mean.
(EPS)
accuracy of inferred fit. Using computationally pooled data, the relative subpopulation sugar utilization (x-axis) and size (y-axis) were varied and the error in the inferred number of states (top), subpopulation size (middle) and sugar utilization (bottom) were calculated. In all heat maps, blue represents the highest accuracy and red the lowest. For subpopulation size and sugar utilization, only fits predicted to be state were used; black indicates a lack of two-state fits for that combination. Error was calculated as the average absolute deviation between the actual and predicted values. (B) Contribution off-ratio threshold to accuracy of inferred fit. Computationally pooled data was analyzed using a range off-ratio thresholds. Increasing the stringency of the threshold decreased the percent of two-state populations identified (top), but also decreased the error in inferred subpopulation size (middle) and sugar usage (bottom). Blue boxes represent the interquartile range with a red line at the median. Outliers (>1.5x the interquartile range) are shown as a blue x.
(EPS)
S3 Fig. Shifting cells between carbon sources does not increase metabolic recycling.(A) Decay of the initial sugar after a carbon shift is plotted by the number of doublings, with the gray line indicating the expected decrease based on growth mediated dilution. Points corre-spond to the mean value of 29 amino acid fragments, with error bars representing the stan-dard error of the mean. Samples shifted from13C to12C sugars are shown at left, and those shifted from12C to13C are shown at right. (B) The relative mass distribution of leucine frag-ment 3, proline fragfrag-ment 3, and tyrosine fragfrag-ment 1 before and after each carbon shift, sepa-rated into pure12C fragments (blue), pure13C fragments (yellow), and mixed species, which include all intermediates (green). The average percentage of intermediate species present in the 29 intermediate amino acid species after each shift is listed at right ± the standard error of the mean.
(EPS)
S1 Table. Amino acid fragments used for analysis.All fragments with signal from GC-MS are listed. The 29 fragments used for the fitting analysis were selected for ease of modeling, reproducibility and lack of interfering species. The subset of 8 fragments selected for analysis of intermediate mass species in the switching experiments were selected for synthesis from multi-ple carbon sources and lack of anamulti-plerotic synthesis (incorporation of CO2from the air). (XLS)
S2 Table. Raw amino acid fragment mass distributions derived from FiatFlux before cor-rection.
(XLS)
S3 Table. Experimental sample descriptions and CDF filenames with fit data.Samples were fit using one and two state models, and f-values, population fractions, sugar utilization charac-teristics and biochemical parameters (seeFig 1for abbreviations) are reported below.
(XLS)
S4 Table. Fitting data from computationally pooled samples.Samples were fit using one and two state models, and f-values, population fractions, sugar utilization characteristics and bio-chemical parameters (seeFig 1for abbreviations) are reported below. In pooled sample name, MG is a mix then grow sample, and GM is a grow then mix sample. The ratios appended to the MG/GM abbreviation are the12C:13C ratio of the experimental samples used, and the following ratio describes the computational pooling ratio between the two samples. All three replicates were fit. For information about the experimental samples, seeS2 Table.
S1 Text. Annotated MATLAB code indicating the biochemical pathways and reactions used in the amino acid model.Full set of code and functions has been uploaded to the Dryad Digital Repository (doi:10.5061/dryad.gf80t).
(PDF)
Acknowledgments
We would like to thank Chris Marx and Sean Carroll for protocols and useful discussions, and Jennifer Wang from the Harvard University Small Molecules Mass Spectrometry Facility for protocol advice and running the GC-MS samples. Roy Kishony, Daniel Segrè, Joshua Goldford, and members of the Springer lab provided discussion and feedback on the project. Ron Milo, Niv Antonovsky, and Bo Hua gave critical feedback on the manuscript.
Author Contributions
Conceived and designed the experiments: MS YS CMD. Performed the experiments: YS CMD. Analyzed the data: CMD MS. Wrote the paper: CMD MS.
References
1. Raj A, van Oudenaarden A. Nature, Nurture, or Chance: Stochastic Gene Expression and Its Conse-quences. Cell. 2008; 135(2): 216–226. doi:10.1016/j.cell.2008.09.050PMID:18957198
2. Bigger JW. Treatment of staphylococcal infections with penicillin. Lancet. 1944; 244(6320): 497–500. doi:10.1016/S0140-6736(00)74210-3
3. Balaban NQ, Merrin J, Chait R, Kowalik L, Leibler S. Bacterial persistence as a phenotypic switch. Sci-ence. 2004; 305: 1622–1625. doi:10.1126/science.1099390PMID:15308767
4. Buettner F, Natarajan KN, Casale FP, Proserpio V, Scialdone A, Theis FJ, et al. Computational analysis of cell-to-cell heterogeneity in single-cell RNA-sequencing data reveals hidden subpopulations of cells. Nat Biotechnol. 2015; 33: 155–60. doi:10.1038/nbt.3102PMID:25599176
5. Macosko EZ, Basu A, Satija R, Nemesh J, Shekhar K, Goldman M, et al. Highly Parallel Genome-wide Expression Profiling of Individual Cells Using Nanoliter Droplets. Cell. 2015; 161: 1202–1214. doi:10. 1016/j.cell.2015.05.002PMID:26000488
6. Klein AM, Mazutis L, Akartuna I, Tallapragada N, Veres A, Li V, et al. Droplet Barcoding for Single-Cell Transcriptomics Applied to Embryonic Stem Cells. Cell. 2015; 161: 1187–1201. doi:10.1016/j.cell. 2015.04.044PMID:26000487
7. Justus CR, Sanderlin EJ, Yang L V. Molecular connections between cancer cell metabolism and the tumor microenvironment. International Journal of Molecular Sciences. 2015; 16(5): 11055–11086. doi:
10.3390/ijms160511055PMID:25988385
8. Ahlqvist KJ, Suomalainen A, Hämäläinen RH. Stem cells, mitochondria and aging. Biochimica et Bio-physica Acta—Bioenergetics. 2015; 1847(11): 1380–1386. doi:10.1016/j.bbabio.2015.05.014 9. van Dijk G, van Heijningen S, Reijne AC, Nyakas C, van der Zee EA, Eisel ULM. Integrative
neurobiol-ogy of metabolic diseases, neuroinflammation, and neurodegeneration. Front Neurosci. 2015; 9: 173. doi:10.3389/fnins.2015.00173PMID:26041981
10. Heinemann M, Zenobi R. Single cell metabolomics. Current Opinion in Biotechnology. 2011; 22(1): 26–31. doi:10.1016/j.copbio.2010.09.008PMID:20934866
11. Vasdekis AE, Stephanopoulos G. Review of methods to probe single cell metabolism and bioenerget-ics. Metabolic Engineering. 2015; 27: 115–135. doi:10.1016/j.ymben.2014.09.007PMID:25448400 12. Ghosh A, Nilmeier J, Weaver D, Adams PD, Keasling JD, Mukhopadhyay A, et al. A peptide-based
method for 13C Metabolic Flux Analysis in microbial communities. PLoS Comput Biol. 2014; 10: e1003827. doi:10.1371/journal.pcbi.1003827PMID:25188426
13. Gebreselassie NA, Antoniewicz MR. (13)C-metabolic flux analysis of co-cultures: A novel approach. Metab Eng. 2015; 31: 132–9. doi:10.1016/j.ymben.2015.07.005PMID:26219674
15. Szyperski T. Biosynthetically directed fractional 13C-labeling of proteinogenic amino acids. An efficient analytical tool to investigate intermediary metabolism. Eur J Biochem. 1995; 232: 433–448. PMID:
7556192
16. Nargund S, Misra A, Zhang X, Coleman GD, Sriram G. Flux and reflux: metabolite reflux in plant sus-pension cells and its implications for isotope-assisted metabolic flux analysis. Mol Biosyst. 2014; 10: 1496–508. doi:10.1039/c3mb70348gPMID:24675729
17. Zamboni N, Fendt S-M, Rühl M, Sauer U. 13C-based metabolic flux analysis. Nat Protoc. 2009; 4: 878–892. doi:10.1038/nprot.2009.58PMID:19478804
18. Wiechert W, Möllney M, Petersen S, de Graaf AA. A Universal Framework for 13C Metabolic Flux Anal-ysis. Metab Eng. 2001; 3: 265–283. doi:10.1006/mben.2001.0188PMID:11461148
19. Akaike H. A new look at the statistical model identification. IEEE Trans Autom Control. 1974; 19: 716–
723. doi:10.1109/TAC.1974.1100705
20. Schwarz G. Estimating the dimension of a model. Ann Stat. 1978; 6: 461–464. doi:10.1214/aos/ 1176344136
21. Canelas AB, Van Gulik WM, Heijnen JJ. Determination of the cytosolic free NAD/NADH ratio in Saccha-romyces cerevisiae under steady-state and highly dynamic conditions. Biotechnol Bioeng. 2008; 100: 734–743. doi:10.1002/bit.21813PMID:18383140
22. Wang J, Atolia E, Hua B, Savir Y, Escalante-Chong R, Springer M. Natural Variation in Preparation for Nutrient Depletion Reveals a Cost-Benefit Tradeoff. PLoS Biol. 2015; 13(1): e1002041. doi:10.1371/ journal.pbio.1002041PMID:25626068
23. Venturelli OS, Zuleta I, Murray RM, El-Samad H. Population Diversification in a Yeast Metabolic Pro-gram Promotes Anticipation of Environmental Shifts. PLoS Biol. 2015; 13(1): e1002042. doi:10.1371/ journal.pbio.1002042PMID:25626086
24. Escalante-Chong R, Savir Y, Carroll SM, Ingraham JB, Wang J, Marx CJ, et al. Galactose metabolic genes in yeast respond to a ratio of galactose and glucose. Proc Natl Acad Sci U S A. 2015; 112: 1636–41. doi:10.1073/pnas.1418058112PMID:25605920
25. Nurse P, Wiemken A. Amino acid pools and metabolism during the cell division cycle of arginine-grown Candida utilis. J Bacteriol. 1974; 117: 1108–1116. Available:http://www.ncbi.nlm.nih.gov/pubmed/ 4591945. PMID:4591945
26. Kotte O, Volkmer B, Radzikowski JL, Heinemann M. Phenotypic bistability in Escherichia coli’s central carbon metabolism. Mol Syst Biol. 2014; 10: 736. doi:10.15252/msb.20135022PMID:24987115 27. van Heerden JH, Wortel MT, Bruggeman FJ, Heijnen JJ, Bollen YJM, Planqué R, et al. Lost in
Transi-tion: Startup of Glycolysis Yields Subpopulations of Nongrowing Cells. Science. 2014; 343(6174): 1245114. 2014;343: 1245114–1245114. doi:10.1126/science.1245114PMID:24436182
28. Ozbudak EM, Thattai M, Lim HN, Shraiman BI, Van Oudenaarden A. Multistability in the lactose utiliza-tion network of Escherichia coli. Nature. 2004; 427: 737–740. doi:10.1038/nature02298PMID:
14973486
29. Acar M, Becskei A, van Oudenaarden A. Enhancement of cellular memory by reducing stochastic tran-sitions. Nature. 2005; 435: 228–232. PMID:15889097
30. Seth EC, Taga ME. Nutrient cross-feeding in the microbial world. Frontiers in Microbiology. 2014; 5:350. doi:10.3389/fmicb.2014.00350PMID:25071756
31. Mee MT, Collins JJ, Church GM, Wang HH. Syntrophic exchange in synthetic microbial communities. Proc Natl Acad Sci U S A. 2014; 111: E2149–56. doi:10.1073/pnas.1405641111PMID:24778240 32. Shou W, Ram S, Vilar JMG. Synthetic cooperation in engineered yeast populations. Proc Natl Acad Sci
U S A. 2007; 104: 1877–82. doi:10.1073/pnas.0610575104PMID:17267602