FUZZY BASED FAULT DETECTION AND
DIAGNOSIS IN PNEUMATIC ACTUATOR
IN CEMENT INDUSTRY
P. SUBBARAJ
Principal,Theni Kamavar Sangam College of Engineering and Technology, Theni, Tamil Nadu, India.
B. KANNAPIRAN*
*Department of Instrumentation & Control Engineering, Arulmigu Kalasalingam college of Engineering, Anand Nagar, Krishnankoil-626190 Srivilliputhur, Virudunagar District, Tamilnadu, India Abstract :
Fault detection and diagnosis is an important task with increasing attention in the academic and industrial fields, due to economical and safety related matters. The early detection of fault can help avoid system shutdown, breakdown and even catastrophe involving human fatalities and material damage. In fault detection, the discrepancies between system outputs and model outputs are called residuals, and are used to detect and diagnose faults. Computational intelligence techniques are being investigated as an extension to the traditional fault detection and diagnosis methods. This paper proposes a fuzzy based architecture for fault detection and diagnosis based on fuzzy classification approach. The real time data for pneumatic actuator has obtained from the cement industry under normal and abnormal operating conditions. In this paper the proposed fuzzy architecture is able to detect the thirteen numbers of possible faults in pneumatic actuator for cooler water spray system in cement industry, effectively when compared with Hazard and Operability (HAZOP) study.
Keywords: Fault detection, Fuzzy Classification approach, HAZOP, Pneumatic Actuator.
1. Introduction
The development of model-based fault diagnosis began in the early 1970s. This method of fault detection in dynamic systems has been receiving more and more attention over the last two decades. Generally ‘fault’ is to be understood as an unexpected change of the system functionality. It may not, however, represent the failure of physical components. Such malfunctions may occur either in the sensors or actuators, or in the components of the process itself. However, the same difference signal can correspond to model-plant mismatches or noise in real measurements, which are erroneously detected as a fault. The availability of a good model of the monitored system can significantly improve the performance of diagnostic tools, minimizing the probability of false alarms. In all but the most trivial cases the existence of a fault may lead to situations related to safety, health, environmental, financial or legal implications.
Condition monitoring and fault diagnosis are important aspects for the safe and reliable operation for the process as well as the operators. The process operation and process operators in the cement industry, given enough time, might be able to analyze the large volume of data collected from many critical systems for features indicative of faults or other safety related features. They use the conventional methods like manually processing the data with the help of the vast amount of information available in the form of various documents about the various malfunctions that can occur. This is not suitable when the plant is under operation or under emergency. Also, it is impractical to expect the operator to perform this sort of monitoring and detection continuously. Under this condition, it may be of great use if an automated system is developed for real time monitoring of the plant.
plants. The important aspect of this approach is the development of a model that describes the ‘cause and effect’ relationships between the system variables using state estimation or parameter estimation techniques. The problem with these mathematical model based techniques is that under real conditions, no accurate models of the system of interest can be obtained. In that case, the better strategy is of using knowledge based techniques where the knowledge is derived in terms of facts and rules from the description of system structure and behavior. Classical expert systems [4] were used for this purpose. The major disadvantage of inference method is that it has always been that binary logical decisions with Boolean operators do not reflect the gradual nature of many real world problems. Recently Artificial Neural networks [5] and Fuzzy logic [6] were proposed for fault detection problems. The advantage of neural network approach is their generalization capability which lets them deal with partial or noisy inputs. The neural networks are able to handle continuous input data and the learning must be supervised, in order to solve the fault detection and diagnosis problem. The multilayer perceptron network is the most common network today. Due to their powerful nonlinear function approximation and adaptive learning capabilities, neural networks have drawn great attention in the field of fault diagnosis. But the neural network approach needs lot of data to develop the network before being put to use for real time applications. The driving force behind a fuzzy logic system is the idea that some uncertainty exists in categorizing the values of the system variables. This uncertainty present in the decision making process can be incorporated into the diagnosis system via fuzzy set theory. A nonlinear fuzzy model [7] with transparent inner structure is used for the generation of six different symptoms in electro- pneumatic valve. The resulting symptom patterns are classified with a new self-learning classification structure based on fuzzy rules. The strategy developed [8] can lead to the effective and proactive monitoring of degradation and diagnosis of fault. But the reason behind the major degradation of the valve can be distinguished from other reasons such as a badly tuned controller and external disturbances. The types and severity of degradation is identified and estimated. Proactive maintenance is effectively implemented.
This paper focuses the fault detection and diagnosis of a pneumatic actuator in critical system like cooler water spray system in cement industry. The fault detection and diagnosis is proposed on pneumatic actuator to avoid hazardous operating condition in cooler water spray system. When actuator fails it will affect the spray process system in the hot gas duct and it will also damage the ESP.
This paper is organized as follows: Section 2 deals with conventional method as HAZOP analysis, Section 3 deals with system description in cement industry, section 4 explains physical structure of pneumatic valve, section 5 describes Fuzzy logic based fault detection and diagnosis, section 6 discusses results obtained from real time data, then it is compared with HAZOP technique and section 7 concludes.
2. HAZOP Analysis
HAZOP analysis was developed in the late 1960s at ICI in the UK. The basic principle of HAZOP analysis [9] is that hazards arise in a plant due to deviations from normal behavior. A group of experts systematically identify every conceivable deviation from design intent in a plant; find all the possible abnormal causes, and the adverse hazardous consequences of that deviation. The experts in the study team are chosen to provide the knowledge and experience in different disciplines for all aspects of the study to be covered comprehensively.
The procedure involves examining the process flow diagram systematically, line by line or section by section (depending on the level of detail required), by generating deviations of the process variables from their normal state. The possible causes and consequences of each deviation so generated are then considered, and potential problems are identified. In order to cover all possible malfunctions in the plant, the process deviations to be considered are generated systematically by applying a set of guide words, namely, NONE, MORE OF, LESS OF, PART OF, REVERSE, AS WELL AS and OTHER THAN, which correspond to qualitative deviations of process variables.
2.1 Preparation for carrying out HAZOP
comprehensive. In particular for this plant, line diagrams must be checked to ensure they are up to date and that modifications have not been made since the plant was constructed.
2.2 Composition of the Team to Carryout a HAZOP
HAZOP are normally carried out by a multi-disciplinary team, including chemical engineers and chemists, with members being chosen for their individual knowledge and experience in design, operation, maintenance or health and safety. The technique allows experts in the process to bring their knowledge and expertise to bear systematically so that problems are less likely to be missed. It is useful to record each step of a HAZOP for all the physically meaningful deviations or, if a subset is used, to include these requiring an action plus those which considered significant but required no action because the existing protection was deemed adequate.
3. System Description in Cement Industry
Clinker coolers, like virtually all of the process equipment in a cement plant; have undergone significant transformations over this century. Beginning with passive, open-air clinker cooling, its development progressed through rotary and planetary coolers, to traveling grate and finally reciprocating grate coolers largely in use today. Obviously, the goals of the clinker cooler are to maximize the heat recovery to the kiln process, minimize the ultimate clinker temperature and required cooling air volume, and maintain high service availability.
Red-hot clinker tumbles from the kiln onto a grate and is cooled by cooler fans. The hot air recovered from this cooling process is recycled back into the kiln or preheated system to recover its thermal energy. The next section deals with Water cooling system in cement industry.
3.1 Water Cooling System
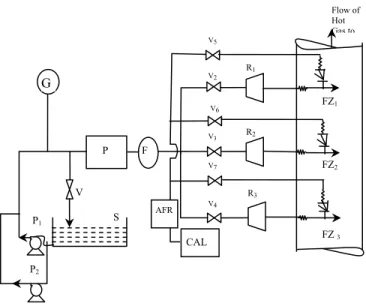
Direct measurement of clinker temperature is not possible on a continuous basis. Hence the measurement of cooler vents gas temperature, which is a function of clinker temperature. When the temperature of the clinker at the outlet of kiln is up to 1100 ºC, then the clinker temperature is reduced up to 750 ºC at the grate cooler section by using external blower fans. It is necessary to reduce the hot gas temperature up to 250 ºC before given to the ESP(Electrostatic Precipitator) section, if it exceeds beyond this 250 ºC, then the ESP gets damaged. In order to prevent this damage, water spray system is used in cement industry. Water is injected through the pneumatic valve and then it is spray using flow nozzle at the cooler outlet.
Flow of Hot Gas to
S V
V2
V3
V4
V5
V6
V7
P
CAL AFR F
R1
R2
R3
FZ1
FZ2
FZ 3
P1
P2 G
Fig 1. Schematic layout of the Cooler water sprays system.
The water from the storage tank is pumped through various safety instruments and then it reaches the flow nozzle through the pneumatic valve. The major problem and risks involved is that the problem in Pneumatic valve, which mainly occurs due to the variation in the flow rate. Further this will affect the spray process in the flow of hot gas duct and there is no cooling process happens in the hot gas flow line. This leads to the rise in temperature of the hot gas and it will damage the electrode plates in ESP because of its high cost. This type of valve is automatic equipment designed to regulate the flow rate in a pipe system
The next section presents the physical structure of the pneumatic valve in cement industry.
Table 1 Parameters of Cooler water sprays system
ST Storage Tank
V1 Return Valve
V2,V3,V4 Delivery Valve for water flow V5,V6,V7 Delivery Valve for air flow AFR Air Filter Regulator
CAL Compressed Air line from Plant P1-P2 Pump
R1-R3 Flow Reducer
PV Pneumatic Valve
FT Flow Transmitter
FZ1-FZ3 Flow Nozzle Banks(1-3) G Pressure gauge
4. Physical Structure of Pneumatic Valve
PSP
Pneumatic Servomotor
T1 TT
P
Ps
CV
Controller
Positioner ZT
FT
X
P
V2
PT
F
V3 Valve
V1
E/P
CVI
From the Water reservoir
To flow nozzle for water spray in the hot gas duct
experience and observations over a period of time. This knowledge has inherent fuzziness because it comes from uncertain and imprecise nature of expressing the abstract thoughts. Fuzzy logic can afford the computers, the capability of manipulating abstract concepts commonly used by the humans in decision-making. A pneumatic servo-actuated industrial control valve, which is used as test bed of the fault detection approach proposed in this paper.
4.1Pneumatic actuator
The internal structure of the Pneumatic valve is shown in figure 2.The flow is set by the position of the rod, which determines the restricted flow area. The actuator sets the position of this rod. There are many types of servo-actuators: electrical motors, hydraulic cylinders, spring-and-diaphragm pneumatic servomotor, etc.
The most common type of actuator is the spring-and-diaphragm pneumatic servomotor due to its low cost. This actuator consists of a rod that has, at one end, the valve plug and, at the other end, the plate. The plate is placed inside an airtight chamber and connects to the walls of this chamber by means of a flexible diaphragm.
The descriptions of the main parameters of the servo-actuated valve are given in Table 2.
Fig 2. Internal Structure of the Pneumatic valve
Table 2.Servo-actuated pneumatic valve parameters
PSP Positioner of supply air pressure
PT Air pressure transmitter
FT Volume flow rate transmitter
TT Temperature transmitter
ZT Rod position transmitter
E/P Electro-pneumatic converter
V1, V2 Cut-off valves
V3 Bypass valve
Ps Pneumatic servomotor chamber pressure CVI Controller output
CV Control reference value
F Volumetric flow
F=100Kvf(x)
where Kv is the flow coefficient (m3/h) (given by the manufacturer), f (x) is the valve opening function, ∆P is the pressure difference across the valve (MPa), ρ is the fluid density (kg/ m3), F is the volumetric flow through the valve (m3/h), and x is the position of the rod (m), which is the same of the plug. The valve opening function f (x) indicates the normalized valve opening area. It varies in the interval [0, 1], where the value 0 indicates that the valve is fully closed and the value 1 indicates that it is fully open. The value of X is defined as the percentage of valve opening.
4.2 Valve body
The valve body is the component that determines the flow through the valve. A change of the restricted area in the valve regulates the flow. There are many types of valve bodies. The differences between them relate to the form by which the restricted flow area changes. This paper addresses the globe valve case. However, the results expressed here can easily be applied to other types of valve bodies. Modeling the flow through the valve body is not an easy task, since most of the underline physical phenomena are not fully understood.
4.3 Positioner
The positioner determines the flow of air into the chamber. The positioner is the control element that performs the position control of the rod. It receives a control reference signal (set point) from a computer controlling the process, to get ride of noise and abrupt changes of the reference signal, prior to the PID control action that leads the rod’s position to that reference signal. The positioner comprises a position sensor and an electrical-pneumatic transducer. The first determines the actual position of the rod, so that the error between the actual and the desired position (reference signal) can be obtained. The E/P transducer receives a signal from the PID controller transforming it in a pneumatic valve opening signal that adds or removes air from the pneumatic chamber. This transducer is also connected to a pneumatic circuit and to the atmosphere. If the controller indicates that the rod should be lowered, the chamber is connected to the pneumatic circuit. If, on the other hand, the rod should be raised, the connection is established with the atmosphere, thus allowing the chamber to be emptied. Next section deals with classification of faults in pneumatic actuator in cement industry.
4.4 Classification of faults in Pneumatic actuator
This section presents the details of various faults in pneumatic actuator in cement industry. 1.Control valve faults
2.Pneumatic servo-motor faults 3.Positioner faults
4.General faults/external faults
The various faults which are considered as the four sets of critical nineteen numbers of faults along with their symbols are given in Table 3.
4.5 Effect of faults
This section deals with the problem arises due to the effect of fault has been occurred. It is necessary to give more importance for the system whenever the fault occurs. Actuator vent blockage fault is due to the changes the system dynamics by increasing the effective damping of the system. When air is supplied to the lower chamber of the actuator, the pressure increases allowing the diaphragm to move upwards against the spring force. As the diaphragm moves upward, air that is trapped in the upper chamber escapes through the vent. When the vent becomes partially blocked due to debris, the pressure in the upper chamber increases creating a pressure surge that opposes the motion of the diaphragm.
Similarly, when air is purged from the lower chamber, and the vent is partially blocked, a partial vacuum is created in the upper chamber. Again, the motion of the diaphragm is hindered and the performance of the system is impaired. In cases when the vent is entirely blocked, the valve cannot be stroked through its full range. Placing an adjustable needle valve in the vent port, the full-open position of the needle valve was designated as 0% blockage and the full-closed position was designated as 100% blockage.
Finally, the condition of the diaphragm should be monitored due to the cyclic nature of the stresses induced upon the diaphragm as it flexes. As a result, fatigue failure of the diaphragm will inevitably occur.
actuator. The leakage flow was controlled by a needle valve with 100% leakage (total diaphragm failure) denoting the adjustment where the valve ceased to respond to any input signal. Valve clogging fault is due to cause appeared to be a property of the sewage. But on the other hand, there are also plants in areas with hard water that are free from clogging.
Leakage fault is due to pressure drop. This leakage fault is caused by the contaminants in the water system will cause increased leakage and equipment malfunctions. These particles can also block orifices thus jamming valve spools. Further water passes may be restricted resulting in reduced water flow and increased pressure drop at the inlet side of pneumatic actuator.
Incorrect supply pressure fault is the fact that the supply pressure directly influences the volume of air that can be delivered to the actuator. This adversely affects the position response of the valve. The incorrect supply pressure fault can occur from a blockage or leak in the supply line, or by increased demand placed on the plant air supply. The next sections deals with Fuzzy logic based fault detection and diagnosis in pneumatic actuator in cement industry.
5. Fuzzy Logic Based Fault Detection and Diagnosis
A system that includes the capability of detecting and diagnosing faults is called the ‘fault diagnosis system’. Such a system has to perform two tasks, namely fault detection and fault isolation. The purpose of the former is to determine that a fault has occurred in the system. The latter has the purpose of locating the fault. In order to accomplish these tasks, information that reflects a change in the normal behavior of the process has to be obtained. This is generally called symptom evaluation or fault classification. Any method of fault diagnosis must characterize how abnormal symptoms (measurements) are related to faults (malfunctions).
Table3. List of various types of faults
Types of fault Name of the fault Symbols Name of the fault Symbols
Control valve faults
valve clogging F1 external leakage (bushing, covers,
terminals)
F5 valve or valve seat erosion F2 internal leakage (valve tightness) F6 valve or valve seat sedimentation F3 medium evaporation or critical flow F7
increased of valve or bushing friction F4 - -
Pneumatic servo-motor faults
twisted servo-motor's piston rod F8 servo-motor's diaphragm perforation F10 servo-motor's housing or terminals tightness F9 servo-motor's spring fault F11 Positioner faults electro-pneumatic transducer fault (E/P) F12 pressure sensor fault (PT) F14
rod displacement sensor fault (DT) F13 General
faults/external faults
Positioner supply pressure drop F15 fully or partly opened bypass valves F18 increase of pressure on valve inlet or
pressure drop on valve output
F16 flow rate sensor fault (FT) F19 pressure drop on valve at inlet or increase of
pressure on valve output
F17 - -
Often formulating a diagnostic system is the lack of such a model of fault-symptom connections, due to the lack of understanding of fault induction and propagation mechanisms in the device. The following are the set of desirable characteristics one would like the diagnostics system to possess: a) Quick detection and diagnosis b) Isolability c) Robustness d) Novelty identifiability e) Classification error estimate f) Adaptability g) Explanation facility h) Modelling requirements i) Storage and computational requirements j) Multiple fault identifiability [10, 11].Next section presents a brief overview of fuzzy logic theory and different steps to design a fuzzy (linguistic) model.
5.1 Review of Fuzzy Logic
imprecise information, make decisions based on the vague and incomplete data, yet by applying a “Defuzzification” process, arrive at definite conclusions.
Two common sources of information for building fuzzy models are the priori knowledge and data. The priori knowledge can be of a rather approximate nature (qualitative knowledge, heuristics), which usually originates from experts. Data are available as records of the process operation or special identification experiments can be conducted to obtain the relevant data.
To design a (linguistic) fuzzy model based on available expert knowledge, the following steps [11, 12] can be followed:
Select the input and output variables, the structure of the rules, and the inference and defuzzification methods. Decide on the number of linguistic terms for each variable and define the corresponding membership functions. Formulate the available knowledge in terms of fuzzy if-then rules.
Validate the model (typically by using data)
If the model does not meet the expected performance, iterate on the above design steps. When using fuzzy logic in a detection environment, the following successive steps are involved, fuzzification of ‘crisp’ values; inference using a rule base in which the logical operations are performed on the membership functions; and defuzzification to obtain ‘crisp’ outputs. The next sections present the fuzzy logic based approach for fault diagnosis in pneumatic actuator in cement industry.
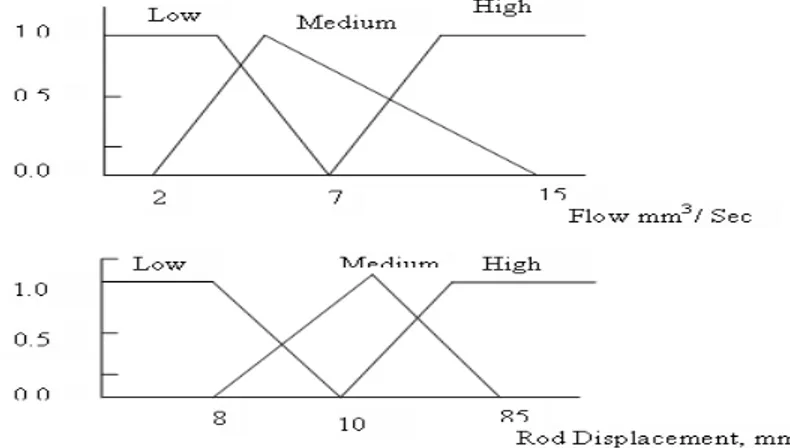
Fig 3. Membership Functions for input variables in Pneumatic valve
5.2 Development of Fuzzy Diagnostic System
Fault diagnosis is a classical area for fuzzy logic applications. Compared to algorithmic approaches, the advantage of fuzzy logic-based approach is that it gives possibilities to follow human’s way of fault diagnosing and to handle different information and knowledge in a more efficient way. This section presents the details of the fuzzy logic based diagnostic system developed for four sets of critical nineteen number of faults in pneumatic actuator like Control valve faults, Pneumatic servo-motor faults, Positioner faults, General faults/external faults.
Table4. Input variables and their operating range
Name of the variable Minimum Value Maximum Value
Flow 2mm3/ Sec 14mm3/ Sec
Rod Displacement 8mm 80mm
From Table 4, it is found that the operating range of the input variables for pump, different types of valves and pneumatic actuators are same. Based up on the changes (increased beyond the maximum value and decreased below the minimum value) in the above variables, different types of fault to be occur. The control action for this pneumatic actuator having the variation in rod displacement with similar variation in the flow rate is tabulated while developing the fuzzy model.
Membership functions were formed for all the input variables based on their values during the normal and abnormal conditions. In all the cases, triangular and trapezoidal functions were used and each variable was categorized into three fuzzy subsets. For illustration the membership functions formed for the variables flow and rod displacement is shown in figure3. The expert knowledge relating the symptoms and the various faults are formulated in the form of fuzzy if-then rules. A set of such rules constitutes the rule base of the Fuzzy Inference System. This form of knowledge representation is appropriate because it is very close to the way experts themselves think about the diagnosis and decision process. The if-then rules formulated for four critical sets of faults given in Table 5 in the form of a matrix. The description of the first rule in Table 5 is given as:
Table 5.Fuzzy rule matrix for various faults
FLOW
ROD
DISPLACEMENT
LOW MEDIUM HIGH
LOW F4,F8 F1, F3, F6, F9 F0
MEDIUM F1, F2, F7, F10 F0 F3, F5, F10
HIGH F0 F5, F9, F11,
F13 F8, F12
Fig 4. Shows pneumatic actuator system interfaced with PC using DAQ
Based up on the changes (increased beyond the maximum value and decreased below the minimum value) in the above variables, different types of fault to be occur. The control action for this pneumatic actuator having the variation in rod displacement with similar variation in the flow rate is tabulated. The variation in flow rate is measured by using the differential pressure transmitter and this difference in pressure readings were measured and the output voltage signal is converted in the form of current signal in the range of 4-20mA. This current signal is obtained by interfacing DAQ (Data Acquisition Card) with the Personal Computer and this is shown in figure 4. Then the upward and the downward movement of the stem were measured and these parameters are used as the input variables.
6. Results and Discussion
This section presents the details of simulation carried out on the developed Fuzzy based fault diagnosis in pneumatic actuator. The fuzzy model was developed using MATLAB version 7.4 on a IBM PC with the clock speed of 2GHz and 512MB RAM. While developing the fuzzy model min was used for T-norm, max was used for T-conorm was used. The developed model was tested with a number of test data collected from the Cement industry. Here the 24hours (86400 numbers of data) data was collected under normal and abnormal operating conditions of the pneumatic actuator and this is recorded in the form of chart. Among these data it was very clearly reported only 13 number of critical faults alone in Table 6, considered four set of faults like Control valve faults, Pneumatic servo-motor faults, Positioner faults and General faults/ external faults in pneumatic actuator in cement industry. The corresponding detail of fault identification is listed in Table 7. For illustration, the results produced by the thirteen faults for a few cases are given in Table 6.
Table 6. Output produced by various faults for the given input values
RANGE FAULTS
FLOW DISP F0 F1 F2 F3 F4 F5 F6 F7 F8 F9 F10 F11 F12 F13
3.2 15.3 0 0 0 0 1 0 0 0 1 0 0 0 0 0
7.9 14.5 0 0.30 0 0.30 0 0 0.30 0 0 0.30 0 0 0 0
14.2 13.8 1 0 0 0 0 0 0 0 0 0 0 0 0 0
2.2 31.5 0 0.46 0.46 0 0 0 0 0.46 0 0 0.46 0 0 0
7.8 33.5 1 0 0 0 0 0 0 0 0 0 0 0 0 0
14.7 32.3 0 0 0 0.518 0 0.518 0 0 0 0 0.518 0 0 0
2.5 75 1 0 0 0 0 0 0 0 0 0 0 0 0 0
7.2 73 0 0 0 0 0 0.06 0 0 0 0.06 0 0.06 0 0.06
14.8 76.3 0 0 0 0 0 0 0 0 1 0 0 0 1 0
developing faults. When the flow ranges and the corresponding rod displacement range were 3.2 mm3/ Sec and 15.3mm, then the critical fault is external leakage (F4), servomotor diaphragm perforation (F8) with its output range is 1. When these faults occurs, then there is no flow through the valve and temperature of the hot gas is increased which further damage the ESP. When the flow range and the corresponding rod displacement range were 7.9 mm3/ Sec and 14.5mm, then the faults are valve clogging (F1), valve seat erosion (F3), bushing friction (F6), spring fault (F9)with its output range 0.30. From the above faults are the possibilities to damage the valve. Under normal operation, the flow range and the corresponding rod displacement range were 14.2 mm3/ Sec and 13.8mm which results no fault (F0) with output range 1.
When the flow range and the corresponding rod displacement range were 2.2 mm3/ Sec and 31.5mm, then the faults are valve clogging (F1), Valve Seat Sedimentation (F2), Medium Evaporation (F7), Positioner Supply Pressure Drop (F10) with its output range 0.46. The above faults occur definitely. When the flow range and the corresponding rod displacement range were 14.7 mm3/ Sec and 32.3mm, then the faults are Valve Seat Erosion (F3), Internal Leakage (F5), and Positioner Supply Pressure Drop (F10) with its output range 0.518.
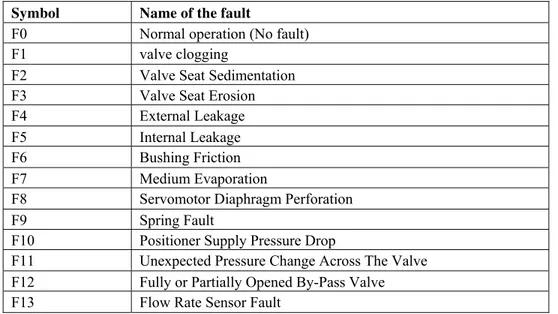
Table 7. Fault Identification Table
Symbol Name of the fault
F0 Normal operation (No fault)
F1 valve clogging
F2 Valve Seat Sedimentation
F3 Valve Seat Erosion
F4 External Leakage
F5 Internal Leakage
F6 Bushing Friction
F7 Medium Evaporation
F8 Servomotor Diaphragm Perforation
F9 Spring Fault
F10 Positioner Supply Pressure Drop
F11 Unexpected Pressure Change Across The Valve F12 Fully or Partially Opened By-Pass Valve F13 Flow Rate Sensor Fault
When the flow range and the corresponding rod displacement range were 7.2 mm3/ Sec and 73mm, then the faults are Internal Leakage (F5), Spring Fault (F9), un-expected pressure change across the valve (F11), Flow Rate Sensor Fault (F13) with its output range 0.06. When the flow range and the corresponding rod displacement range were 14.8 mm3/ Sec and 76.3 mm, then the critical faults are Servomotor Diaphragm Perforation (F8), fully or Partially Opened By-Pass Valve (F12) with its output range 1.
6.1 Comparison of Results
The result produced by the fuzzy model which has displayed in Table6 is compared with the traditional risk analysis technique namely Hazard and Operability Study (HAZOP). HAZOP study identifies the possible ways in which the system could fail. It is a systematic technique for identifying hazards or operability problems associated with the cement industry installations. Each segment of the selected system was analyzed and all deviations from normal operating conditions and the mode of their occurrence examined.
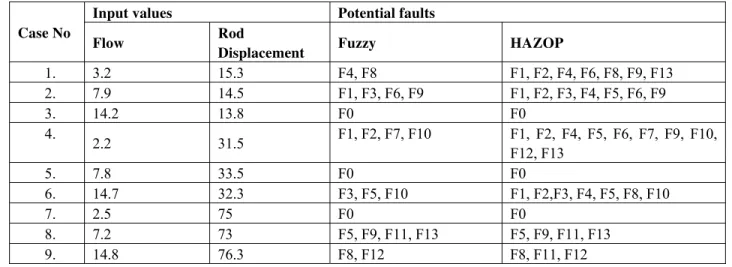
Table 8. Comparison of results
Case No
Input values Potential faults
Flow Rod
Displacement Fuzzy HAZOP
1. 3.2 15.3 F4, F8 F1, F2, F4, F6, F8, F9, F13
2. 7.9 14.5 F1, F3, F6, F9 F1, F2, F3, F4, F5, F6, F9
3. 14.2 13.8 F0 F0
4.
2.2 31.5 F1, F2, F7, F10 F1, F2, F4, F5, F6, F7, F9, F10,
F12, F13
5. 7.8 33.5 F0 F0
6. 14.7 32.3 F3, F5, F10 F1, F2,F3, F4, F5, F8, F10
7. 2.5 75 F0 F0
8. 7.2 73 F5, F9, F11, F13 F5, F9, F11, F13
9. 14.8 76.3 F8, F12 F8, F11, F12
The results produced using HAZOP for the same input are displayed in Table8. Like the fuzzy models HAZOP has also identified the multiple faults, but it has produced some false alarms, for instance in cases 1,2,4,6. Further it was not able to identify the developing faults using fuzzy classification approach. This is evident for cases 1 and 2. Hence it is observed that the fuzzy model has reduced the false alarm rate and also identified a few faults which are noticed by the conventional methods. From this comparison, it is found that the fuzzy system model has produced more accurate results than the conventional approaches.
7. Conclusion
This paper has presented a fuzzy logic based approach for fault detection in pneumatic actuator in cement industry Totally 19 faults out of which 13 numbers of critical faults of the pneumatic actuator in cement industry were considered in the fuzzy classification approach. In this paper, the fault symptom relationships were expressed in the form of fuzzy if-then rules. Simulation results from the model produced accurate results for the same input. The output produced by the model is compared with the conventional HAZOP model. The comparison showed that fuzzy logic approach is more suited for the fault diagnosis in pneumatic actuator in cement industry compared to the conventional approaches. To further improve the performance of the model the numerical data collected from the system have to be used to fine-tune the membership functions and the fuzzy rule base.
Acknowledgment
The authors would like to extend their deepest thanks to Mr. K. Raveendranath, Assistant General Manager, Instrumentation, The India Cements Limited, for his valuable suggestions and technical support during the course of the project.
8. References
[1] Isermann, R, “Supervision, fault detection and fault diagnosis methods an introduction”, Control Engineering Practice, 5 (5), 1997, pp
639-652.
[2] Isermann, R. and P. Balle, “Trends in the application of model-based fault detection and diagnosis of technical processes”, Control
Engineering Practice, 5 (5), 1997, pp 709-719.
[3] Leonhardt, S. and Ayoubi, M, “Methods of Fault diagnosis”, Control Practice, 5 (5), 1997, pp 683-692.
[4] Diego Ruiz, Jose Maria Nougues and Luis Puisgjaner, “Fault diagnosis support system for complex chemical plants”, Computers and
Chemical Engineering, 15, 2001, pp 151-160.
[5] Teodor Marcu, and Letitia Mirea, “Robust Detection and Isolation of Process Faults using Neural Networks”. IEEE Control System,1,
1997, pp 72-79.
[6] Venkatasubramanian, Rengasamy, R., Yin, K., and Kavuri, S.N, “A review of process Fault detection and diagnosis. Part-I: Quantitative
model-based methods”, Computers & Chemical Engineering, 27, 2003a, pp 293-311.
[7] Peter Balle, Dominik Fuessel, “Closed Loop fault diagnosis based on a no-linear process model and automatic fuzzy rule generation”,
Engineering Applications of Artificial Intelligence 13, 2000, pp 695-704.
[8] Shengwei Wang, Zhiming Jiang, “Valve fault detection and diagnosis based on CMAC neural networks”, Energy and Buildings 36, 2004,
[9] Venkat Venkatasubramanian, Jinsong Zhao, Shankar Viswanathan., “Intelligent Systems for HAZOP Analysis of Complex Process Plants”, Computers and Chemical Engineering 24, 2000, pp 2291-2302.
[10] Venkatasubramanian, Rengasamy, R., Yin, K., and Kavuri, S.N, “A review of process Fault detection and diagnosis. Part-III: Process
history based methods”, Computers & Chemical Engineering, 27, 2003b, pp 327-346.
[11] Babuska, R., and Verbruggen, H.B, “An overview of Fuzzy Modelling for control”, Control Engineering Practice, 4(11), 1996, pp
593-1606
[12] Yegnanarayana, D. Murthy, Devaraj. D, “A Fuzzy System Model for Plant Condition Monitoring. Proceedings of the ASME International