Assessment in the Residents of Shenzhen, China
Mei Yang1,2, Lixin Jiang1, Huiping Huang1, Shengbo Zeng2, Fen Qiu2, Miao Yu3, Xiaorong Li3, Sheng Wei3*
1Department of Health Surveillance and Management, Futian District Center for Disease Control and Prevention of Shenzhen, Shenzhen, Guangdong, China, 2Department of Laboratory, Futian District Center for Disease Control and Prevention of Shenzhen, Shenzhen, Guangdong, China,3Department of Epidemiology and Biostatistics, School of Public Health, Tongji Medical College of Huazhong University of Science and Technology, Wuhan, Hubei, China
Abstract
Although there are great changes of dietary in the past few decades in China, few are known about the aluminium exposure in Chinese diet. The aim of this study is to systematically evaluate the dietary aluminium intake level in residents of Shenzhen, China. A total of 853 persons from 244 household were investigated their diet by three days food records. Finally, 149 kinds of foods in 17 food groups were selected to be the most consumed foods. From them, 1399 food samples were collected from market to test aluminium concentration. High aluminium levels were found in jellyfish (median, 527.5 mg/ kg), fried twisted cruller (median, 466.0 mg/kg), shell (median, 107.1 mg/kg). The Shenzhen residents’ average dietary aluminium exposure was estimated at 1.263 mg/kg bw/week which is lower than the PTWI (provisional tolerable weekly intake). But 0–2 and 3–13 age groups have the highest aluminium intake exceeding the PTWI (3.356 mg/kg bw/week and 3.248 mg/kg bw/week) than other age groups. And the main dietary aluminium exposure sources are fried twisted cruller, leaf vegetables and bean products. Our study suggested that even three decades rapid economy development, children in Shenzhen still have high dietary aluminium exposure risk. How to control high dietary aluminium exposure still is a great public health challenge in Shenzhen, China.
Citation:Yang M, Jiang L, Huang H, Zeng S, Qiu F, et al. (2014) Dietary Exposure to Aluminium and Health Risk Assessment in the Residents of Shenzhen, China. PLoS ONE 9(3): e89715. doi:10.1371/journal.pone.0089715
Editor:Qinghua Sun, The Ohio State University, United States of America
ReceivedSeptember 23, 2013;AcceptedJanuary 21, 2014;PublishedMarch 3, 2014
Copyright:ß2014 Yang et al. This is an open-access article distributed under the terms of the Creative Commons Attribution License, which permits unrestricted use, distribution, and reproduction in any medium, provided the original author and source are credited.
Funding:This work was supported by Medical Scientific Research Foundation of Guangdong Province, China (A2012591). The funders had no role in study design, data collection and analysis, decision to publish, or preparation of the manuscript.
Competing Interests:The authors have declared that no competing interests exist. * E-mail: ws2008cn@gmail.com
Introduction
Aluminium (Al) is the third most abundant element on earth. Aluminium can be toxic to bone, bone marrow and the nervous system [1–3]. There are proposed relationships between alumin-ium and the occurrence of neurodegenerative disorder, metabolic bone disease, dyslipemia and even genotoxic activity [4–6]. For example, Al accumulation in the brain can potentiate oxidative and inflammatory events, leading to tissue damage and play a key role in the Alzheimer’s disease (AD) etiology [7,8]. The subjects with the higher neonatal aluminium exposure had lower lumbar spine bone mass and lower hip bone mass which suggested the aluminium toxicity to bone development [9,10]. Although food, water, airborne dust, antiperspirants, immunizations, allergy injections and antacids could be source of aluminium exposure for the general population, but food is the single largest contributor of aluminium intake [11–13]. Many foods or food products have been reported to have high level aluminium concentration, such as steamed pastry, bakery products (e.g. muffin, cake and pancake), tea, fried twisted cruller, drinking water, leavening product, shell, jellyfish and mung bean vermicelli [13–15]. The Joint Food and Agriculture Organization/World Health Organization Expert Committee on Food Additives (JECFA) established a provisional tolerable weekly intake (PTWI) for aluminium of 1 mg/kg body weight in 2006. Five years later, the committee re-evaluated the
safety of aluminium and proposed a PTWI of 2 mg/kg body weight in June 2011. The PTWI applies to all aluminium compounds in food, including food additives. Unfortunately, many reports about the daily dietary aluminium exposures in various countries and regions showed that the aluminium exposure greatly exceeded the new safety reference level in these popula-tions and consumption foods with aluminium-containing food additives were the major source of aluminium exposure for the general population [16–18].
Although the over intake of aluminium is essential to human health, but few investigations have been performed recently even the great change of daily dietary in the past thirty years in China. For example, Shenzhen city(2008 pop 8.77 million), the earliest economy special district of China economy reform, has experi-enced big changes of quantity and quality in residents dietary. But little is known about the dietary aluminium exposure level in Shenzhen residents. Here, we presented a latest study to assess the risk of dietary aluminium exposure in Shenzhen residents.
Materials and Methods
Ethics statement
Committee in Center for Disease Control and Prevention of Shenzhen, Guangdong, China.
Food consumption data and food sampling
To identify major consumption foods in Shenzhen residents, 853 persons from 244 household were investigated to their dietary by three-stage cluster sampling as a part of the second individual and national food consumption survey in China in 2008 [19]. All persons were asked to complete a food record during three consecutive days to describe their daily dietary as precisely as possible. Portion sizes were estimated through photographs compiled in a manual. 853 residents reported to consume 564 kinds of foods during three consecutive days. Total 21,792 food products were recorded. The representative foods were selected based the results of food records. Only foods consumed proportions over 5% and more were selected. In addition, the foods known as having high aluminium concentration were also selected included in this study (even if its consumed proportions are below 5%). Finally, 149 kinds of foods (17, 566 food products) in 17 groups of food were selected to represent the most consumed foods of the whole diet of Shenzhen population. They were steamed pastry, bakery pastry, fried twisted cruller, fruits, milk, rice, eggs and egg products, meat, flour products (exclude ferment pastry), leaf vegetables, vegetables (exclude leaf vegetables), shell, fish, jellyfish, beverages, bean product and water.
The food sampling for all foods in 17 groups was performed from 2009 to 2012 by professional samplers. To take into account the potential regional variations in occurrence, the sampling was performed in food markets from six districts of Shenzhen city (Futian, Luohu, Nanshan, Baoan, Longgang and Yantian districts). A total of 1, 399 food samples in 149 kinds of foods were collected randomly from supermarket and farm products
market. The food samples were put in aseptic food sampling bag and sent to laboratory as soon as possible.
Aluminium concentrations analyses
Food samples were ground to powder in an IKA WERKE-M20 knife mill (IKA, Staufen, Germany) and dried in an oven at 85uC for 4 hours. Thereafter, they were stored in refrigerators at 4uC before test. A 0.5 g portion for inductively coupled plasma-mass spectrometry was accurately weighed and transferred into a capped PTFE vessel, then mixed with 3 ml of 65% nitric acid and 2 ml of 30% hydrogen peroxide. Digestion was carried out in a Milestone Ethos 1 microwave device (Sorisole, Italy). The temperature was ramped to 200uC within 10 min, following by a dwell-time of 15 min under microwave irradiation at 1000W. After completion, the vessel was taken out to cool completely at room temperature. The sample solution was transferred to a volumetric flask and diluted to 50 ml with ddH2O.
Aluminium in the sample was determined by inductively coupled plasma–mass spectrometry (Thermo XS series 2; Agilent, Lexington, MA, USA) according to the standard method of China [20]. Typical operating conditions and instrumental parameters employed in this study were: forward power 1357W; analogue detector 1784V; PC detector 3265V; sampling depth 135 mm; cool gas 13.0 l/min Ar; auxiliary gas 0.72 l/min Ar; extraction 125.5V. The detection limit (LOD) of aluminium was 0.12mg/L.
The linear range was from 10mg/L to 2000mg/L. And the
recovery range was from 95.0% to 99.0%. According to international guidelines (GEMS/Food, 1995), the rate of non-detected values was lower than 60% and the non-non-detected values were assumed to be LOD/2.
Table 1.Food consumption data (mean, 95th and 99th percentiles) of the Shenzhen population.
Food group Consumption data (g/day) Consumption data (g/day bw)
Mean P95 P99 Mean P95 P99
Steamed pastry* 15.42640.99 86.34 161.07 0.39161.403 1.92 4.00
Bakery pastry 10.97640.76 69.96 123.78 0.25761.013 1.37 3.95
Fried twisted cruller 8.32634.48 52.15 165.28 0.21161.018 1.10 4.27
Fruits 234.106237.71 671.66 906.44 5.97469.076 20.33 43.05
Milk 162.876307.19 750.00 1334.00 6.115623.529 19.56 130.80
Rice 198.476142.69 448.01 637.07 4.64065.102 14.31 25.22
Eggs and egg products 38.79658.09 106.64 154.04 0.97061.789 3.06 8.84
Meat 166.076103.05 346.08 444.74 3.85464.146 10.39 20.87
Flour products 39.55670.29 155.88 364.49 0.91661.989 4.23 9.29
Leaf vegetables 119.096147.36 355.73 758.69 3.05666.406 9.82 25.86
Vegetables 205.116204.56 606.96 993.39 5.03567.086 16.00 36.12
Shell 0.7967.35 0.00 21.20 0.01660.139 0.00 0.56
Fish 90.566103.87 286.50 457.80 2.21563.680 7.58 18.23
Jellyfish 0.2162.14 0.00 6.86 0.00460.037 0.00 0.09
Beverages 233.386653.73 1470.56 3456.34 5.217618.933 29.92 68.17
Bean products 43.24671.13 188.73 377.87 1.08162.525 4.46 12.48
Water 1384.196967.56 3019.00 3757.20 33.066639.681 101.19 208.54
*including steamed stuffed bun, steamed bread, steamed twisted roll. **exclude ferment pastry.
***exclude leaf vegetable.
doi:10.1371/journal.pone.0089715.t001
Dietary Aluminium Exposure Assessment,Shenzhen
Food group 0- 3- 14- 20- 40-
60-Male Female Male Female Male Female Male Female Male Female Male Female
Steamed pastry* 1.0962.07 0.8461.45 1.0863.80 0.8662.33 0.1460.28 0.0160.06 0.3460.64 0.3160.58 0.1460.40 0.2560.61 0.1760.55 0.3160.72
Bakery pastry
1.5062.31 1.7063.96 0.2060.68 0.2060.59 0.2060.40 0.43660.66 0.2260.56 0.2661.32 0.0960.26 01060.32 0.2660.66 0.1960.62
Fried twisted cruller
0.2260.74 0.5661.49 0.4761.74 0.8762.61 0.0360.12 0.1460.34 0.2160.74 0.2060.89 0.0260.12 0.0460.20 0.0260.13 0.1660.56
Fruits 33.10623.89 28.82618.44 9.9068.98 12.41611.57 2.0862.70 4.7366.02 3.2363.47 3.8164.64 2.7963.20 5.2464.60 4.3863.97 4.7865.38
Milk 86.46698.00 60.06666.34 5.9969.83 12.71616.91 4.4265.99 1.9463.90 1.6663.37 2.5764.92 1.7663.21 2.2263.84 1.4462.94 1.9564.50
Rice 15.83613.76 15.2369.60 7.6565.72 9.2368.00 4.1662.98 4.0162.12 3.0862.13 4.0363.10 2.5261.96 3.0162.13 3.3362.48 4.6663.36
Eggs and egg products
5.3864.60 4.3163.66 1.2761.41 1.7862.69 0.7360.50 0.7960.56 0.5760.54 0.8361.02 0.3460.40 0.8062.39 0.7060.77 0.8060.71
Meat 13.98611.41 13.7068.36 6.2464.93 7.0666.34 3.8162.12 3.9262.83 2.8561.55 3.5761.97 2.1661.47 2.5561.56 1.6061.04 2.5461.70
Flour products** 2.4763.93 0.5861.08 2.2263.74 2.2764.00 0.9260.94 1.0661.52 0.5561.12 0.6361.19 0.6661.52 0.7061.05 0.4860.68 0.6660.87
Leaf vegetables
12.26610.28 9.5366.28 8.10615.73 5.88611.65 3.0663.39 2.9863.21 1.4361.12 2.0661.61 1.9462.40 2.2563.01 1.2660.71 1.7061.35
Vegetables*** 16.44611.42 19.50613.01 10.15611.58 10.15612.62 4.1764.16 4.9765.16 3.1463.07 4.1764.78 2.2962.02 2.6162.49 4.0563.80 5.1665.01
Shell 0.0860.20 0.0560.17 0.0060.00 0.0060.00 0.0160.06 0.0360.10 0.0060.03 0.0360.25 0.0060.01 0.0160.02 0.0160.07 0.0660.20
Fish 8.4369.99 9.8167.12 4.0366.30 4.7165.51 1.6661.98 1.4761.78 1.1761.32 1.7361.89 1.1861.37 1.7862.09 1.5561.77 1.6461.78
Jellyfish 0.0060.00 0.0060.00 0.0060.00 0.0060.00 0.0060.00 0.0060.00 0.0060.03 0.0160.05 0.0060.04 0.0160.05 0.0060.04 0.0060.03
Beverages 17.27636.40 7.88614.98 9.85649.09 5.53611.34 9.12617.11 8.68614.96 4.14610.45 3.4469.87 2.0267.23 6.01616.84 5.67614.20 3.7769.67
Bean products 5.6668.90 4.6366.11 1.8363.81 1.8463.04 1.5662.68 1.0662.19 0.6560.94 0.8461.41 0.5260.87 0.5060.76 0.6160.76 1.1061.59
Water 141.45694.88 152.67677.00 44.46653.43 52.28653.46 20.94613.51 27.48623.15 22.22615.68 27.34620.01 23.92614.66 26.19615.92 16.05614.32 29.18623.38
*Include steamed stuffed bun, steamed bread, steamed twisted roll. **exclude ferment pastry.
***exclude leaf vegetable.
doi:10.1371/journal.pone.0089715.t002
Dietary
Aluminium
Exposure
Assessment
,Shenzhen
ONE
|
www.ploson
e.org
3
March
2014
|
Volume
9
|
Issue
3
Table 3.Concentrations of Aluminum in the 17 food groups in Shenzhen, China.
Food group n Al level (mg/kg) range of aluminum levels(mg/kg)
range median ND#
0.01, 10.0, 50.0, 500, $500.01
Steamed pastry* 311 0.502–1226.016 17.110 - 112 53 16 110 20
Baked pastry 89 0.513–1250.037 12.000 - 42 22 8 15 2
Fried twisted cruller 34 0.500–990.321 466.000 - 7 4 - 7 16
Fruits 184 ND-7.789 0.005 94 90 - - -
-Milk 25 ND-0.408 0.180 1 24 - - -
-Rice 44 ND-31.446 0.821 6 36 2 - -
-Eggs and egg products 31 ND-0.560 0.219 8 23 - - -
-Meat 70 ND-2.138 0.012 30 40 - - -
-Flour products(exclude ferment pastry)
65 ND-41.247 4.000 3 48 14 - -
-Leaf vegetables 116 ND-210.753 13.560 1 48 54 13 -
-Vegetables(exclude leaf vegetable)
108 ND-27.130 0.706 12 89 7 - -
-Shell 10 6.611–292.894 107.100 - 2 1 1 6
-Fish 50 ND-44.329 0.664 11 33 6 - -
-Jellyfish 6 318.334–1000.359 527.500 - - - - 3 3
Beverages 13 ND-0.213 0.010 6 7 - - -
-Bean products 59 ND-143.003 10.610 1 28 26 3 1
-Water 184 ND-0.118 0.052 3 181 - - -
-*Include steamed stuffed bun, steamed bread, steamed twisted roll. **exclude ferment pastry.
***exclude leaf vegetable. #
ND, Not detected.
doi:10.1371/journal.pone.0089715.t003
Table 4.Estimated dietary Aluminum exposures in a week (mean, 95th and 99th percentiles) of the Shenzhen population.
Food group Dietary exposure (mg/kg bw/week) Contribution of total exposure (%)
Mean±SD P95 P99 Mean P95 P99
Steamed pastry* 0.04760.168 0.230 0.479 3.72 4.13 2.42
Baked pastry 0.02260.085 0.115 0.332 1.74 2.06 1.67
Fried twisted cruller 0.68963.322 3.582 13.94 54.60 64.27 70.30
Fruits 0.00060.000 0.000 0.002 0.00 0.00 0.01
Milk 0.00860.030 0.025 0.165 0.63 0.45 0.83
Rice 0.02760.029 0.082 0.145 2.14 1.47 0.73
Eggs and egg products 0.00160.003 0.005 0.014 0.08 0.09 0.07
Meat 0.00060.000 0.000 0.002 0.00 0.00 0.01
Flour products** 0.02660.056 0.118 0.260 2.06 2.12 1.31
Leaf vegetables 0.29060.608 0.932 2.455 22.98 16.72 12.38
Vegetables*** 0.02560.035 0.079 0.178 1.98 1.42 0.90
Shell 0.01260.104 0.000 0.418 0.95 0.00 2.11
Fish 0.01060.017 0.035 0.085 0.79 0.63 0.43
Jellyfish 0.01360.137 0.000 0.346 1.03 0.00 1.74
Beverages 0.00060.001 0.002 0.005 0.00 0.04 0.03
Bean products 0.08060.188 0.331 0.927 6.34 5.94 4.67
Water 0.01260.014 0.037 0.076 0.95 0.66 0.38
Total 1.263 4.720 15.794 100.00 100.00 100.00
*Include steamed stuffed bun, steamed bread, steamed twisted roll. **exclude ferment pastry.
***exclude leaf vegetable.
doi:10.1371/journal.pone.0089715.t004
Dietary Aluminium Exposure Assessment,Shenzhen
Exposure assessment
The individual food consumption data are from the food consumption survey of Shenzhen population in 2008. Mean consumption, 95th percentile (P95) and 99th percentile (P99) were calculated for each group of foods. Then average weekly food consumption data of per kg body weight was calculated for each group of food. Exposure to average weekly aluminium was assessed by multiplying the consumption data of per kg body weight and the median of aluminium concentration levels for each food group. Furthermore, Mean exposure, 95th percentile (P95) and 99th percentile (P99) were calculated for each group of food. Considering each of the 17 food groups, the mean contributions to total exposure to aluminium were calculated. Then the estimated average weekly exposure levels were compared with the PTWI. In addition, t test, Mann-Whinety U test, ANOVA and General Linear Model were used to compare the mean aluminium exposure levels by age and sex groups. All statistical analyses were conducted using the statistics program SPSS/PC version 12.0 (Chicago, IL,USA). All significance tests were 2-tailed, andP values less than 0.05 were considered to indicate statistical significance.
Results
Food consumption data
The results of mean consumption, 95th percentile (P95) and 99th percentile (P99) of individual consumption foods are summarized in Table 1. Among all 17 food groups, water was the most consumptive food with a mean of 1384.19 g/day, the second was fruit with a mean 234.10 g/day, and the next was beverage with a mean consumptive value of 233.38 g/day. The individual food consumptions per kg body weight were summa-rized in Table 1. Water was most consumptive food with a mean of 33.066 g/day per kg body weight (bw). The subsequences were milk (6.115 g), fruit (5.974 g) and beverage (5.217 g). Further stratified analyses by age and sex were shown in Table 2. The subjects in 0–2 year old group have most foods compared to other age groups (almost allP,0.05). Although there were no significant differences in food consumptions between females and males (all P,0.05), females tended to consume more fruits, milk, eggs, meat, fish, water and less beverages than males did.
Concentrations of Aluminium in food
A total of 1399 food samples were analyzed for Aluminium concentration. The results were summarized in Table 3.
Alumin-ium concentrations of 176 samples were lower than the limit of detection (LOD). Aluminium concentrations were varied consid-erably among the food samples (ranged from not detected (ND) to 1250.037 mg/kg). Among all 17 food groups, jellyfish has the highest aluminium concentration, ranging from 318.334 to 1000.359 mg/kg with a median of 527.500 mg/kg. The fried twisted cruller has the second highest aluminium level with the median was 466.000 mg/kg and range from 0.500 to 990.321 mg/kg. The third is shell with the median was 107.100 mg/kg and range from 6.611 to 292.894 mg/kg. Steamed pastry, baked pastry, leaf vegetables and bean products were found to contain the higher aluminium concentrations than fruits, rice, milk, meat and vegetables (exclude leaf vegetables).
Dietary Aluminium exposure
Exposure to aluminium was assessed by multiplying the consumption data of per kg body weight and the median of aluminium concentrations in 17 food groups. Mean exposure, 95th percentile (P95) and 99th percentile (P99) were calculated for each group of food. The contribution of the total exposure to aluminium was calculated. The Shenzhen population’s mean exposure to Aluminium was estimated at 1.263 mg/kg bw/week (Table 4). At the 95th percentile, exposure was estimated at 4.720 mg/kg bw/week. At the 99th percentile, exposure was estimated at 15.794 mg/kg bw/week. In the total dietary exposure, aluminium mainly came from fried twisted cruller, leaf vegetables and bean products. For the mean exposure level, the proportions from these three food groups were 54.60%, 22.98% and 6.34%, respectively. For the 95th percentile exposure level, the proportions from these three food groups respectively were 64.27%, 16.72% and 5.94%. And the contribution proportions from these three food groups respectively were 70.30%, 12.38% and 4.67% at the 99th percentile exposure level.
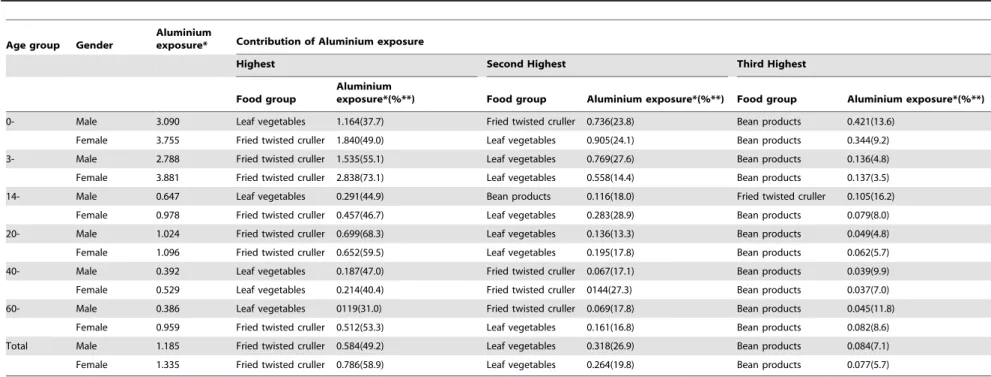
The aluminium exposure levels by age and sex in Shenzhen population are shown in Table 5. There is no significant different between aluminium exposure levels in females and males (P= 0.530), but it is significant among age groups (P,0.001). The 0–2 and 3–13 age groups have an excess aluminium intake than other groups and intake aluminium exceed the PTWI level (all P,0.05). Furthermore, there were no significant differences between aluminium exposure levels of males and females in most of age groups (most ofP.0.05) except in age 60 and older group (P= 0.032). But females have more aluminium intake than males (1.335 vs. 1.185 mg/kg bw/week). The three main aluminium sources in dietary in each age group are shown in Table 6. The fried twisted cruller, leaf vegetables and bean products were the three most important sources of aluminium intake which accounted for 70%–85% of total aluminium intake in each age group.
Discussion
The present study showed that the dietary aluminium exposure level in Shenzhen population is 1.263 mg/kg bw/week which is lower than the PTWI. The fried twisted cruller, leaf vegetables and bean products were major contributors to aluminium exposure in the population. Group analyses suggested that the children in Shenzhen intake high level aluminium over PTWI as while as females took more dietary aluminium than males.
Although rice is staple foods in Shenzhen, fried twisted cruller is a popular wheat flour food for breakfast, Cantonese morning tea and afternoon tea in Shenzhen, China. To get repaid rising in cooking fried twisted cruller, more aluminium-containing raising agents (for example, baking alum and baking soda) are usually
Table 5.Dietary Aluminium exposures (mg/kg bw/week) in Shenzhen population by age and sex groups.
Age Total Male Female P*
n Mean±SD n Mean±SD n Mean±SD
0- 35 3.35663.546 21 3.09062.450 14 3.75564.834 0.595 3- 121 3.24867.210 70 2.78865.854 51 3.88168.761 0.412 14- 49 0.80360.911 26 0.64760.605 23 0.97861.154 0.207 20- 340 1.06562.732 147 1.02462.426 193 1.09662.950 0.809 40- 217 0.46260.604 106 0.39260.462 111 0.52960.710 0.091 60- 91 0.72061.446 38 0.38660.486 53 0.95961.819 0.032 Total 853 1.26363.481 408 1.18563.032 445 1.33563.848 0.530 *t test or Mann-Whinety U test.
Table 6.The three main resource of dietary Aluminium exposure in Shenzhen residents by age.
Age group Gender
Aluminium
exposure* Contribution of Aluminium exposure
Highest Second Highest Third Highest
Food group
Aluminium
exposure*(%**) Food group Aluminium exposure*(%**) Food group Aluminium exposure*(%**)
0- Male 3.090 Leaf vegetables 1.164(37.7) Fried twisted cruller 0.736(23.8) Bean products 0.421(13.6)
Female 3.755 Fried twisted cruller 1.840(49.0) Leaf vegetables 0.905(24.1) Bean products 0.344(9.2)
3- Male 2.788 Fried twisted cruller 1.535(55.1) Leaf vegetables 0.769(27.6) Bean products 0.136(4.8)
Female 3.881 Fried twisted cruller 2.838(73.1) Leaf vegetables 0.558(14.4) Bean products 0.137(3.5)
14- Male 0.647 Leaf vegetables 0.291(44.9) Bean products 0.116(18.0) Fried twisted cruller 0.105(16.2)
Female 0.978 Fried twisted cruller 0.457(46.7) Leaf vegetables 0.283(28.9) Bean products 0.079(8.0)
20- Male 1.024 Fried twisted cruller 0.699(68.3) Leaf vegetables 0.136(13.3) Bean products 0.049(4.8)
Female 1.096 Fried twisted cruller 0.652(59.5) Leaf vegetables 0.195(17.8) Bean products 0.062(5.7)
40- Male 0.392 Leaf vegetables 0.187(47.0) Fried twisted cruller 0.067(17.1) Bean products 0.039(9.9)
Female 0.529 Leaf vegetables 0.214(40.4) Fried twisted cruller 0144(27.3) Bean products 0.037(7.0)
60- Male 0.386 Leaf vegetables 0119(31.0) Fried twisted cruller 0.069(17.8) Bean products 0.045(11.8)
Female 0.959 Fried twisted cruller 0.512(53.3) Leaf vegetables 0.161(16.8) Bean products 0.082(8.6)
Total Male 1.185 Fried twisted cruller 0.584(49.2) Leaf vegetables 0.318(26.9) Bean products 0.084(7.1)
Female 1.335 Fried twisted cruller 0.786(58.9) Leaf vegetables 0.264(19.8) Bean products 0.077(5.7)
* mg/kg bw/week.
** The proportion of Al intake of the food in the total dietary Al intake in the population. doi:10.1371/journal.pone.0089715.t006
Dietary
Aluminium
Exposure
Assessment
,Shenzhen
PLOS
ONE
|
www.ploson
e.org
6
March
2014
|
Volume
9
|
Issue
3
|
used in fried twisted cruller which lead to high aluminium concentration in it. Except fried twisted cruller, aluminium-containing raising agents are also used in other steamed pastry and baked pastry which is a major dietary aluminium exposure resource. These findings are similar to the results from study in Hongkong, UK and USA, where dietary aluminium exposure is derived mainly from miscellaneous cereals and baking powder [13,15,18]. Therefore, to restrict aluminium-containing food additive using or use non-aluminium-containing food additive in food processing is a key way to reduce dietary aluminium exposure risk in Shenzhen population.
Mean dietary aluminium exposure from leaf vegetables was 0.290 mg/kg bw/week in Shenzhen. The median aluminium concentrations in leaf vegetable in Shenzhen was 13.560 mg/kg (ranged from ND to 210.753 mg/kg) were similar to Spanish (20.12 mg/Kg) but higher than that in French and UK [17,21,22]. Leaf vegetables could absorb metal from soil and accumulate during growth process [23,24]. As the third distributed widely element in the earth crusted soil, aluminium could be absorbed by leaf vegetables through similar way. The main consumed leaf vegetables in Shenzhen are Chinese cabbage, green Chinese cabbage, water spinach and spinach. Among of them, spinach has the highest aluminium concentration, 45.838 mg/kg. Water spinach has the second highest aluminium concentration, 13.966 mg/kg and lettuce has the third highest aluminium concentration, 10.696 mg/kg. Considering the high consumption of these leaf vegetables in Shenzhen residents dietary, leaf vegetables were the second most important aluminium sources in this population.
Although aluminium intake level in adult did not exceed PTWI, but children in Shenzhen have high risk in aluminium exposure than adults even this city is the leading developed area in China. The mean aluminium exposure level in children in Shenzhen is 3.272 mg/kg bw/week which is higher than the PTWI level (2 mg/kg bw/week) and far higher than the mean aluminium intake level 0.44 mg/kg bw/week in French children [17]. In Shenzhen, Children over 3 years older in Shenzhen will be sent to day care center or kindergarten while children over 7 years older will be sent to elementary school. In there, their breakfast and lunch will be supplied by those institutions or bought by themselves. Since they generally only share food in a dinner with their parents in a weekday, it is reasonable that there are differences between the aluminum intake of children and their parents did. A study has compared the aluminium intake level in
children and their parents and found that the average aluminium intakes between children and their parents are significantly different even they shared same foods [25]. It suggested that children and adults faced different risk of aluminium exposure even they shared same diet. Children are in higher risk of aluminium exposure than adult regarding the adverse effect of aluminium on the nervous system development [26,27]. From the consumption data of children, we found the fried twisted cruller is also the major aluminium exposure source for children in Shenzhen. To protect children from high aluminium exposure, the fried twisted cruller should be removed from the diet of children in Shenzhen.
There some limitation for current study. First, study participants in dietary survey already knew about involvement in the study. That may bias the results for their performing might be better. Second, the results for children may be biased by over estimation since the food records for children were filled by their parents. Third, we use the median of aluminium concentration and the mean of consumption to estimate the dietary exposure. This is a simple point assessment for dietary aluminium exposure, which may not fully present the aluminium exposure level of Shenzhen population. Probability assessment method may be needed for further aluminium exposure assessment. Third, only three days dietary records were used to assess aluminium dietary level. Such diet assessment is limited for not considering the season change of diet in Shenzhen. Hence, dietary aluminium exposure estimation may not precisely reflect the individual true exposure level. More comprehensive dietary investigations are needed for future aluminium exposure assessment.
As far as we know, this study is the latest systematically assessment on the dietary aluminium exposure of Chinese. It suggested that even with three decades rapidly development, residents in Shenzhen still face high dietary Aluminium exposure, especially children. How to control high dietary aluminium exposure still is a great public health challenge in Shenzhen, China.
Author Contributions
Conceived and designed the experiments: M. Yang SW. Performed the experiments: M. Yang LJ HH SZ FQ. Analyzed the data: M. Yang XL M. Yu. Contributed reagents/materials/analysis tools: LJ HH SZ FQ. Wrote the paper: M. Yang M. Yu SW.
Reference
1. Yokel RA (2000) The toxicology of aluminum in the brain: a review. Neurotoxicology 21: 813–828.
2. Yokel RA, McNamara PJ (2001) Aluminium toxicokinetics: an updated minireview. Pharmacol Toxicol 88: 159–167.
3. Varma PP, Kumar R, Prasher PK, Roy ND (1999) Hypochromic anaemia in chronic renal failure–role of aluminium. J Assoc Physicians India 47: 690–693. 4. French P, Gardner MJ, Gunn AM (1989) Dietary aluminium and Alzheimer’s
disease. Food Chem Toxicol 27: 495–498.
5. Nayak P, Chatterjee AK (2001) Differential responses of certain brain phosphoesterases to aluminium in dietary protein adequacy and inadequacy. Food Chem Toxicol 39: 587–592.
6. Krewski D, Yokel RA, Nieboer E, Borchelt D, Cohen J, et al. (2007) Human health risk assessment for aluminium, aluminium oxide, and aluminium hydroxide. J Toxicol Environ Health B Crit Rev 10 Suppl 1: 1–269. 7. Campbell A (2002) The potential role of aluminium in Alzheimer’s disease.
Nephrol Dial Transplant 17 Suppl 2: 17–20.
8. Gupta VB, Anitha S, Hegde ML, Zecca L, Garruto RM, et al. (2005) Aluminium in Alzheimer’s disease: are we still at a crossroad? Cell Mol Life Sci 62: 143–158.
9. Fewtrell MS, Edmonds CJ, Isaacs E, Bishop NJ, Lucas A (2011) Aluminium exposure from parenteral nutrition in preterm infants and later health outcomes during childhood and adolescence. Proc Nutr Soc 70: 299–304.
10. Hernandez-Sanchez A, Tejada-Gonzalez P, Arteta-Jimenez M (2013) Alumin-ium in parenteral nutrition: a systematic review. Eur J Clin Nutr 67: 230–238. 11. Yokel RA, Florence RL (2006) Aluminum bioavailability from the approved food additive leavening agent acidic sodium aluminum phosphate, incorporated into a baked good, is lower than from water. Toxicology 227: 86–93. 12. Yokel RA, Lasley SM, Dorman DC (2006) The speciation of metals in mammals
influences their toxicokinetics and toxicodynamics and therefore human health risk assessment. J Toxicol Environ Health B Crit Rev 9: 63–85.
13. Saiyed SM, Yokel RA (2005) Aluminium content of some foods and food products in the USA, with aluminium food additives. Food Addit Contam 22: 234–244.
14. Arnich N, Sirot V, Rivie`re G, Jean J, Noe¨l L, et al. (2012) Dietary exposure to trace elements and health risk assessment in the 2nd French Total Diet Study. Food and Chemical Toxicology 50: 2432–2449.
15. Wong WWK, Chung SWC, Kwong KP, Yin Ho Y, Xiao Y (2010) Dietary exposure to aluminium of the Hong Kong population. Food Additives & Contaminants: Part A 27: 457–463.
16. Ohno K, Ishikawa K, Kurosawa Y, Matsui Y, Matsushita T, et al. (2010) Exposure assessment of metal intakes from drinking water relative to those from total diet in Japan. Water Science & Technology 62: 2694.
18. Rose M, Baxter M, Brereton N, Baskaran C (2010) Dietary exposure to metals and other elements in the 2006 UK Total Diet Study and some trends over the last 30 years. Food Additives & Contaminants: Part A 27: 1380–1404. 19. Liu S, Wang W, Zhang J, He Y, Yao C, et al. (2011) Prevalence of diabetes and
impaired fasting glucose in Chinese adults, China National Nutrition and Health Survey, 2002. Prev Chronic Dis 8: A13.
20. China MoHo (2009) Determination of aluminium in food: ICP-MAS. GB/ T23374-2009. Beijing: China Standard Press.
21. Ysart G, Miller P, Crews H, Robb P, Baxter M, et al. (1999) Dietary exposure estimates of 30 elements from the UK Total Diet Study. Food Addit Contam 16: 391–403.
22. Gonzalez-Weller D, Gutierrez AJ, Rubio C, Revert C, Hardisson A (2010) Dietary intake of aluminum in a Spanish population (Canary Islands). J Agric Food Chem 58: 10452–10457.
23. Xu D, Zhou P, Zhan J, Gao Y, Dou C, et al. (2013) Assessment of trace metal bioavailability in garden soils and health risks via consumption of vegetables in
the vicinity of Tongling mining area, China. Ecotoxicology and Environmental Safety 90: 103–111.
24. Wang Y, Qiao M, Liu Y, Zhu Y (2012) Health risk assessment of heavy metals in soils and vegetables from wastewater irrigated area, Beijing-Tianjin city cluster, China. Journal of Environmental Sciences 24: 690–698.
25. Aung NN, Yoshinaga J, Takahashi JI (2006) Dietary intake of toxic and essential trace elements by the children and parents living in Tokyo Metropolitan Area, Japan. Food Addit Contam 23: 883–894.
26. Bishop NJ, Morley R, Day JP, Lucas A (1997) Aluminum neurotoxicity in preterm infants receiving intravenous-feeding solutions. N Engl J Med 336: 1557–1561.
27. Priest ND (2004) The biological behaviour and bioavailability of aluminium in man, with special reference to studies employing aluminium-26 as a tracer: review and study update. J Environ Monit 6: 375–403.
Dietary Aluminium Exposure Assessment,Shenzhen