❊♥s❛✐♦s ❊❝♦♥ô♠✐❝♦s
❊s❝♦❧❛ ❞❡ Pós✲●r❛❞✉❛çã♦ ❡♠ ❊❝♦♥♦♠✐❛ ❞❛ ❋✉♥❞❛çã♦ ●❡t✉❧✐♦ ❱❛r❣❛s
◆◦ ✻✽✹ ■❙❙◆ ✵✶✵✹✲✽✾✶✵
❊q✉✐t② ❛♥❞ ❊✣❝✐❡♥❝② ✐♥ ❊❞✉❝❛t✐♦♥✿ ♠♦t✐✈❛✲
t✐♦♥s ❛♥❞ t❛r❣❡ts
❖s ❛rt✐❣♦s ♣✉❜❧✐❝❛❞♦s sã♦ ❞❡ ✐♥t❡✐r❛ r❡s♣♦♥s❛❜✐❧✐❞❛❞❡ ❞❡ s❡✉s ❛✉t♦r❡s✳ ❆s
♦♣✐♥✐õ❡s ♥❡❧❡s ❡♠✐t✐❞❛s ♥ã♦ ❡①♣r✐♠❡♠✱ ♥❡❝❡ss❛r✐❛♠❡♥t❡✱ ♦ ♣♦♥t♦ ❞❡ ✈✐st❛ ❞❛
❋✉♥❞❛çã♦ ●❡t✉❧✐♦ ❱❛r❣❛s✳
❊❙❈❖▲❆ ❉❊ PÓ❙✲●❘❆❉❯❆➬➹❖ ❊▼ ❊❈❖◆❖▼■❆ ❉✐r❡t♦r ●❡r❛❧✿ ❘❡♥❛t♦ ❋r❛❣❡❧❧✐ ❈❛r❞♦s♦
❉✐r❡t♦r ❞❡ ❊♥s✐♥♦✿ ▲✉✐s ❍❡♥r✐q✉❡ ❇❡rt♦❧✐♥♦ ❇r❛✐❞♦ ❉✐r❡t♦r ❞❡ P❡sq✉✐s❛✿ ❏♦ã♦ ❱✐❝t♦r ■ss❧❡r
❉✐r❡t♦r ❞❡ P✉❜❧✐❝❛çõ❡s ❈✐❡♥tí✜❝❛s✿ ❘✐❝❛r❞♦ ❞❡ ❖❧✐✈❡✐r❛ ❈❛✈❛❧❝❛♥t✐
❈♦rt❡s ◆❡r✐✱ ▼❛r❝❡❧♦
❊q✉✐t② ❛♥❞ ❊❢❢✐❝✐❡♥❝② ✐♥ ❊❞✉❝❛t✐♦♥✿ ♠♦t✐✈❛t✐♦♥s ❛♥❞ t❛r❣❡ts✴ ▼❛r❝❡❧♦ ❈♦rt❡s ◆❡r✐ ✕ ❘✐♦ ❞❡ ❏❛♥❡✐r♦ ✿ ❋●❱✱❊P●❊✱ ✷✵✶✵
✭❊♥s❛✐♦s ❊❝♦♥ô♠✐❝♦s❀ ✻✽✹✮
■♥❝❧✉✐ ❜✐❜❧✐♦❣r❛❢✐❛✳
EQUITY AND EFFICIENCY IN EDUCATION:
MOTIVATIONS AND TARGETS
1Marcelo Neri2
1
ABSTRACT
The recently released "Educational PAC" attempts to place basic education at the center of the social debate. We have subsidized this debate, offering a diagnosis of how different education levels can impact individuals' lives through broad and easily interpreted indicators. Initially, we analyze how much each educational level reaches the poorest population. For example, how are those in the bottom strata of income distribution benefited by childcare centers, private secondary education, public university or adult education. The next step is to quantify the return of educational actions, such as their effects on employability and an individual's wages, and even health as perceived by the individual, be that individual poor, middle class or elite.
Equality and Efficiency in Education:
Motivations and Targets
1) Overview
The “Educational PAC” released by the Brazilian federal government in the begin of 2007, and a series of civil society initiatives, in particular the Commitment All for Education (Compromisso Todos pela Educação), have placed basic education at the core of the Brazilian social debate. A primary objective of the present research is to feed the debate in course, showing how different levels of education—and the associated policies—can be evaluated through the means of broad, easy-to-interpret indicators. The objective here is not to discuss the merit of each of the points in question, vis-à-vis the enormous challenges and educational needs in the country. This is a broad and complex theme; we emphasize only the change in focus from higher education towards basic education, and two specific points of the “Educational PAC”: widening from 15 to 17 years of age the range of those benefited by the educational conditionalities of the Bolsa-Familia program, and the incorporation of measurements of responsibility between federal government and states and municipalities, based on the evolution of the Index of Educational Development (IDEB) recently created.
The objective is to provide simple conceptual and empirical frameworks to understand the dilemmas behind educational policies.
It is not enough to comprehend from an outsider’s perspective the good properties of educational policies, such as the potential for equality and the private or social returns; it is also necessary to understand how this information reached individuals and how they incorporate these into their decisions. In the second part of the study, we present objective evidence of some subjective aspects associated to education. We discuss direct questions such as: why don’t young adults of a certain age attend school? Is it because they must work to help increase the family income? Is it because they do not have access to an educational facility, or simply because they do not want the type of school being offered? Aside from the school-related reasons, we propose a synthetic school permanence index, which combines the enrolment rates, and the length of the school day. This index reveals the adherence to measures of academic performance.
The electronic version of this text allows us to delve deeper into topics of greater
interest in the text through links with components in the research website S, with texts
T, notes N, seminar and debate videos Vand a database with interactive panoramas and
simulators BD based on econometric models. These databases offer the opportunity to
resources, similar to the spirit of Bolsa Familia conditionalities in relation to poor families.
2. Equality and Efficiency
“One Real applied to basic education has 22 more times the capacity of reaching
the poorest than when applied to public higher education.”
Education, as any public policy of a structural nature, affects the lives of individuals through the improvement in their access conditions and/or returns from these actions, which brings us to the traditional dilemma between equality and efficiency through public actions. We begin with the analysis of educational policies through the prism of equality: A pro-poor policy is that which benefits the poorest as opposed to the non-poor. This means that, given a fixed cost for the government and a student’s return, a pro-poor policy should result in a greater reduction in poverty. Policy A will be more pro-poor than policy B if, for the identical cost of implementing them, policy A leads to a greater reduction in poverty than policy B. In order to determine whether a policy is pro-poor, we use indicators that have been formulated by Nanak Kakwani and Hyun Son, which are then applied to Brazilian education in a joint study, shown here first hand.
Aside from the technicalities involved, the advantage of the proposed indicator is its intuitive interpretation, which leads to a simple analysis by the policy managers,
and even by the average citizen3. Otherwise we observe: the greater the respective
pro-poor indicator of a given policy, the greater the ability of each allocated Real reaching the poor. The smallest level of the indicator is zero when for each Real distributed per citizen, that same Real does not reach any poor; when the indicator reaches one, each Real has the ability of reaching the poor – in a universal policy that reaches all individuals uniformly, be they poor, middle class or wealthy.
3 The functional form of the indicator is
∫
∂∂= b x f x dx
x P
b ( ) ( )
1
ηθ
λ where b is the educational
a. Equality
“The equality index of private secondary education is close to that of public
university, suggesting that the same individuals attend these levels, in distinct time
periods.”
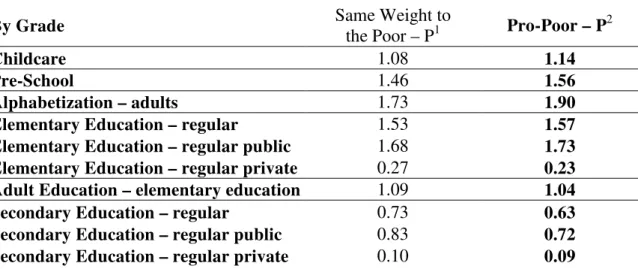
An advantage of the equality indicator as proposed is its adaptability to different poverty measures found in literature. We opt here for displaying in Table 1 two poverty
indicators: in the second column, we present P1, which attributes the same weight to
those below the poverty line and in the third column, we use P2, which attributes more
weight to the poorest. The indicators are based on the CPS poverty line4, equivalent to
R$125 per month at the Greater São Paulo prices of October 2006, adjusted for regional living expense differences from the IBGE’s latest National Consumer Expenditure Survey POF collected in 2002 and 2003. In the greater part of the analysis, we opt for
P2 specifically because of its greater forwardness.
The equality ranking of those who are undergoing different educational levels shows that, in general, the lower levels of education are more pro-poor than higher
levels of education. Another aspect in the equality hierarchy, stronger for P,2 is that it’s
more sensitive to the poor. The equality indicator tends to increase in the lower levels of education when the poorest of the poor are prioritized—as observed when we move
from P1 to P2, while the opposite occurs in the higher levels of education.
Table 1 –Education Pro-Poor Index
By Grade Same Weight to the Poor – P1 Pro-Poor – P2
Childcare 1.08 1.14
Pre-School 1.46 1.56
Alphabetization – adults 1.73 1.90
Elementary Education – regular 1.53 1.57
Elementary Education – regular public 1.68 1.73
Elementary Education – regular private 0.27 0.23
Adult Education – elementary education 1.09 1.04
Secondary Education – regular 0.73 0.63
Secondary Education – regular public 0.83 0.72
Secondary Education – regular private 0.10 0.09
4 It is the same indigence line proposed in Ferreira, F. et all. (2003) “A Robust Poverty Profile for
Adult Education – secondary education 0.52 0.44
College Entrance Exam (Pré-Vestibular) 0.19 0.15
Tertiary Education 0.07 0.07
Tertiary Education – public 0.12 0.10
Tertiary Education – private 0.05 0.06
Graduate 0.00 0.00
Source: PNAD 2003/IBGE Microdata
The pro-poor indexes at the extremes of the educational spectrum confirm the expectation that the lower levels of education are more equitable or pro-poor than the higher levels: graduate education displays a zero index (until the hundredth decimal) and the lowest level of adult alphabetization has the highest indicator of 1.9. Moving on to more common levels, regular basic education has an index of 1.57, against 0.63 of secondary education and 0.07 of higher education. This means that an additional Real spent in basic education has 2.5 more times the ability of reaching the poor than one spent in secondary education and 22.5 times that spent in higher education.
As could be expected in all levels of teaching, the supply of public education is more pro-poor than the private. In basic education, the pro-poor index is of 1.73 in public supply versus 0.23 in the case of private supply. At the high school level, these indicators reach 0.72 for public and 0.09 for private; in the case of higher education, these indexes reach 0.1 for public and 0.06 for private. In other words, the possibility of a poor reaching public university is much less than practically all other levels. The proposed targeting index for private secondary education of 0.09 is close to that of public university, which is consistent with the idea that private school students are those who reach public universities. The targeting degree of college entrance exams students (pré-vestibular) of 0.15 shows that few poor attempt to move from secondary to tertiary education
Finally, early childhood education and pre-school show pro-poor indexes of 1.14 and 1.56, which demonstrates a degree of focus superior to that of the public
universities. Recent research P shows that the access rate to pre-school in the Northeast,
b. Public and Private Expenses in Public and Private Education
“The cost of total private education is of R$14.00 monthly per Brazilian or R$89.90
per Brazilian student..”
“The cost per student of a student enrolled in high school was of R$1,152 in 2002,
against R$10,054 per student enrolled in higher public education.”
“Each Real spent on public higher education is 7 times less likely to reach the poor,
as opposed to the same amount tenfold spent in secondary education.”
The decision of staying in school to reach higher educational levels generates, aside from the potential available associated benefits, direct opportunity costs. The basic criterion at the individual level is whether the increase in labor income until retirement exceeds the direct payments and opportunity costs for substituting education. In the case of public managers, we should consider the public costs and the external benefits emanating from higher education among the population. We deal here only with the relative costs of the expenses paid by the government and families in the case of private education, but in the Annex we have increased the breadth of relative evidences to diverse costs of- and benefits from education.
We now lightly examine how much Brazil spent with education in 2002—the last period for which we have data. That year, the public expenditure with education was 4.4%of the GDP (prior to the recent GDP revision). In absolute terms, the annual
public expenditure per student enrolled in basic education from 1st to 4th grade was
R$870 in 2002; per student enrolled in basic education from 5th to 8th grade, R$1,105;
Source: CPS/FGV based on POF 2003/IBGE microdata.
Aggregating the data, we find that the private expense with education within family budgets at the value of R$14.00 monthly per Brazilian in general or R$89.90 monthly per Brazilian student, leading to the annual base of R$1,078 per student.
c. Educational Premiums
“The wage of those with college-level education is 540% greater than that of
illiterates, and their probability of employment is 308% greater.”
It is obvious that educational policies should not be solely concerned with equality. It is necessary to evaluate the efficiency of the policy in transforming the lives of those who receive the educational benefit. Otherwise, a school for the poor of doubtful reputation and high cost could be chosen as the ideal, which is not the case. An impact of educational policy that we will analyze refers to the changes in labor market insertion and the general conditions of the job market. We now look at the individual returns when leaving school, given the impact of learning on the individual’s employability and wage-earning potential.
T
Taabbllee22::PPrriivvaatteeEExxppeennsseesswwiitthhEEdduuccaattiioonn--MMoonntthhllyy
Pre-School 75.78 0.82 1.08
Regular Basic Education 166.76 2.55 1.53
Regular Secondary Education 194.10 1.43 0.74
Regular Tertiary Education 324.95 5.41 1.67
Combined Grades 48.27 0.07 0.14
College Entrance Exams (Pré-Vestibular) 59.90 0.31 0.53
Technical Education 53.25 0.09 0.17
Master’s 222.03 0.42 0.19
Doctorate 138.85 0.00 0.00
Educational Textbooks-Primary & Secondary 9.14 0.36 3.91 Other educational books and
technical magazines 13.56 0.25 1.82
% BRAZILIANS WITH EXPENSE PER BRAZILIAN
R$ SPENT PER STUDENT
R$ SPENT
(R$1.97 hourly wage) for illiterates to R$1,682 (R$18.2 hourly wage) for those with a graduate degree. Similarly, the occupation rate between extremes in the educational spectrum increases from 60.7% for those who have one year of schooling to 81.5% for those who have attended graduate school. Using a standart mincerian-type regression and binomial logistic model for occupation – see annexes - to compare individuals with the same socio-demographic characteristics—such as gender, age, range and geography—except for education, the following occurs: the salaries of those with a college degree are 540% higher than that of illiterates, and their employability is 308% larger. Therefore, higher levels of education lead to better job placement. In other words, the hierarchy of educational levels mirrors labor rankings.
Table 3 – Labor Impacts on Education
in Relation to Illiterates* Highest Level
Studied
% Employed
Average
Salary R$ Hourly Wage
Probability of Employment*
%Wage Premium*
Illiterates 60.65 321.73 1.97 1 0
Basic 63.73 517.11 2.99 1.36 40.05
Secondary 68.11 767.08 4.31 2.29 125.23
Undergraduate 78.16 1681.52 10.31 3.80 318.76
Graduate 81.48 3041.1 18.22 4.08 540.42
* controlled by gender, color or race, age, migration, city size, type of sector and federal unit
Source: CPS/IBRE/FGV based on PNAD 2005/IBGE microdata.
BDS
d. Education and Health
“A greater level of education in the population impacts on diverse elements in
individuals’ lives, such as fertility, criminality, health, etc.”
“When comparing an illiterate individual with a college graduate, 95% of
perceived improvements in health are given by the pure and direct effect of
education, and not by income.”
and health, among others. In these cases, education potentially affects interest variables through the direct and indirect effect on the function of higher income. Table below shows the existent relationship between the educational attainment of the head of household and the respective per capita household average income. We take, for example, the comparison between data on self-perceived individual health conditions. Health improves according to an individual’s income and education. But what is more important, school or income? The lesson visible in graph 1 based on a standart logistic regressions found in Neri and Soares (2007) is that the health trajectory, although it corresponds to changes in income, 95% of the effect of perceived improvements in health with associated changes in education and income are given by the direct effect of education (i.e. maintaining income constant). Similar effects are observed for individuals who have had bed-rest in the past two weeks, where education corresponds to 89.4% of the obtained improvements. In other words, education seems to be a more fundamental cause for health improvements than income.
Schooling Income Less than 1 162
1 to 4 207
5 to 8 278
9 to 12 472
more than 12 1448
The positive impacts of greater education on individuals’ private returns should not justify—initially—public action in school, for if individuals perceive greater incomes as a function of greater education, then educational financing would be restricted solely by restrictions on the credit market, which would limit individuals’ investment in their own human capital. In the case of public action, it is still important to act in areas where social returns are greater than private returns, as a function of an externality. For example, when you increase an individual’s educational level, you not only improve their economic situation, their employability and wage, but also that of others. The impacts of parents’ education on their children should be captured by public policy as well as private decisions. In the appendix, we synthesize some evidence from
Source: CPS/FGV based on PNAD/IBGE Health Supplement Microdata.
Was in bed rest during the last two weeks %
2,86
1,51
2,86 2,83 2,79 2,69
2,22 2,25
1,79 1,98
2,86
2,23
1,94
1,17 1,68
0,0 0,5 1,0 1,5 2,0 2,5 3,0
Income and/or Education
Considers own Health State to be Good or Very Good %
72,57
77,59
80,81
85,82
91,33
72,57 73,1 73,93
76,11
85,12
72,57
78,06
95,79
81,87
87,93
70 75 80 85 90 95 100
Income and/or Education
the appendix, we also present international evidence that deal with more aggregate impacts in education about growth, exports, mortality and longevity.
3. Educational Motivations
“Young Brazilian students do not acknowledge that education can exert a
transformation in their lives, such as the high impact on employability and
salaries.”
We present here a discussion of some motivational aspects in education policy. It is not enough to consider intrinsic properties in education policies, such as the potential return of specific actions; it is also necessary to regard how this information reaches individuals and how they transform these into decisions. Actions diffusing information through the various levels of government and civic society are especially welcome. For example, the social literature offered conclusions some time ago on the central explanatory power of education in the high-income inequality in Brazil. Now what’s lacking is for the head of household and young student to recognize the power of transformation education exerts over their lives, such as the high impact on employability and salaries observed in the Brazilian context. We need, above all, to educate the population about the importance of education. Without the participation of those most interested, there is no sustainable educational evolution.
a. Motivations to Attend School
“45.1% of those between 15 and 17 years of age who do not attend school choose to
do so because they do not want the school available to them. These are the data to
be highlighted.”
reaching the school due to distance or access complications affect 31.3% of children form 10 to 14 years of age, and 10.9% of those between 15 and 17 years. Other residual reasons for school evasion are equally important in the two age groups, around 20%. In other words, the problem of the 15-17 age range, which should be enrolled in secondary school but isn’t, is the low demand - which explains the high evasion rate of almost 70% of cases, according to the same clientele not reached by the school.
The first demand reasons of those not attending school relate to the need for income generation, reaching 10.6% of children between 10 and 14 years old and 23% of those between 15 and 17 years old. However, supporting the rationale of extending the maximum age of educational subsidies in Bolsa Familia from 15 to 17 years, we have that: counter-factual exercises indicate that if a young afro-descendant, poor man, 17 years old, started to receive the Bolsa Familia incentives, his probability of missing school would fall from 9.3% to 4.1%. We should note the higher prevalence of other intrinsic reasons to the lack of demand for school of the type “not wanting” in the two age groups: 37.7% for 10 to 14 years old and 45.1% for 15 to 17 years old. In other words, the lack of perception of the school’s role I their lives is particularly high. This is the data to be highlighted.
V– The educational aspect of income transfer programs
N– First Job or Second Aid?
N- Bolsa-Família 2.0
The recently released PNAD’s 2005 special information technology supplement indicates that two thirds of students between 15 and 17 years old do not have access to a computer network, and the main reason attributed to the digital exclusion is the non-existence of computers or their high cost. Overall, 79% of the Brazilian population does not use the Internet, but those who use the Internet, do so for learning purposes (71.1%). The empiric literature in Brazil has not yet quantified the impact of the Internet on students’ grades, causing the face value of the potential attraction exercised by the Internet in bringing young adults to school is high. More than that, computers in school may be fundamental for MEC’s regulatory (and motivational) role with networks and
b. Ranking of the Reasons for not attending school
“Rondônia presents the highest rate 13.76% of young adults from 15 to 17 years
that do not wish to attend school, constituting the greatest reason of school evasion
at the national level.”
“Acre is highlighted for other reasons: 4.99% of young adults do not attend school
because there is no school available and 7.88% of them do not study because they
have to generate income.”
The research now provides the negative reasons given by young adults of 15 to 17 years old for not being in school. Creating a podium for these reasons, we have: Acre, leader of the states without schools, where 4.99% of young adults do not study because there is no accessible school—the local transportation conditions certainly explain the phenomenon; Acre is also highlighted in the ranking of those who do not attend school because they must work (in or outside the home) or provide income, with 7.81% against 4.11% at the national level; and Rondônia, where 13.76% of those between 15 and 17 years do not want to study anymore, consisting of the largest reason for school evasion at the national level. Data from the last PNADs have shown an increasing number of young adults of this age who neither study nor work.
RANKING: REASONS FOR NOT ATTENDING SCHOOL RANKING: REASONS FOR NOT ATTENDING SCHOOL RANKING: REASONS FOR NOT ATTENDING SCHOOL
INCOME AND LABOR (DEMAND 1) ACCESS (SUPPLY) DOES NOT WANT (DEMAND 2)
15 TO 17 YEARS 15 TO 17 YEARS 15 TO 17 YEARS
Federal Units Federal Units Federal Units
% % %
TOTAL BRAZIL 4.11 TOTAL BRAZIL 2.01 TOTAL BRAZIL 8.15
1 Acre 7.81 1 Acre 4.99 1 Rondônia 13.76
2 Paraná 6.31 2 Maranhão 4.06 2 Piauí 12.53
3 Pernambuco 5.9 3 Pará 3.17 3 Pernambuco 12.53
4 Santa Catarina 5.85 4 Roraima 3.1 4 Mato Grosso 11.73
5 Mato Grosso 5.37 5 Rio Grande do Sul 3.09 5 Mato Grosso do Sul 10.92
6 Sergipe 5.11 6 Rio Grande do Norte 2.92 6 Ceará 10.45
7 Goiás 5.11 7 Piauí 2.72 7 Pará 10.31
8 Minas Gerais 5.1 8 Rondônia 2.63 8 Tocantins 10.29
9 Mato Grosso do Sul 5.02 9 Goiás 2.55 9 Alagoas 9.81
10 Espírito Santo 4.87 10 Amapá 2.44 10 Espírito Santo 9.74
11 Rio Grande do Sul 4.71 11 Mato Grosso do Sul 2.4 11 Rio Grande do Norte 9.73
12 Rio Grande do Sul 4.36 12 Espírito Santo 2.31 12 Paraíba 9.73
13 Alagoas 4.34 13 Bahia 2.28 13 Paraná 9.28
14 Bahia 4.13 14 Pernambuco 2.22 14 Minas Gerais 9.25
15 Rio Grande do Norte 3.89 15 Mato Grosso 2.19 15 Maranhão 9.22
16 Pará 3.87 16 Minas Gerais 2.11 16 Bahia 8.88
17 Amazonas 3.59 17 Alagoas 2.05 17 Acre 7.41
18 Paraíba 3.5 18 Distrito Federal 1.8 18 Roraima 7.35
19 São Paulo 3.03 19 Sergipe 1.61 19 Distrito Federal 6.92
20 Piauí 3,00 20 Tocantins 1.59 20 Rio Grande do Sul 6.75
21 Rondônia 2.79 21 Ceará 1.5 21 Goiás 6.7
22 Rio de Janeiro 2.78 22 Paraná 1.48 22 Amazonas 6.22
23 Maranhão 2.77 23 Santa Catarina 1.42 23 São Paulo 5.72
24 Tocantins 2.11 24 Paraíba 1.36 24 Sergipe 5.64
25 Roraima 1.2 25 São Paulo 1.32 25 Amapá 5.16
26 Distrito Federal 1.05 26 Rio de Janeiro 1.23 26 Santa Catarina 4.96
In the appendix, the reader can access similar rankings for other age ranges (7 to 14, 0 to 6 and 0 to 17) and other geographical areas (metropolitan regions and macro regions). A merit of this type of data is to air the reasons of those who do not attend school:
parents and children. BDP(RJ)
c. School Race Podium
“In the Federal District, 79% of young adults between 15 and 17 years old remain
more than four hours a day in school, with a considerable distance of almost 20
percentage points form the second place. Brasilia also displays the highest grades
in the ENEM.” BDP
We present comparative rankings between the different federal units on the school attendance rate in the age groups covered by the different levels of education: from 0 to 6 years old for childhood education, 7 to 14 years in basic education, and 15 to 17 years in secondary education. We discuss here the last age range, and place further data regarding other groups in the appendix. In the age range of 15 to 17, the states that
head the education race are Rio de Janeiro BDP, leader in school attendance with 88%
RANKING: SCHOOL ATTENDANCE RANKING: SCHOOL ATTENDANCE RANKING: SCHOOL ATTENDANCE % ATTENDING SCHOOL OR DAYCARE % ATTENDING MORE THAN 4 HOURS PER DAY % ATTENDING MORE THAN 6 HOURS PER DAY
15 TO 17 YEARS 15 TO 17 YEARS 15 TO 17 YEARS
Federal Units Federal Units Federal Units
% % %
TOTAL BRAZIL 81.93 TOTAL BRAZIL 37.22 TOTAL BRAZIL 1.41
1 Rio de Janeiro 88.39 1 Distrito Federal 79.25 1 Rondônia 4.57
2 São Paulo 86.96 2 São Paulo 59.15 2 Espírito Santo 2.56
3 Distrito Federal 86.17 3 Espírito Santo 58.97 3 Rio de Janeiro 2.19
4 Amapá 84.81 4 Minas Gerais 54.27 4 Rio Grande do Sul 2.08
5 Santa Catarina 84.04 5 Rio de Janeiro 51.74 5 Mato Grosso 1.99
6 Amazonas 83.77 6 Goiás 48.83 6 Distrito Federal 1.96
7 Rio Grande do Sul 82.38 7 Amapá 40.53 7 Sergipe 1.88
8 Sergipe 82.26 8 Pará 31.96 8 São Paulo 1.65
9 Roraima 81.77 9 Mato Grosso do Sul 31.44 9 Piauí 1.63
10 Minas Gerais 81.5 10 Rio Grande do Norte 30.41 10 Paraná 1.61
11 Goiás 80.74 11 Piauí 28.87 11 Pará 1.6
12 Rio Grande do Norte 80.54 12 Bahia 26,00 12 Goiás 1.49
13 Paraíba 80.54 13 Maranhão 25.65 13 Rio Grande do Norte 1.46
14 Tocantins 80.47 14 Sergipe 25.54 14 Minas Gerais 1.31
15 Piauí 79.84 15 Paraná 24.33 15 Mato Grosso do Sul 1.09
16 Paraná 79.82 16 Pernambuco 24.21 16 Amapá 1.07
17 Bahia 79.65 17 Paraíba 23.54 17 Bahia 1.07
18 Ceará 79.51 18 Alagoas 20.77 18 Tocantins 1.06
19 Espírito Santo 79.23 19 Rio Grande do Sul 18.75 19 Santa Catarina 1.06
20 Alagoas 78.54 20 Roraima 18.59 20 Pernambuco 1,00
21 Maranhão 78.04 21 Amazonas 17.12 21 Paraíba 0.78
22 Mato Grosso do Sul 77.07 22 Ceará 14.39 22 Ceará 0.66
23 Rondônia 76.59 23 Tocantins 13.99 23 Roraima 0.6
24 Pará 75.98 24 Mato Grosso 11.53 24 Maranhão 0.37
25 Mato Grosso 75.95 25 Rondônia 9.74 25 Amazonas 0.15
26 Acre 75.83 26 Acre 9.01 26 Acre 0,00
27 Pernambuco 75.64 27 Santa Catarina 5.49 27 Alagoas 0,00
Source: CPS/FGV based on IBGE microdata. Source: CPS/FGV based on IBGE microdata. Source: CPS/FGV based on IBGE microdata.
The last table presents a ranking according to the school day length above 6 hours, which includes only 1.41% of youngsters, and even though it leads the rank, Rondônia only includes 4.57% of its students in this school day. Below is the analysis of the correlation between performance and the two criteria of school day length for those between 15 and 17 years old.
Performance ENEM x % Spends 4 hours or more
y = 0.0848x + 31.196 R2 = 0.2882
27 29 31 33 35 37 39
The graphs and regressions indicate a positive and significant relationship between the increase in the length of the school day and performance, which is more strongly present when the minimum school day lasts four hours.
d.Permanence Index5
“Rio is the leading state in the ranking of those enrolled in school, with 79% of the
population between 0 and 17 years old enrolled, but if we take into consideration
the shortest average school day (4.08 hours per day), and the largest index of
absences (2.9% of absences), Rio is surpassed by Brasilia, São Paulo, and Espírito
Santo, falling to fourth place in the national ranks. The enrolment rate effective of
hours that youngsters spend in school decreases from 79% to 62%.
School attendance in different age ranges tends to be seen as a discrete variable, separating those who miss school and those enrolled. The PNAD educational supplement offers the opportunity to explore the gray areas between these extremes, utilizing absences and length of the school day as sources. We propose a school permanence index, composed of the index of those enrolled, the index of absences and the relative difference from the length of the school day when compared to the reference
5 The permanence index is a combination of the length of time spent in school (hours per day), the
number of days attended (school attendance), and whether or not the individual is in school. It is used to
Performance ENEM x % Spends 6 hours or More
y = 1.2579x + 32.004 R2 = 0.1647
27 29 31 33 35 37 39
school day of 5 hours per day (see results in the last sub-section). In this exercise, we observe that in the age range of 0 to 17 years old, the enrolment index corresponds to 0.738 (26.2% of school evasion), that when multiplied by the attendance index of 0.957 (4.3% of school days missed) and by the difference in school day of 0.776 (3.88 expected hours per day divided by a school day length of 5 hours per day) generates an index of 0.547. In other words, if there were no absences and if the length of the school day was the proposed reference, the permanence index would be of 0.738 versus 0.547.
BDP BDS
We present here the state rankings according to this indicator. Rio is the state leading the ranking of those enrolled in school, with 79% of the population between 0 and 17 years old enrolled, but if we take into consideration the shortest average school day (4.08 hours per day), and the largest index of absences (2.9% of absences), Rio is surpassed by Brasilia, São Paulo, and Espírito Santo, falling to fourth place in the national ranks. The enrolment rate effective of hours that youngsters spend in school decreases from 79% to 62%.
1. Ranking: School Permanence
1.1.Age Range: 15 to 17 years
RANKING: SCHOOL PERMANENCE RANKING: SCHOOL PERMANENCE RANKING: SCHOOL PERMANENCE RANKING: SCHOOL PERMANENCE RANKING: SCHOOL PERM
PERMANENCE INDEX (Im*Ip*Ij) REGISTRATION INDEX (Im) SCHOOL DAY INDEX (Ij) SCHOOL ATTENDANCE INDEX (Ip) AVERAGE LENGTH OF SC
15 TO 17 YEARS 15 TO 17 YEARS 15 TO 17 YEARS 15 TO 17 YEARS 15 TO 17 YEARS
Federal Units Federal Units Federal Units Federal Units Federal Units
% % % %
TOTAL BRAZIL 0,6153 TOTAL BRAZIL 0,8193 TOTAL BRAZIL 0,7886 TOTAL BRAZIL 0,9524 TOTAL BRAZIL
1 Distrito Federal 0,8143 1 Rio de Janeiro 0,8839 1 Distrito Federal 0,9770 1 Amazonas 0,9753 1 Distrito Federal 2 São Paulo 0,7296 2 São Paulo 0,8697 2 Espírito Santo 0,9106 2 Santa Catarina 0,9726 2 Espírito Santo 3 Rio de Janeiro 0,7219 3 Distrito Federal 0,8617 3 São Paulo 0,8796 3 Sergipe 0,9693 3 São Paulo 4 Espírito Santo 0,6937 4 Amapá 0,8481 4 Minas Gerais 0,8728 4 Amapá 0,9686 4 Minas Gerais 5 Minas Gerais 0,6831 5 Santa Catarina 0,8404 5 Goiás 0,8493 5 Tocantins 0,9684 5 Goiás 6 Goiás 0,6613 6 Amazonas 0,8377 6 Rio de Janeiro 0,8441 6 Rio de Janeiro 0,9677 6 Rio de Janeiro 7 Amapá 0,6541 7 Rio Grande do Sul 0,8234 7 Amapá 0,7962 7 Distrito Federal 0,9673 7 Amapá
8 Sergipe 0,5847 8 Sergipe 0,8226 8 Pará 0,7767 8 Acre 0,9660 8 Pará
9 Rio Grande do Norte 0,5736 9 Roraima 0,8177 9 Mato Grosso do Sul 0,7688 9 Goiás 0,9643 9 Mato Grosso do Sul 10 Mato Grosso do Sul 0,5707 10 Minas Gerais 0,8151 10 Rio Grande do Norte 0,7583 10 Roraima 0,9643 10 Rio Grande do Norte 11 Piauí 0,5685 11 Goiás 0,8075 11 Piauí 0,7528 11 Mato Grosso do Sul 0,9630 11 Piauí
12 Pará 0,5662 12 Paraíba 0,8054 12 Bahia 0,7359 12 Espírito Santo 0,9615 12 Bahia 13 Amazonas 0,5576 13 Rio Grande do Norte 0,8053 13 Maranhão 0,7334 13 Minas Gerais 0,9602 13 Maranhão 14 Paraná 0,5560 14 Tocantins 0,8047 14 Sergipe 0,7333 14 Mato Grosso 0,9602 14 Sergipe 15 Paraíba 0,5554 15 Piauí 0,7983 15 Pernambuco 0,7333 15 Pará 0,9594 15 Pernambuco 16 Rio Grande do Sul 0,5537 16 Paraná 0,7982 16 Paraná 0,7300 16 Rio Grande do Sul 0,9590 16 Paraná
17 Bahia 0,5492 17 Bahia 0,7965 17 Paraíba 0,7208 17 Alagoas 0,9587 17 Paraíba
18 Roraima 0,5471 18 Ceará 0,7950 18 Alagoas 0,7058 18 Paraíba 0,9567 18 Alagoas 19 Alagoas 0,5314 19 Espírito Santo 0,7923 19 Rio Grande do Sul 0,7012 19 Paraná 0,9542 19 Rio Grande do Sul 20 Pernambuco 0,5279 20 Alagoas 0,7854 20 Roraima 0,6939 20 São Paulo 0,9537 20 Roraima 21 Tocantins 0,5259 21 Maranhão 0,7805 21 Amazonas 0,6825 21 Pernambuco 0,9518 21 Amazonas 22 Santa Catarina 0,5159 22 Mato Grosso do Sul 0,7708 22 Ceará 0,6757 22 Ceará 0,9492 22 Ceará 23 Ceará 0,5099 23 Rondônia 0,7659 23 Tocantins 0,6748 23 Piauí 0,9460 23 Tocantins 24 Mato Grosso 0,4894 24 Pará 0,7598 24 Rondônia 0,6747 24 Rio Grande do Norte 0,9394 24 Rondônia 25 Maranhão 0,4890 25 Mato Grosso 0,7594 25 Mato Grosso 0,6712 25 Rondônia 0,9390 25 Mato Grosso
26 Rondônia 0,4852 26 Acre 0,7583 26 Acre 0,6475 26 Bahia 0,9369 26 Acre
27 Acre 0,4743 27 Pernambuco 0,7564 27 Santa Catarina 0,6312 27 Maranhão 0,8544 27 Santa Catarina
Age Range: 7 to 14 years
RANKING: SCHOOL PERMANENCE RANKING: SCHOOL PERMANENCE RANKING: SCHOOL PERMANENCE RANKING: SCHOOL PERMANENCE RANKING: SCHOOL PERM
PERMANENCE INDEX (Im*Ip*Ij) REGISTRATION INDEX (Im) SCHOOL DAY INDEX (Ij) SCHOOL ATTENDANCE INDEX (Ip) AVERAGE LENGTH OF SC
7 TO 14 YEARS 7 TO 14 YEARS 7 TO 14 YEARS 7 TO 14 YEARS 7 TO 14 YEARS
Federal Units Federal Units Federal Units Federal Units Federal Units
% % % %
TOTAL BRAZIL 0,7180 TOTAL BRAZIL 0,9708 TOTAL BRAZIL 0,7702 TOTAL BRAZIL 0,9603 TOTAL BRAZIL
1 Distrito Federal 0,9320 1 Santa Catarina 0,9869 1 Distrito Federal 0,9729 1 Amazonas 0,9741 1 Distrito Federal 2 Espírito Santo 0,8650 2 São Paulo 0,9847 2 Espírito Santo 0,9184 2 Amapá 0,9734 2 Espírito Santo 3 São Paulo 0,8601 3 Distrito Federal 0,9845 3 São Paulo 0,9081 3 Rio de Janeiro 0,9724 3 São Paulo 4 Minas Gerais 0,8162 4 Rio de Janeiro 0,9805 4 Minas Gerais 0,8658 4 Tocantins 0,9702 4 Minas Gerais 5 Goiás 0,7789 5 Rio Grande do Sul 0,9789 5 Goiás 0,8306 5 Sergipe 0,9701 5 Goiás 6 Rio de Janeiro 0,7731 6 Mato Grosso do Sul 0,9779 6 Rio de Janeiro 0,8109 6 Santa Catarina 0,9701 6 Rio de Janeiro 7 Amapá 0,7115 7 Espírito Santo 0,9766 7 Amapá 0,7561 7 Roraima 0,9686 7 Amapá
8 Rio Grande do Norte 0,6930 8 Roraima 0,9753 8 Rio Grande do Norte 0,7513 8 Minas Gerais 0,9679 8 Rio Grande do Norte 9 Mato Grosso do Sul 0,6879 9 Minas Gerais 0,9740 9 Mato Grosso do Sul 0,7309 9 Goiás 0,9667 9 Mato Grosso do Sul 10 Roraima 0,6661 10 Piauí 0,9733 10 Pernambuco 0,7221 10 Acre 0,9655 10 Pernambuco 11 Paraná 0,6643 11 Paraná 0,9729 11 Paraná 0,7102 11 Rio Grande do Sul 0,9650 11 Paraná 12 Pernambuco 0,6582 12 Rio Grande do Norte 0,9719 12 Roraima 0,7051 12 Espírito Santo 0,9644 12 Roraima
13 Sergipe 0,6531 13 Ceará 0,9703 13 Piauí 0,7009 13 Alagoas 0,9636 13 Piauí
14 Piauí 0,6511 14 Goiás 0,9700 14 Sergipe 0,7007 14 Ceará 0,9624 14 Sergipe
15 Rio Grande do Sul 0,6432 15 Paraíba 0,9669 15 Bahia 0,6976 15 Mato Grosso do Sul 0,9624 15 Bahia
16 Bahia 0,6398 16 Amapá 0,9667 16 Pará 0,6950 16 São Paulo 0,9619 16 Pará
17 Paraíba 0,6335 17 Tocantins 0,9667 17 Maranhão 0,6942 17 Paraná 0,9614 17 Maranhão 18 Pará 0,6319 18 Mato Grosso 0,9616 18 Rondônia 0,6888 18 Pará 0,9611 18 Rondônia 19 Tocantins 0,6258 19 Sergipe 0,9608 19 Paraíba 0,6838 19 Mato Grosso 0,9600 19 Paraíba 20 Rondônia 0,6190 20 Maranhão 0,9578 20 Rio Grande do Sul 0,6809 20 Bahia 0,9586 20 Rio Grande do Sul 21 Alagoas 0,6183 21 Bahia 0,9567 21 Alagoas 0,6746 21 Paraíba 0,9581 21 Alagoas 22 Amazonas 0,6092 22 Pernambuco 0,9533 22 Tocantins 0,6672 22 Pernambuco 0,9562 22 Tocantins 23 Santa Catarina 0,5988 23 Amazonas 0,9532 23 Amazonas 0,6561 23 Piauí 0,9544 23 Amazonas 24 Mato Grosso 0,5979 24 Alagoas 0,9511 24 Mato Grosso 0,6477 24 Rondônia 0,9526 24 Mato Grosso 25 Ceará 0,5884 25 Pará 0,9460 25 Ceará 0,6301 25 Rio Grande do Norte 0,9491 25 Ceará 26 Maranhão 0,5861 26 Rondônia 0,9434 26 Santa Catarina 0,6255 26 Maranhão 0,8815 26 Santa Catarina 27 Acre 0,5591 27 Acre 0,9278 27 Acre 0,6241 27 Distrito Federal 0,9730 27 Acre
Age Range: 0 to 6 years
RANKING: SCHOOL PERMANENCE RANKING: SCHOOL PERMANENCE RANKING: SCHOOL PERMANENCE RANKING: SCHOOL PERMANENCE RANKING: SCHOOL PERM
PERMANENCE INDEX (Im*Ip*Ij) REGISTRATION INDEX (Im) SCHOOL DAY INDEX (Ij) SCHOOL ATTENDANCE INDEX (Ip) AVERAGE LENGTH OF SC
0 TO 6 YEARS 0 TO 6 YEARS 0 TO 6 YEARS 0 TO 6 YEARS 0 TO 6 YEARS
Federal Units Federal Units Federal Units Federal Units Federal Units
% % % %
TOTAL BRAZIL 0,2980 TOTAL BRAZIL 0,4016 TOTAL BRAZIL 0,7804 TOTAL BRAZIL 0,9508 TOTAL BRAZIL
1 São Paulo 0,3831 1 Rio Grande do Norte 0,5156 1 Distrito Federal 0,9175 1 Amazonas 0,9739 1 Distrito Federal 2 Rio de Janeiro 0,3767 2 Rio de Janeiro 0,4834 2 São Paulo 0,9006 2 Rio de Janeiro 0,9695 2 São Paulo 3 Santa Catarina 0,3568 3 Santa Catarina 0,4773 3 Paraná 0,8899 3 Sergipe 0,9678 3 Paraná 4 Distrito Federal 0,3467 4 Ceará 0,4619 4 Espírito Santo 0,8648 4 Alagoas 0,9669 4 Espírito Santo 5 Espírito Santo 0,3445 5 São Paulo 0,4483 5 Rio Grande do Sul 0,8435 5 Acre 0,9641 5 Rio Grande do Sul 6 Paraná 0,3342 6 Sergipe 0,4464 6 Mato Grosso do Sul 0,8426 6 Goiás 0,9604 6 Mato Grosso do Sul 7 Rio Grande do Norte 0,3335 7 Espírito Santo 0,4215 7 Minas Gerais 0,8386 7 Amapá 0,9601 7 Minas Gerais 8 Minas Gerais 0,3275 8 Piauí 0,4168 8 Goiás 0,8369 8 Distrito Federal 0,9596 8 Goiás 9 Sergipe 0,2911 9 Paraíba 0,4074 9 Rio de Janeiro 0,8038 9 Minas Gerais 0,9592 9 Rio de Janeiro 10 Ceará 0,2751 10 Minas Gerais 0,4072 10 Santa Catarina 0,7866 10 Rondônia 0,9587 10 Santa Catarina 11 Paraíba 0,2724 11 Pernambuco 0,3985 11 Mato Grosso 0,7396 11 Bahia 0,9520 11 Mato Grosso 12 Rio Grande do Sul 0,2596 12 Paraná 0,3961 12 Paraíba 0,7087 12 Rio Grande do Sul 0,9519 12 Paraíba
13 Mato Grosso do Sul 0,2553 13 Distrito Federal 0,3938 13 Rio Grande do Norte 0,6949 13 Tocantins 0,9510 13 Rio Grande do Norte 14 Pernambuco 0,2552 14 Bahia 0,3931 14 Roraima 0,6915 14 Mato Grosso do Sul 0,9504 14 Roraima 15 Bahia 0,2534 15 Maranhão 0,3767 15 Rondônia 0,6868 15 Santa Catarina 0,9503 15 Rondônia 16 Piauí 0,2506 16 Roraima 0,3629 16 Bahia 0,6772 16 Pernambuco 0,9490 16 Bahia 17 Goiás 0,2484 17 Alagoas 0,3517 17 Pernambuco 0,6747 17 São Paulo 0,9489 17 Pernambuco
18 Roraima 0,2333 18 Pará 0,3287 18 Sergipe 0,6739 18 Paraná 0,9481 18 Sergipe
19 Maranhão 0,2233 19 Rio Grande do Sul 0,3233 19 Pará 0,6532 19 Ceará 0,9480 19 Pará 20 Alagoas 0,2218 20 Mato Grosso do Sul 0,3188 20 Alagoas 0,6522 20 Piauí 0,9452 20 Alagoas 21 Mato Grosso 0,2092 21 Goiás 0,3090 21 Maranhão 0,6507 21 Espírito Santo 0,9452 21 Maranhão 22 Pará 0,2018 22 Mato Grosso 0,3003 22 Piauí 0,6362 22 Paraíba 0,9433 22 Piauí 23 Tocantins 0,1672 23 Acre 0,2801 23 Tocantins 0,6357 23 Mato Grosso 0,9421 23 Tocantins 24 Amazonas 0,1653 24 Tocantins 0,2766 24 Amazonas 0,6346 24 Pará 0,9401 24 Amazonas 25 Acre 0,1642 25 Amapá 0,2676 25 Ceará 0,6283 25 Rio Grande do Norte 0,9309 25 Ceará
26 Amapá 0,1608 26 Amazonas 0,2674 26 Amapá 0,6258 26 Roraima 0,9295 26 Amapá
27 Rondônia 0,1561 27 Rondônia 0,2371 27 Acre 0,6081 27 Maranhão 0,9109 27 Acre
1.2.Age Range: 0 to 17 years
RANKING: SCHOOL PERMANENCE RANKING: SCHOOL PERMANENCE RANKING: SCHOOL PERMANENCE RANKING: SCHOOL PERMANENCE RANKING: SCHOOL PERM
PERMANENCE INDEX (Im*Ip*Ij) REGISTRATION INDEX (Im) SCHOOL DAY INDEX (Ij) SCHOOL ATTENDANCE INDEX (Ip) AVERAGE LENGTH OF SC
0 TO 17 YEARS 0 TO 17 YEARS 0 TO 17 YEARS 0 TO 17 YEARS 0 TO 17 YEARS
Federal Units Federal Units Federal Units Federal Units Federal Units
% % % %
TOTAL BRAZIL 0,5478 TOTAL BRAZIL 0,7379 TOTAL BRAZIL 0,7759 TOTAL BRAZIL 0,9568 TOTAL BRAZIL
1 Distrito Federal 0,6856 1 Rio de Janeiro 0,7885 1 Distrito Federal 0,9623 1 Amazonas 0,9743 1 Distrito Federal 2 São Paulo 0,6641 2 Santa Catarina 0,7864 2 Espírito Santo 0,9060 2 Rio de Janeiro 0,9709 2 Espírito Santo 3 Espírito Santo 0,6472 3 Rio Grande do Norte 0,7721 3 São Paulo 0,9006 3 Amapá 0,9702 3 São Paulo 4 Rio de Janeiro 0,6246 4 São Paulo 0,7701 4 Minas Gerais 0,8620 4 Sergipe 0,9694 4 Minas Gerais 5 Minas Gerais 0,6211 5 Ceará 0,7577 5 Goiás 0,8354 5 Distrito Federal 0,9690 5 Goiás 6 Goiás 0,5627 6 Minas Gerais 0,7469 6 Rio de Janeiro 0,8159 6 Tocantins 0,9671 6 Rio de Janeiro 7 Rio Grande do Norte 0,5377 7 Piauí 0,7444 7 Mato Grosso do Sul 0,7558 7 Santa Catarina 0,9665 7 Mato Grosso do Sul
8 Paraná 0,5316 8 Sergipe 0,7444 8 Paraná 0,7469 8 Acre 0,9653 8 Paraná
9 Mato Grosso do Sul 0,5162 9 Espírito Santo 0,7442 9 Amapá 0,7419 9 Goiás 0,9652 9 Amapá
10 Sergipe 0,5060 10 Paraná 0,7434 10 Rio Grande do Norte 0,7388 10 Minas Gerais 0,9647 10 Rio Grande do Norte 11 Santa Catarina 0,5016 11 Distrito Federal 0,7353 11 Pernambuco 0,7142 11 Alagoas 0,9633 11 Pernambuco 12 Rio Grande do Sul 0,4958 12 Paraíba 0,7330 12 Rio Grande do Sul 0,7099 12 Rio Grande do Sul 0,9618 12 Rio Grande do Sul 13 Piauí 0,4942 13 Rio Grande do Sul 0,7262 13 Pará 0,7020 13 Mato Grosso do Sul 0,9606 13 Pará
14 Paraíba 0,4872 14 Bahia 0,7214 14 Sergipe 0,7012 14 Espírito Santo 0,9599 14 Sergipe 15 Pernambuco 0,4848 15 Pernambuco 0,7116 15 Bahia 0,7011 15 Roraima 0,9597 15 Bahia 16 Bahia 0,4820 16 Mato Grosso do Sul 0,7110 16 Roraima 0,7002 16 São Paulo 0,9575 16 Roraima 17 Roraima 0,4729 17 Maranhão 0,7101 17 Piauí 0,6982 17 Paraná 0,9575 17 Piauí 18 Amapá 0,4724 18 Roraima 0,7038 18 Paraíba 0,6961 18 Mato Grosso 0,9572 18 Paraíba
19 Ceará 0,4630 19 Goiás 0,6979 19 Maranhão 0,6931 19 Pará 0,9568 19 Maranhão
20 Pará 0,4539 20 Alagoas 0,6935 20 Rondônia 0,6856 20 Ceará 0,9567 20 Rondônia
21 Alagoas 0,4518 21 Tocantins 0,6900 21 Alagoas 0,6763 21 Paraíba 0,9548 21 Alagoas 22 Tocantins 0,4432 22 Mato Grosso 0,6876 22 Mato Grosso 0,6666 22 Pernambuco 0,9539 22 Mato Grosso 23 Mato Grosso 0,4387 23 Pará 0,6758 23 Tocantins 0,6641 23 Bahia 0,9530 23 Tocantins 24 Maranhão 0,4341 24 Amazonas 0,6606 24 Santa Catarina 0,6599 24 Piauí 0,9509 24 Santa Catarina 25 Rondônia 0,4293 25 Rondônia 0,6588 25 Amazonas 0,6577 25 Rondônia 0,9505 25 Amazonas 26 Amazonas 0,4233 26 Amapá 0,6563 26 Ceará 0,6387 26 Rio Grande do Norte 0,9427 26 Ceará
27 Acre 0,3931 27 Acre 0,6512 27 Acre 0,6253 27 Maranhão 0,8820 27 Acre
d. Education Targets
“If we know WHERE to go, we can choose HOW to get there, thus the importance
of targets. This study asks the question: WHY do we want to get there?”
We now look at the motivations of other actors in the educational process, aside from parents and their children. The creation of a system of educational targets proposed in the plan keeps the promise of motivating mayors and governors. A challenge to investing in education is that the investment’s maturation often occurs in the long term, beyond the horizon of government mandates. Another difficulty of education policy is the fact that it is predominantly geared towards the population younger than the voting age. A previous study shows the existence of political business cycles in income transfers, which grows in electoral years for those above the voting age limit. These limitations suggest the active participation of civil society such as
Compromisso Todos pela Educação and the application of targets with rewards towards the units that manage education networks through performance, as the projected plan aims to propose. It is necessary to leave behind the model with expense links and the irrelevance of academic performance in the distribution of public resources. If Bolsa Família demands academic performance from poor families, why are managers (and instructors) excused from such demands?
The National System of Basic Education Evaluation (SAEB), the Prova Brasil and ENEM may provide local information of fundamental interest for authorities to manage the learning network , as well as to mobilize society towards the educational cause. We present below an example based on the grades of the Secondary Education National Exam (ENEM).
ENEM 2006 - Top 20 Schools in the Country
(Private and Public) Average
Instituto Dom Barreto (Teresina-PI) 74.71
Colégio Vértice (São Paulo-SP) 74.15
Colégio Santo Agostinho (Rio de Janeiro-RJ) 72.36
Colégio de São Bento (Rio de Janeiro-RJ) 72.06
Colégio Santo Agostinho (Novo Leblon-RJ) 71.79
Colégio Bandeirantes (São Paulo-SP) 70.89
Colégio Helyos (Feira de Santana-BA) 70.58
Colégio WR (Goiânia-GO) 70.57
Colégio Bernoulli (Belo Horizonte-MG) 70.47
Colégio Santo Inácio (Rio de Janeiro-RJ) 70.29
Colégio Loyola (Belo Horizonte-MG) 70.23
Colégio Santo Antônio (Belo Horizonte-MG) 70.09
Escola Ipiranga (Petrópolis-RJ) 70
Colégio Aplicação da UFPE (Recife-PE) 70
Colégio União (Três Corações-MG) 69.81
Colégio Anchieta (Nova Friburgo-RJ) 69.46
Colégio Engenheiro Juarez de Siqueira Britto
Wande (São José dos Campos-SP) 69.34
Colégio Equipe (Recife-PE) 69.27
Universidade Tecnológica Federal do Paraná
(Curitiba-PR) 69.26
Source: INEP/MEC 2006
Education Targets and Social Credit
V – Targets and Education Pact
T – Design for a System of Social Targets
T – Dynamic Aspects of a System of Social Targets
V – Creso Franco’s Presentation – Director, Dept of Education, PUC-RJ
Managers, researchers and social area observers search for available empirical evidence to reach a new generation of public policies. A type of Holy Grail, which is never reached, but whose search leads to new conquests. The theme to be discussed here is neither the definition nor the choice of a set of educational targets, but the possibilities of what we can (and should not) do with them, once established.
A characteristic of the Brazilian basic educational system is the increasing decentralization of federal expenditure. The decentralization of the Brazilian educational system, and of the health system, was propelled by the 1988 Constitution, and it has become more and more present in the income transfer policies, such as the Bolsa Familia, since the creation of the poverty eradication fund by the National Congress in 2000. Decentralization is fundamental for financing social actions where they are more needed and where resources are scarcer.
to the municipality, the agent who implements the social actions. A similar situation is found in the relationship of the states’ federal governments.
In light of the Brazilian size and heterogeneity, it is impossible to observe from Brasilia the specific needs of every corner in the country. The federal government has less information than the local government about the students’ needs. Therefore it is understandable that the municipal and state governments be responsible for implementing education actions in each location. The federal government should establish partnerships with the municipalities or states, transferring resources and monitoring the attained results. Usually, however, the State only assesses the proper use of resources, according to constitutional mandates. The most important analysis, i.e. the achievement of social results , tends not to be carried out. What we verify, in the best of situations, is whether the funds were employed according to the law.
Based on the model in Neri and Xerez (2003), we analyze the impact of three types of institutional environments on the behavior of municipalities. In the first place, the transfer of fixed federal funds, or unconditional. In this case, there is the displacement of educational investments carried out by the locality, similar to the crowding-out effect found in macroeconomic textbooks. In this case, the social targets of the local power are defined by the central power. As we see, it is necessary to stimulate a relationship of complementation, not of substitution, of the actions between various levels of government.
In a second situation, called repeated focus, transfers have always privileged the municipalities with the poorest education. The result obtained by the managers at these locations is worse than in the absence of additional federal transfers. We introduce a perverse incentive for local governments to maintain a group of delays and the poor quality of the educational system, so as to justify access to new resources in the future. This point does not refer to the recent Brazilian debate of whether it is desirable or not to focus social expenses, but about the better way in which to do so. The basic critique to repeated focus at the level of indicators is not that the indicators are not correct, but that they are wrong. In this case, as more money is destined towards the poorest, the less money reaches the poorest. It is necessary to avoid the vicious cycle whereby, the worst the administration, the better the budget received.
established between the federal government and the municipality is somewhat similar to a services contract. In a realistic situation, first the municipality receives the money,
then social performance in verified. It can be regarded as a Social Credit for the
municipality to carry out certain advances drawn out in the contract. Following this, if the established targets are fulfilled, credit payment is withdrawn. If the targets are not fulfilled in a satisfactory manner, the limit of credit established by the federal government for the municipality is compromised.
This type of contract is already carried out between government and citizens in programs such as bolsa-escola and bolsa-familia. By adding a similar contract between governments, the system of conditional transfer distribution would become more consistent throughout time in its different levels, resulting in the flow of resources towards greater social returns. It is worthwhile remembering that the evaluation of outcomes is one of the few moments when the poorest may outperform the others. For example, municipalities where half the children attend school can double the indicator, as opposed to one where 90% are already in school. Now this potential has to be fulfilled.
The main problem with the implementation of social credit schemes relates to the presence of shocks. The result obtained by the social protagonist depends on factors beyond their reach, since the result does not solely depend on their efforts and ability of implementation. As in the case of idiosyncratic shocks such as droughts, floods, and tsunamis, it is fundamental to create social security mechanisms. In the case of aggregate shocks, such as a recession, due to their systemic non-insurable nature, it is fundamental to use schemes of relative evaluation. The creation of a system amenable to international comparisons, such as the MDGs or the educational targets of Dakar, allows us to place each country within international norms. The system of incentives should be announced a priori and relative performance should be evaluated a posteriori. Everything works as a credit system where social projects’ financial debt should be reduced in view of social advances. The advantage of a social credit instrument is, if well developed, to attract better social actors and induce them to engage in better practices.
However, it is important to regard social politics through the monitoring of the social budget, not only to verify whether they are really employed in the pre-established areas, but also to evaluate the improvement in the population’s situation. It is necessary to go beyond the analysis of accounts. It is not enough to know how much was invested; the measure of the result reached should be known, so as to open up the channels of public resources to the educational sphere in order to reach areas that offer the highest returns to society.
There is no doubt that the core of social action should be the poorest. Nonetheless, those that relocate themselves to meet their needs should be particularly rewarded, for they will not need (public) resources in the future. Future success should be rewarded, as opposed to solely rewarding past losses. Social credit mechanisms may be perceived as a conversion process of educational debt into monetary resources so as to create virtuous solution cycles for educational needs. We take the amount of resources necessary to meet educational needs as a measure of social debt of a given locality in a determined period of time. Each locality would have access to a cash flow when social indicators show that it is decreasing its respective social debt. In general, you can think that efficiency is not a comparative advantage in a poor society. However, one of the few —perhaps the only — advantagesin being poor is the relative capacity to prosper. For example, if 50% of the children are not going to school, the community can double the initial figure, while if the baseline data is 100% of children in school, there is no space for improvements. In the case of social credit, equality and efficiency walk hand in hand.
Many social programs are based on the transfer of federal government funds to states and municipalities with needy regions. Obviously, the expenditure in the regions results in the improvement of the local population’s living conditions. However, what generally is not evaluated is whether the final result reached could have been better.
CONCLUSIONS
If we were to synthesize the main elements pursued nowadays in the design of innovation in social interventions—that is, what is IN in public policies—we would say:
incentives, information and infancy.6 Nations and parents who care for their children,
since their most tender age, guarantee their future. In other words, it ends being more productive from the social point of view (as well as the fiscal one) to prevent rather than remediate, by investing in education. Education constitutes the true cost of social opportunity—whatever the alternative to investment with a highest social return may be.
Annex:
As we have seen, educational policies should not be guided solely on grounds of equality, the policy’s efficiency in transforming the lives of those who receive its benefits should also be considered, as well as the labor change (and at what cost). In the case of public action, it is important still to act in areas where the social returns are greater than the private or individual’s, in function of externalities and the general transmission of education. We begin with international evidences that deal with aggregate impacts on education about growth, exports, mortality and longevity, among others.
a. School Externalities
The private decision regarding education does not include the impact that greater education of each individual may have on the learning ability not only of descendants, but that of other families, which would justify public action in addition to private. For example, Ricardo Paes de Barros has demonstrated that the average education of mothers in a given community has a strong explanatory power over the academic performance of children, even when controlled by the child’s respective mother’s educational level. In broader terms, Jere Berhman from the IDB shows that for each additional year of study, life expectancy increases two years, population growth decreases 0.26 percentage points (p.p.), exports increase 0.7 p.p. and per capita income growth increases 0.35 p.p. It is difficult to imagine investment, social or private, more rewarding than a child moving to the next grade.
b. Educational Mobility
Brazil (68%) when compared to that of the United States (30%). The degree of intergenerational mobility in education in Brazil is less than that observed in developed countries or in developing countries, with the exception of Colombia (70%). Another conclusion of the research shows that the education of parents has an important role in determining their children’s educational level. When the father has not completed one year of study, the child has 33.85% chance of remaining without education. For the children of parents with higher education, this percentage decreases to less than 1%, having the higher probability of repeating the performance of the previous generation (60.02%) as per Table 4.
Table 4
Probability of Child’s Schooling Versus Parents (%)
Child
Father
No Schooling
Primary Education
Basic Education
Secondary Education
Higher Education
No
Schooling 33.85 18.49 5.65 4.20 1.08
Primary
Education 2.78 15.67 15.15 22.00 11.59
Basic
Education 1.38 4.07 13.71 28.78 24.44
Secondary
Education 0.37 1.76 6.48 32.56 35.8
Higher
Education 0.75 0.90 3.77 16.19 60.02
Source: Velloso and Ferreira (2003) based on PNAD 1996/IBGE
c. Education and Marriage
We present below the educational diversity of marriages by studying the combination of determined characteristics such as religion, race, and age.
Education (Categories of Completed Years of Study):
Source: CPS/IBRE/FGV based on Census 1970 and 2000/IBGE microdata.
In 2000, 49.6% of marriages occurred among the same educational groups, against 56.7% in 1970. Aside from the better educational diversity that may be beneficial to educational equality (and that of income) of the next generations of society given as a whole. It is worthwhile to mention that there has also been an improvement in educational levels, for example, the mode (most frequent value) among all education combinations between head of households and spouses changed from people with no education in 1970 to couples that coincide in the range of 4-7 years of completed education in 2000.
d. Education and Proficiency
Aside from labor and health impacts, a central aspect of educational impact
1970
No education 1 to 3 4 to 7 8 to 11 12 or
more
Total Spouses
No education 28,25 11,20 4,19 0,54 0,42 44,58
1 to 3 6,63 13,70 5,34 0,62 0,36 26,65
4 to 7 2,54 4,63 10,76 1,94 1,24 21,12
8 to 11 0,29 0,39 1,00 1,05 1,14 3,87
12 or more 0,23 0,28 0,76 0,62 1,90 3,78
Total Heads 37,93 30,20 22,05 4,76 5,06 100,00
Obs: Without missing
Head
Spouse
2000
No education 1 to 3 4 to 7 8 to 11 12 or more
Total of Spouses
No education 6,42 2,98 2,14 0,48 0,04 12,05
1 to 3 3,67 6,98 5,47 1,56 0,11 17,79
4 to 7 2,72 6,45 16,46 7,04 0,57 33,25
8 to 11 0,61 2,00 7,69 15,32 3,59 29,22
12 or more 0,03 0,13 0,61 2,48 4,45 7,70
Total of Heads 13,45 18,54 32,38 26,87 8,75 100,00
Spouse
learning at each grade. This is fundamental, but presents some measurement problems to be dealt with. A problem in this approach in Brazil is the evaluation systems for those who are in school in certain specific grades. If, for example, children are in school because of programs like bolsa-escola or bolsa-familia; or whether they reach to day, with more frequencythe fourth grade as a result of automatic progression, independent of virtues and flaws in these policies, an inter-temporal comparison of proficiency is harmed. Some studies demonstrate that the strong decrease in quality of teaching in Brazil observed since 1995 may be negatively biased in favor of those who were previously excluded from the educational evaluation system, not allowing us to perform specific analyses of the theme. We are now capturing the proficiency of individuals who previously were not being evaluated.
Another limitation in this method of evaluating the quality of teaching only through student proficiency is the disregard about the usefulness of certain knowledge in practical terms. This involves subjective elements, such as citizenship values and practices. Another impact of educational policy already being analyzed refers to the changes in the labor market insertion and the job market’s general conditions. We also consider the individual’s return when leaving the education system, and the learning
impact on the individual’s ability to be employed and his/her associated salary. T S
e. Return Rate of Education
The Brazilian return rate to education is extremely high, which should be an
enormous incentive for the accumulation of human capital.7 A study by Fernando de
Holanda Barbosa Filho and Samuel Pessoal (2006), based on the PNAD 2004,
calculated the internal rate of return to education8 from investments in the country’s
education, and signaled that i) investment in education in Brazil is extremely attractive, offering high rates of return; ii) the return rate of pre-school is superior to 17%; iii) that of secondary education is of 14% and iv) that of higher education was over 18%. However, according to Neri, the rate of return (which is relevant to the student) is not the rate observed a posteriori, but the rate a priori, which includes the probability of grade repetition. This means that, in truth, if the repetition rate is 22%, for example, as it
7 The average income of someone with no education is of R$138 while that of someone with an undergraduate degree
was in 2004, the relevant rate of return ends up being 12% and not 16%. Aside from this, the probability of finding a job increases with education. There is, therefore, a poverty trap where, in order to obtain higher returns, an individual must first invest,
facing lower returns and higher risks. P
f. Plan for Development of Education
The “Educational PAC” announced by the Federal Government in March 2007 places education at the core of the debate and public action through eleven central points, prioritizing: teachers through the creation of national wage base (1) and access to the so-called Universidade Aberta do Brasil for professional improvement (2); schools
through digital infra-structure (3) and access to electric energy and transportation P
(4); school materials through its gratuitous distribution to all grades (5) and students, be they adults through the redefinition of the program Brasil Alfabetizado (6), be they children through the performance analysis of Provinha Brasil to correct deficiencies
soon after alphabetization (7) and the Pro-Infancy program S (8). Two other points in
the new proposal are: widening the age range from 15 to 17 for those who benefit from the conditionalities of Bolsa-Familia (9). Lastly, and perhaps most challenging, conditioning the transfer of resources from the federal government to states and municipalities to performance targets (10) through the creation of the Educational
Development Index based on the School Census and Prova Brasil at the school level S
(11). The objective is not to discuss the merit of each of these points vis-à-vis the challenges and educational needs of the country. This is a broad and complex theme,