Campus de Botucatu
Instituto de Biociências
PG-BGA
AVALIAÇÃO DA PARTICIPAÇÃO DOS ÁCIDOS GRAXOS NAS
ADAPTAÇÕES DAS ILHOTAS PANCREÁTICAS À
RESISTÊNCIA PERIFÉRICA À INSULINA PELO TRATAMENTO
COM DEXAMETASONA
MAIARA DESTRO
Dissertação apresentada ao Instituto de Biociências, Campus de Botucatu, UNESP, para obtenção do título de Mestre no Programa de Pós-Graduação em Biologia Geral e Aplicada, Área de concentração em Biologia Celular Estrutural e Funcional.
Orientador: Prof. Dr. José Roberto Bosqueiro
Campus de Botucatu
Instituto de Biociências
PG-BGA
UNIVERSIDADE ESTADUAL PAULISTA
“Júlio de Mesquita Filho”
INSTITUTO DE BIOCIÊNCIAS DE BOTUCATU
AVALIAÇÃO DA PARTICIPAÇÃO DOS ÁCIDOS GRAXOS NAS
ADAPTAÇÕES DAS ILHOTAS PANCREÁTICAS À
RESISTÊNCIA PERIFÉRICA À INSULINA PELO TRATAMENTO
COM DEXAMETASONA
MAIARA DESTRO
Prof. Dr. JOSÉ ROBERTO BOSQUEIRO
Dissertação apresentada ao Instituto de Biociências, Campus de Botucatu, UNESP, para obtenção do título de Mestre no Programa de Pós-Graduação em Biologia Geral e Aplicada, Área de concentração Biologia Celular Estrutural e Funcional.
Orientador: Prof. Dr. José Roberto Bosqueiro
FICHA CATALOGRÁFICA ELABORADA PELA SEÇÃO TÉC. AQUIS. TRATAMENTO DA INFORM. DIVISÃO DE BIBLIOTECA E DOCUMENTAÇÃO - CAMPUS DE BOTUCATU - UNESP
BIBLIOTECÁRIA RESPONSÁVEL: ROSEMEIRE APARECIDA VICENTE
Destro, Maiara.
Avaliação da participação dos ácidos graxos nas adaptações das ilhotas pancreáticas à resistência periférica à insulina pelo tratamento com Dexametasona / Maiara Destro. - Botucatu, 2011
Dissertação (mestrado) – Universidade Estadual Paulista, Instituto de Biociências de Botucatu
Orientador: José Roberto Bosqueiro Capes: 20702000
1. Insulina. 2. Ácidos graxos. 3. Langerhans, Ilhotas de.
Banca Examinadora
Prof. Dr. José Roberto Bosqueiro (Orientador)
Profa. Dra. Margarida Juri Saeki
Dedicatória
Às pessoas que mais me amam neste mundo:
Meus pais, José Valentim Destro e
Agradecimentos
Nesses dois anos, várias pessoas estiveram ao meu lado me apoiando e ajudando, seja por uma
palavra de incentivo, oração ou mesmo por um abraço ou sorriso que no meu dia-a-dia me fizeram ter garra
para vencer os contratempos e finalizar este trabalho. Aqui eu cito apenas algumas destas pessoas, no
entanto, agradeço a todos que direta ou indiretamente contribuíram neste trabalho. Peço a Deus que
recompense cada um por todo o carinho e gratidão.
Assim, agradeço primeiramente a Deus “porque Deus é o que opera em vós tanto o querer como o
efetuar, segundo a sua boa vontade.” (Filipenses 2:13-15).
A toda minha família, em especial aos meus pais, minha irmã Raquel Destro e ao meu sobrinho Caio
Andrade Destro pelo amor, apoio e compreensão.
Ao Prof. Dr. José Roberto Bosqueiro por confiar a mim esse trabalho me proporcionando o sonho de
ingressar na carreira acadêmica, por toda a paciência na orientação e os conselhos que levarei para minha
vida.
Aos meus amigos integrantes e ex-integrante do Laboratório de Fisiologia do Pâncreas Endócrino,
Letícia Pontes, Maitê Costa, Mariana Poiato, Natália Violato, Nathalia Camaforte Henriques, Poliana
Teixeira, Priscilla Ponce e Ricardo Judice, pela ajuda nos experimentos, companheirismo e por todos os
momentos de risadas, cantorias e pausas para o café.
As minhas “flores”, Ana Paula Querubim, Angélica Lino Rodrigues, Caroline Destro, Daniele T. Basseto, Egláia de Carvalho e Talita Amador, onde a conquista de uma é a conquista de todas. Obrigada
pela amizade fiel.
As minhas primas Michele Baldi, Natália Putti e ao meu primo Leonardo Aguiar por estarem
sempre ao meu lado torcendo pelas minhas conquistas.
Aos meus amigos, Araken de Almeida, Lucas Baldin e Otavio Beltrame por todo carinho e
preocupação comigo.
Aos pastores Eliéser D´Ávila e Silmara D´Ávila, aos meus amigos Nathalia Camaforte Henriques e
Diego Henriques e todos os integrantes da célula Aba Pai pelo carinho e oração intercedendo à realização
deste trabalho.
Ao programa de Pós-Graduação em Biologia Geral e Aplicada, UNESP de Botucatu, pela
oportunidade e empenho na melhoria do programa.
Aos professores que participaram da minha banca de qualificação e defesa da dissertação pela
disponibilidade.
Epígrafe
“Confia no senhor d
e todo seu coração e não se
estribes no teu próprio entendimento. Reconhece-o
em todos os teus caminhos, e ele endireitará as
tuas veredas.”
Sumário
RESUMO ... 10
ABSTRACT ... 11
INTRODUÇÃO ... 12
1. Secreção de insulina ... 12
2. Efeitos dos ácidos graxos sobre a secreção de insulina ... 13
3. Resistência à insulina ... 15
4. Glicocorticóides ... 17
5. Receptor ativado por proliferador de peroxissoma... 19
JUSTIFICATIVA ... 21
OBJETIVOS ... 22
RESULTADOS ... 23
CONCLUSÃO ... 60
Lista de abreviaturas
AC - adenilato ciclase
AGL - ácidos graxos livres
AMPc - adenosina monofosfato cíclico
ATP - adenosina trifosfato
Ca2+ - íon cálcio
CPT-1 - carnitina-palmitoiltransferase-1
DAG - diacilglicerol
DM - diabetes mellitus
GLUT-2 - proteína transportadora de glicose 2
GPR40 - receptor acoplado à proteína G
HDL - lipoproteína de alta densidade
IP3 - inositol 1,4,5-trifosfato
K-ATP - canais de potássio sensíveis a ATP
LC-CoA - acil-CoA de cadeia longa
NAD(H)P - adenina dinucleotídeo fosfato
PKA - proteína quinase A
PKC - proteína quinase C
PLC - fosfolipase C
PPAR - receptores ativados por proliferador de peroxissoma
RI - resistência à insulina
SIEG - secreção de insulina estimulada por glicose
Resumo
O aumento da secreção de insulina estimulada por glicose é um mecanismo adaptativo
observado nas ilhotas pancreáticas de animais resistentes à insulina. Estudos relatam que os
ácidos graxos livres estimulam a secreção de insulina através da ativação do GPR40. Diante
destes fatos, investigamos a secreção de insulina, a expressão de proteínas da via do GPR40
nas células ß e a participação dos lipídios na resistência à insulina induzida por dexametasona,
através do tratamento com o redutor de lipídios bezafibrato. Os grupos receberam gavagem
uma vez ao dia durante 28 dias: Controle (CTL) e DEXA com goma arábica 5% (1 ml/kg,
peso corpóreo); BEZA e BEZA-DEXA com bezafibrato (300 mg/kg, p.c.). Nos últimos 5 dias
de tratamento os grupos receberam injeções intraperitoniais: CTL e BEZA de solução salina
(1 ml/kg, p.c.); DEXA e BEZA-DEXA de dexametasona (Decadron® 1,0 mg/kg, p.c). A
secreção de insulina estimulada por glicose aumentou nos grupos BEZA e DEXA.
BEZA-DEXA exibiu diminuição dos níveis de ácidos graxos livres, triglicérides e de insulina, mas
não houve elevação dos níveis de glicose no sangue. Além disso, houve melhora na
resistência à insulina e restauração do padrão de secreção de insulina, em comparação ao
grupo DEXA. Nas ilhotas dos animais BEZA-DEXA a expressão das proteínas GPR40,
PLCß1 e PKC foi significativamente maior em relação aos valores obtidos em DEXA. Esta
via permaneceu inalterada nas ilhotas de DEXA e BEZA. Em conclusão, o tratamento com
bezafibrato melhorou a função das células ß e impediu a indução de resistência à insulina pelo
tratamento com dexametasona, mas os mecanismos não são conhecidos. O aumento na
secreção de insulina em DEXA aparentemente não está relacionado com a ativação do
GPR40. Contrariando a literatura, apesar da redução na secreção de insulina, as ilhotas dos
animais BEZA-DEXA apresentaram ativação da via do GPR40.
Palavras-chave: Ácidos graxos, glicocorticoides, secreção de insulina, ilhotas pancreáticas,
Abstract
Increased glucose-stimulated insulin secretion is an adaptive mechanism exhibited by
pancreatic islets from insulin resistant animal. Studies report that the free fatty acids stimulate
the insulin secretion via GPR40. As such, we investigate the expression of GPR40 in ß-cells
and the involvement of lipids in dexamethasone-induced IR, by lipid-lowering therapy with
bezafibrate. Groups received once daily gavage for 28 days: Control (CTL) and DEXA
with gum Arabic 5% (1.0 mg/kg, body weight); BEZA and BEZA-DEXA with bezafibrate
(300 mg/kg, b.w.). In the last 5 days of the treatment groups received intraperitoneal
injections: CTL and BEZA of saline (1.0 mg/kg, b.w.); DEXA and BEZA-DEXA
of dexamethasone (Decadron® 1.0 mg/kg, b.w.). The glucose-stimulated insulin secretion
increased in the DEXA and BEZA groups. BEZA-DEXA shows decrease in fatty acids,
triglycerides and insulin levels, but not raised blood glucose levels. In addition, there was
improved in insulin resistance and restoration the insulin secretory pattern, when compared to
DEXA group. In BEZA-DEXA islets, GPR40, PLCß1 and PKC protein content was
significantly higher than DEXA. This pathway remained unchanged in DEXA and BEZA
islets. In conclusion, bezafibrate treatment improved ß-cell function and prevented
dexamethasone-induced IR, but the mechanisms are not known. Augmented insulin secretion
in DEXA appears to be unrelated to the activation of the GPR40. Contrary to the literature,
despite the reduction in insulin secretion, BEZA-DEXA islets showed activation of the
GPR40 pathway.
Introdução
1. Secreção de insulina
A insulina é o hormônio polipeptídio anabólico mais conhecido e essencial para a
manutenção da homeostase da glicose, além de promover crescimento e diferenciação celular
(Carvalheira et al., 2002). Esse hormônio é secretado pelas células das ilhotas pancreáticas
em resposta ao aumento dos níveis circulantes de glicose, aminoácidos e ácidos graxos
(Prentki et al., 1997) após as refeições. A distribuição eficiente desses nutrientes nos tecidos
periféricos (fígado, músculo e tecido adiposo) é coordenada pela ação antagônica da insulina
e do glucagon, um hormônio secretado pelas células α das ilhotas pancreáticas (Jiang &
Zhang, 2003). A insulina aumenta a captação periférica de glicose, reduz a produção hepática
da mesma via diminuição da gliconeogênese e glicogenólise, além de estimular a lipogênese e
a síntese proteica (Carvalheira et al., 2002). Em baixas concentrações de glicose, o glucagon
disponibiliza os substratos energéticos via glicogenólise, gliconeogênese e lipólise sem,
contudo, interferir no metabolismo muscular (Jiang & Zhang, 2003).
A glicose é o principal agente estimulador da secreção de insulina (figura 1), que
reponde rapidamente ao aumento das suas concentrações (Carvalheira et al., 2002). Esse
açúcar é transportado para interior da célula pela proteína transportadora de glicose 2
(GLUT-2). Sua metabolização eleva os níveis de adenosina trifosfato (ATP) que age fechando
os canais de potássio sensíveis a ATP (K-ATP). A diminuição do efluxo de potássio tem
como consequência a despolarização da membrana e abertura dos canais de cálcio (Ca2+) sensíveis à voltagem. O influxo de Ca2+ e o aumento da concentração de Ca2+ intracelular ativa a maquinaria de exocitose, resultando na secreção dos grânulos de insulina
(Matschinsky, 1996).
Um efeito secundário da estimulação das células pela glicose é a ativação da
fosfolipase C (PLC), que hidrolisa os fosfolipídios da membrana plasmática gerando
diacilglicerol (DAG) e inositol 1, 4, 5-trifosfato (IP3) (Zawalich & Zawalich, 1996). O IP3
promove a ativação dos canais de Ca2+ localizados na membrana do reticulo endoplasmático, e o DAG atua sobre os canais de Ca2+ sensíveis à voltagem da membrana. Além disso, DAG também ativa a proteína quinase C (PKC), a responsável por estimular a exocitose dos
grânulos secretórios de insulina, e ativa a enzima adenilato ciclase (AC). A ativação da AC
aumenta o conteúdo intracelular de adenosina monofosfato cíclico (AMPc), que por sua vez,
fosforilação do canal de Ca2+ sensível à voltagem, permitindo a entrada do íon na célula (Flatt, 1996).
Figura 1. Principais eventos envolvidos na secreção de insulina estimulada por glicose. GLUT-2 = transportador de glicose do tipo 2; ATP = adenosina trifosfato; PLC = fosfolipase C; PLA2 = fosfolipase A2; FL = fosfolipídios; AA = ácido araquidônico, RE = retículo endoplasmático, PKA = proteína quinase A; PKC = proteína quinase C; DAG = diacilglicerol; IP3 = inositol trifosfato; AMPc = adenosina monofosfato cíclico; (+) estimula; (-) inibe. Fonte: Curi et al. (2002).
2. Efeitos dos ácidos graxos sobre a secreção de insulina
Os ácidos graxos são necessários para o funcionamento normal das células
pancreáticas (Prentki et al., 2002; McGarry et al., 2003; Nolan et al., 2006a). Eles
potencializam a secreção de insulina estimulada por glicose (SIEG) de maneira
tempo-dependente e de acordo com o tamanho da cadeia e o grau de insaturação do ácido graxo
(Stein et al., 1996). A exposição aguda a ácidos graxos livres (AGL) resulta no aumento da
secreção de insulina estimulada por glicose. Porém, em exposição crônica aos AGL e
particularmente em associação com glicose elevada ocorre redução da secreção de insulina
(El-Assad et al., 2003), apoiando a hipótese de glicolipotoxicidade citado por Prentki e
colaboradores (2002).
Nas células pancreáticas os AGL do citoplasma são convertidos a acil-CoA pela
enzima acil-CoA sintetase. Em condições basais, a molécula de acil-CoA de cadeia longa
(LC-CoA) é transportada para a mitocôndria via carnitina-transferase-1, onde é oxidada.
Contudo, na presença de concentrações elevadas de glicose (figura 2), o citrato, um produto
citoplasma onde é transformado em malonil-CoA pelas enzimas citratase e acetil-CoA
carboxilase. Malonil-CoA inibe principalmente a carnitina-palmitoiltransferase-1 (CPT-1), o
que permite o acúmulo de LC-CoA no citoplasma. Moléculas de LC-CoA posteriormente
podem ser esterificadas com glicerol-3-fosfato para formar lipídios complexos como
triglicerídeos, diacilglicerol, fosfolípidios e o ácido fosfatídico (Prentki & Corkey, 1996;
McGarry & Brown, 1997). Os lipídios complexos formados fornecem fatores de sinalização
que potencializam a secreção de insulina (Ramanadham et al., 1999). Os produtos de
esterificação nas células pancreáticas, tais como os triglicerídeos, podem ainda sofrer
lipólise fornecendo AGL pela ação da lipase hormônio sensível, um papel também importante
no estímulo na secreção de insulina (Roduit et al., 2001).
Figura 2. Efeitos da glicose no metabolismo dos lipídios na célula ß. FA = ácido graxo; CPT-1 = carnitina-palmitoiltransferase-1; LC-CoA = acil-Coa de cadeia longa; PA = ácido fosfatídico; DG = diacilglicerol; TG = triglicerídeos; PL = fosfolipídios. Fonte: Poitout et al. (2010).
O aumento do pool citossólico de LC-CoA, diacilglicerol e ácido fosfatídico
aumentam diretamente a exocitose dos grânulos de insulina por estimularem a liberação de
Ca2+ do retículo endoplasmático (Yaney et al., 2000), modificarem o estado de acilação de proteínas chaves que regulam a atividade dos canais iônicos e da exocitose (Bouvieral et al.,
1995), e também por modularem diretamente a atividade de enzimas como a PKC. Estudos
demonstraram que a expressão PKC é regulada pelo LC-CoA (Yaney et al., 2000). Em adição, há evidências que esta isoforma regula a proliferação das células (Vasavada et al.,
2007).
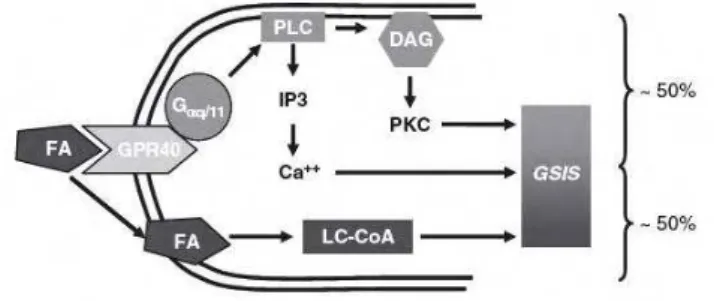
Além dos sinais lipídicos formados no metabolismo intracelular, estudos realizados
por Itoh et al. (2003) levantaram a hipótese de que a ativação do receptor de AGL altamente
secreção de insulina estimulada por glicose (SIEG) (figura 3). Em ilhotas de camundongos
knockout para GPR40 é observada uma redução de 50% da SIEG (Latour et al., 2007).
Ainda é pouco esclarecido na literatura o mecanismo de ativação do GRP40. Contudo,
estudos demonstraram que a ligação do ácido graxo ao receptor estimula a secreção de
insulina pela ativação da PLC, que gera DAG e IP3, os responsáveis por induzir a liberação
de Ca2+ e ativar isoformas de PKC, respectivamente. A ativação do GPR40 também age na proliferação celular (Gromada, 2008) e na regulação dos canais K-ATP (Feng et al., 2006).
Figura 3. Metabolismo intracelular dos ácidos graxos e os sinais mediados pelo GPR40 que potencializam a secreção de insulina na célula ß. FA = ácido graxo; GPR40 = receptor acoplado à proteína G 40; PLC = fosfolipase C; IP3 = inosito trifosfato; DAG = diacilglicerol; PKC = proteína quinase C; GSIS = secreção de insulina estimulada por glicose; LC-CoA= acil-Coa de cadeia longa. Fonte: Kebede et al. (2009).
3. Resistência à insulina
A resistência à insulina (RI) caracteriza-se pela redução da capacidade dos tecidos
sensíveis à insulina de regularem a homeostase da glicose em níveis normais do hormônio. As
principais características da RI são o aumento da lipólise no tecido adiposo, aumento da
gliconeogênese no fígado e diminuição da captação de glicose pelo músculo. As células ,
frente às concentrações crescentes de glicose impostas pela RI, desenvolvem mecanismos
compensatórios, dentre os quais estão a hiperinsulinemia, para manter os níveis normais de
glicemia no sangue (Cefalu, 2001) e, dependendo do grau de RI, ocorre em conjunto com
hipertrofia das ilhotas pancreáticas e aumento da proliferação das células , fato que também
auxilia na homeostase da glicose (Rafacho et al., 2008a; Rafacho et al., 2009). Após estas
adaptações, ocorre nas células pancreáticas uma progressiva deterioração da sua função
associada à perda de massa celular devido a apoptose, o que as tornam incapazes de secretar
quantidades adequadas do hormônio. Instala-se assim, o quadro de diabetes mellitus tipo 2
Figura 4. Disfunção da célula ß e o desenvolvimento do diabetes mellitus tipo 2. NGT = não tolerante à glicose; IGT = intolerante à glicose; T2D = diabetes mellitus tipo 2. Fonte: Prentki & Nolan (2006).
O diabetes mellitus é uma doença metabólica com alterações no metabolismo de
carboidratos, lipídeos e proteínas, decorrentes de defeitos na secreção e ação de insulina
(AMERICAN DIABETES ASSOCIATION, 2006). Nas últimas décadas é visto um aumento
dramático na incidência e prevalência do diabetes no mundo. A Federação International de
Diabetes estimou em 2010 cerca de 285 milhões de pessoas diabéticas em todo o mundo,
representando 6,6% da população. Este número deve chegar a 438 milhões em 2030, ou 7,3%
dos adultos do mundo (INTERNACIONAL DIABETES FEDERATION, 2009). Entre os
tipos de diabetes, o DM tipo 2 corresponde a mais de 90% dos casos e estabelece-se pela
combinação de predisposição genética associada ao sedentarismo e à obesidade (Reaven,
1988). O DM tipo 2 é caracterizado por hiperglicemia devido à resistência à insulina e
redução na função da célula (Gross et al., 2002). Na maioria das pessoas obesas também é
observada a resistência à insulina. A dislipidemia é uma característica comum entre os
indivíduos resistentes à insulina, diabéticos do tipo 2 e obesos (Yaney & Corney, 2003). Esta
disfunção é caracterizada por uma alteração no metabolismo das lipoproteínas gerando um
aumento nos níveis plasmáticos de triglicérides e ácidos graxos livres, e redução nos níveis de
colesterol HDL (lipoproteína de alta densidade) (Henkin & Oberman, 1992).
O DM tipo 2 pode ser controlado inicialmente por uma dieta saudável, perda de peso e
aumento da atividade física. A maioria das pessoas com DM tipo 2 exigirá tratamento
farmacológico (Gillies et al., 2008). O controle da glicemia melhora com medicamentos
hipoglicemiantes, mas raramente normaliza o metabolismo alterado das lipoproteínas, e
alguns casos a dislipidemia geralmente persiste necessitando também de agentes
hipolipedimiantes (Fredrick, 2010).
Estudos têm descrito que os AGL contribuem para a RI (Bollheimer et al., 1998;
Prentki et al., 2002; McGarry et al., 2003; Nolan et al., 2006b; Lewis et al., 2002). O fato que
os ácidos graxos estimulam a secreção de insulina in vivo e in vitro corrobora com a presença
da hiperinsulinemia e elevados níveis de lipídios circulantes no plasma nos indivíduos
resistentes à insulina (Yaney & Corney, 2003). A redução da taxa de lipidios melhora o
esclarecido na RI qual o mecanismo celular que os ácidos graxos livres alteram a secreção de
insulina.
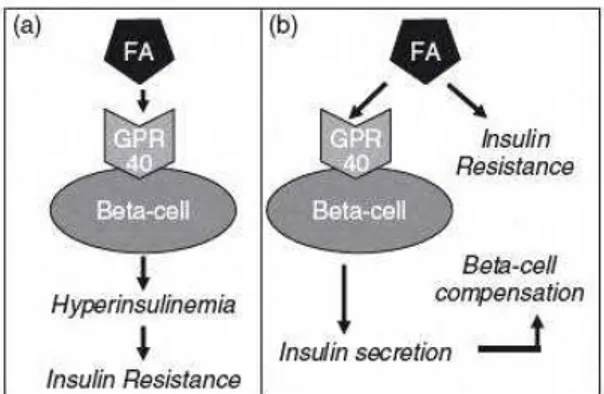
Diversos trabalhos concordam que a hiperinsulinemia é a responsável por induzir a
resistência à insulina. De acordo com Steneberg et al. (2005), a resistência à insulina induzida
por dieta com alto teor de gordura ocorre devido à hiperinsulinemia provocada pela ativação
do GPR40 (figura 5a). A ausência de GPR40 em camundongos protege da obesidade induzida
por hiperinsulinemia, esteatose hepática, hipertrigliceridemia, hiperglicemia e intolerância à
glicose. Esta hipótese afirma que a deleção do GPR40 previne a RI e seria uma estratégia
terapêutica (Aston-Mourney et al., 2008).
Em contraste, diversos trabalhos contradizem essa observação. Dentre eles, Kebede et
al. (2009) propôs que o aumento da secreção de insulina pela ativação do GPR40 contribui para os mecanismos compensatórios nas células observados na resistência à insulina (figura
5b). Essa observação é apoiada por estudos em humanos que associaram alterações da
secreção de insulina com a perda da função do gene GPR40 por mutações (Vettor et al.,
2008). Entretanto, as discrepâncias entre os estudos demonstram a necessidade de
investigações adicionais sobre o papel fisiológico e mecanismos de ação desses receptores
acoplados à protéina G.
Figura 5. Duas hipóteses de indução a resistência à insulina pelos lipídios e compensação das células ß. (a) O aumento da secreção de insulina pela ativação do GPR40 causa a resistência à insulina. (b) A secreção de insulina ativada pelo GPR40 contribui para os mecanismos compensatórios nas células ß, observados na resistência à insulina. FA= ácido graxo, GPR40 = receptor acoplado à proteína G 40. Fonte: Kebede et al. (2009).
4. Glicocorticoides
Os glicocorticoides são hormônios esteroides produzidos no córtex das glândulas
prática clínica eles são amplamente utilizados como agentes antiinflamatórios e
imunossupressores (Saklatvala, 2002). Em excesso, os glicocorticoides induzem resistência à
insulina (Stojanovska et al., 1990; Korach-Andre et al., 2005; Rafacho et al., 2008b), como
evidenciado na síndrome de Cushing (Saklatvala, 2002), por aumentar a produção hepática de
glicose pela gliconeogênese e diminuir sua captação pelos tecidos periféricos (Delaunay et al.,
1997). Além disso, dependendo da dose e do tempo de tratamento, os glicocorticoides podem
causar DM tipo 2 (Hoogwerf & Danese 1999).
Em animais induzidos à resistência periférica à insulina com o glicocorticoide
sintético dexametasona (1mg/kg p.c por 5 dias consecutivos) são observadas alterações
funcionais e morfológicas que ocorrem nas ilhotas pancreáticas como mecanismos
compensatórios à RI (Rafacho et al., 2008a; Rafacho et al., 2009). Rafacho e colaboradores
(2010) relataram que o aumento da função mitocondrial, sinalização de Ca2+, atividades das proteínas PLC/PKC, bem como alterações na exocitose, podem ter um papel importante no
aumento da SIEG observado nas ilhotas de animais tratados com dexametasona. Observou-se
neste trabalho que as ilhotas aumentaram os níveis de Ca2+ intracelular em resposta à glicose elevada. No entanto, quando estimuladas com KCl e tolbutamida as ilhotas não apresentaram
alterações na atividade dos canais de Ca2+ sensíveis à voltagem e canais K-ATP, respectivamente. Em adição, ilhotas expostas ao carbacol, um ativador do receptor
muscarínico, potencializou a secreção de insulina, a atividade da PLC e o aumento de Ca2+ intracelular. Ao analisar a função mitocondrial de ilhotas tratadas com dexametasona e
incubadas em glicose elevada observou-se um aumento na geração de NAD(P)H. Porém, esta
alteração mitoncondrial não tem relação com as enzimas glicoquinase e piruvato quinase,
importantes no metabolismo da glicose.
Os glicocorticoides apresentam um papel modulador sobre os lipídios circulantes. Eles
aumentam os níveis plasmáticos de triglicérides por inibição da atividade da lipoproteína
lipase (Franco-colin et al., 2000) e aumentam os níveis de AGL por ativação da lipase
hormônio sensível (Slavin et al., 1994). No modelo de indução a RI com dexametasona é
verificado uma marcante elevação nos níveis de AGL e triglicérides. Esta observação levou à
hipótese dos lipídios modularem a compensação das ilhotas resistentes à insulina, também
citada em outros trabalhos (Prentki et al., 2002; El-Assad et al., 2003; Novelli et al., 2008).
Contudo, não há neste modelo um estudo da importância dos ácidos graxos sobre alterações
5. Receptor ativado por proliferador de peroxissoma
Os receptores nucleares ativados por proliferador de peroxissoma (PPARs) têm sido
implicados em diversos processos, incluindo metabolismo de lipídios e carboidratos, gasto
energético, processos imunes e inflamatórios, homeostase vascular, remodelação tecidual e
diferenciação e proliferação celular em tecidos normais e neoplásicos (Scatena et al., 2008).
Em vertebrados e mamíferos foram identificados três isoformas: PPARα, PPAR /δ e PPAR
(NUCLEAR RECEPTORS NOMENCLATURE COMMITTEE, 1999) com distribuição
tecidual e funções distintas (Kliewer, et al. 1994). Nas células são expressas todas as
isoformas de PPAR (Zhou et al., 1998).
O PPARα é responsavel por controlar um conjunto de genes que regulam o metabolismo dos ácidos graxos e lipoproteínas nas mitocôndrias, peroxissomos e retículo endoplasmático
durante o jejum, induzindo a proliferação peroxissomal, oxidação dos ácidos graxos e a
produção de corpos cetônicos (Yoon, 2009). Esta isoforma estimula o influxo de ácidos graxos
na mitocôndria via CPT-1 reduzindo assim a sua disponibilidade para síntese de triglicerídeos.
O PPARα também reduz os níveis de triglicérides por aumentar o catabolismo das partículas de
VLDL (lipoproteína de densidade muito baixa) e da expressão da enzima lípase lipoprotéica
(Schoonjans et al., 1996) através da redução da expressão da Apoproteína C-III (Staels et al.,
1995) e aumento da expressão da apoproteína A-V (Prieur et al., 2003). Além disso, a ativação
de PPARα aumenta os níveis de colesterol HDL por aumentar a síntese da apoproteína A-I e A-II (Tenenbaum et al., 2005).
O PPARα é ativado por ligantes naturais como ácidos graxos, espécimes lipídicos oxidados, eicosanóides e prostaglandinas (Chawla et al., 2001) ou através de sintéticos como os
fibratos e WY14643 (ácido pirinixico) (Yoon, 2009). Os fibratos são utilizados na prática
clínica em pacientes com dislipidemia (Fruchart et al., 2001). Este fármaco foi introduzido na
década de 1970 com o Clofibrato, seguido por gemfibrozil, bezafibrato, fenofibrato e
ciprofibrato. O bezafibrato tem sido caracterizado como agonista tipo pan-PPAR, ativando o
PPARα e com alta afinidade ao PPARδ e PPAR (Krey et al., 1997). Estudos demonstraram em humanos (Tenenbaum et al., 2007; Flory et al., 2009) e em ratos (Jia et al., 2004; Nakano et al.,
2007; Santos et al., 2009) que o tratamento com bezafibrato reduz o risco de desenvolver
diabetes tipo 2 por melhorar a sensibilidade periférica à insulina e função das células . A
ativação por outros agonistas PPARα também normalizaram a hipersecreção de insulina em
modelos de indução a resistência à insulina (Holness et al., 2003; Sudgen et al., 2003).
Em ilhotas pancreáticas no período de jejum ocorre aumento na expressão do PPARα e
al. (2005), a oxidação dos ácidos graxos elimina moléculas lipídicas que estimulam a secreção
de insulina, ou seja, no jejum a sinalização do PPAR é necessária para suprimir a SIEG.
Pesquisadores relataram em ilhotas incubadas com ativador PPARα e glicose, redução
da secreção de insulina, bem como nas oscilações de Ca2+ intracelular (Freeman et al., 2006). Contudo, dados da literatura demonstram que ilhotas incubadas com bezafibrato e glicose
tiveram aumento da secreção de insulina e aumento na expressão do RNA mensageiro de
PPAR-α, acil-CoA oxidase, CPT-1 e piruvato carboxilase, moléculas que poderiam contribuir
no aumento da SIEG (Yoshikawa et al., 2001). Shimomura e colaboradores (2004)
demonstraram que ativadores de PPARα podem induzir a secreção de insulina por inibição
dos canais de K-ATP. Em complemento, Kotarsky et al. (2003) sugeriu que as tioglitazonas,
uma classe de medicamentos antidiabéticos ativadores de PPAR , ativam o receptor GPR40,
reconhecido por induzir a secreção de insulina nas células ß. No entanto, o mesmo não foi
observado com o ativador de PPAR α Clofibrato.
Justificativa
No modelo de indução a resistência periférica à insulina pelo tratamento com
dexametasona por 5 dias (1 mg/Kg ip) observa-se que o pâncreas endócrino, para compensar a
resistência à insulina, sofre alterações morfológicas e funcionais. A hiperinsulinemia e o
aumento na secreção de insulina estimulada por glicose indicam a alteração funcional das
ilhotas pancreáticas nesta condição. Adicionalmente, foi observado em diversos trabalhos que
no tratamento com dexametasona ocorre elevação de ácidos graxos livres circulantes
(Bollheimer et al., 1998; Barbera et al., 2001; Rafacho et al., 2008b) que contribuem no
aumento da secreção de insulina, apoiando a hipótese que a elevação crônica dos ácidos
graxos livres pode ser um mediador das mudanças induzidas pelo tratamento com
dexametasona (Novelli et al., 2008). Uma das vias pela qual os ácidos graxos livres estimulam
a secreção de insulina é a ativação do GPR40, o receptor de ácidos graxos presente nas células
ß (Itoh et al., 2003).
Não está totalmente esclarecido na literatura o mecanismo celular pelo qual os ácidos
graxos livres alteram a secreção de insulina na resistência à insulina. Desse modo, buscamos
possível correlação com a via do GPR40 para investigar se a redução na taxa de lipídios pelo
tratamento com bezafibrato altera as adaptações funcionais observadas nas células ß no
Objetivos
Geral
Avaliar no modelo de indução a resistência periférica à insulina com dexametasona a
participação dos lipídios nas alterações funcionais nas células ß através do tratamento com o
redutor de lipídios bezafibrato.
Específicos
Avaliar a resposta secretória de insulina estimulada por glicose pelas ilhotas
pancreáticas.
Avaliar a sensibilidade periférica à insulina. Avaliar a tolerância à glicose.
Resultados
Os resultados obtidos durante a realização deste trabalho estão apresentados a seguir
sob a forma de um artigo submetido segundo normas da revista Canadian Journal of
TITLE: Bezafibrate counteracts the effects of dexametasone treatment on
insulin resistance and secretion
Maiara Destro1, José Roberto Bosqueiro2 *
1- Institute of Biosciences, São Paulo State University-Unesp, Botucatu, São Paulo,
Brazil.
2- Department of Physical Education, Faculty of Sciences, São Paulo State
University-Unesp, Bauru, São Paulo, Brazil.
*Correspondence to:
José Roberto Bosqueiro, Department of Physical Education, Faculty of Sciences,
São Paulo State University-Unesp, Bauru, São Paulo, Brazil.
Address: Av. Eng. Luiz Edmundo Carrijo Coube, 14-01, CEP: 17033-360 Bauru/SP-
Brasil
Phone: 55-14-31036041
FAX: 55-14-31036041
ABSTRACT
Increased glucose-stimulated insulin secretion (GSIS) is an adaptive mechanism
exhibited by pancreatic islets from insulin-resistant animal. Studies report that free
fatty acids stimulate insulin secretion via GPR40. Here, we investigate the expression
of GPR40 and the participation of lipids in the functional adaptation in ß-cells in the
model of dexamethasone-induced IR, by lipid-lowering therapy with bezafibrate.
Groups received daily gavage for 28 days: Control (CTL) and DEXA with gum Arabic;
BEZA and BEZA-DEXA with bezafibrate (300 mg/kg b.w.). In the last 5 days of the
treatment groups received i.p. injections: CTL and BEZA of saline; DEXA and
BEZA-DEXA of dexamethasone (1.0 mg/kg b.w.). BEZA-BEZA-DEXA showed decrease in fatty
acids, triglycerides and insulin levels, but not raised glycaemia levels, and improved
insulin resistance and decreased GSIS, compared to DEXA. In BEZA-DEXA islets,
GPR40/PLCß1/PKC protein content was significantly higher than DEXA. This
pathway remained unchanged in DEXA and BEZA islets. In conclusion, bezafibrate
treatment improved ß-cell function and prevented dexamethasone-induced IR, but
the mechanisms are not known. Augmented insulin secretion in DEXA appears to be
unrelated to the activation of the GPR40. Contrary to the literature, despite the
reduction in insulin secretion, BEZA-DEXA islets showed activation of the GPR40
pathway.
Key-words: fatty acids, glucocorticoids, insulin secretion, pancreatic islet,
INTRODUCTION
Effects of glucocorticoid hormones in the treatment of inflammatory and
autoimmune diseases are well known in clinical practice. Furthermore, depending on
the dose and duration of treatment, glucocorticoids can induce insulin resistance (IR)
and cause type 2 diabetes (Stojanovska et al., 1990; Korach-Andre et al., 2005;
Rafacho et al., 2008a). This diabetogenic effect is due to the stimulated
gluconeogenesis and decreased peripheral glucose uptake (Delaunay et al., 1997).
Glucocorticoids are widely used in research to induce experimental IR (Tappy et al.,
1994; Severino et al., 2002). Recent research demonstrated that daily injections of
dexamethasone (1.0 mg/kg body weight, 5 days) induce IR in rodents (Rafacho et
al., 2008a). It has been proposed in glucocorticoid treatment that hyperinsulinaemia
is a compensatory mechanism of the endocrine pancreas to counterbalance the IR
(Tappy et al., 1994, Karlsson et al., 2001 Rafacho et al., 2010). The hyperlipidaemia
and hyperglycemia observed in dexamethasone-treated rats could contribute to the
IR and hyperinsulinemia (Bollheimer et al., 1998; Barbera et al., 2001; Lewis et al.,
2002). Moreover, the chronic exposure of free fatty acids (FFA) in combination with
high blood glucose leads to -cells failure, a phenomenon known as glucolipotoxicity
(Prentki et al., 2002).
The control of insulin secretion is multifactorial and interconnected with
nutrient like glucose, amino acid and FFA, as well as neurohumoral factors (Malaisse
et al., 1973). The ability of FFAs to stimulate insulin secretion is well established
(McGarry et al., 2003), but the cellular mechanisms are still unclear. However,
studies demonstrated that fatty acids induce increase in insulin secretion by lipids
Corkey, 1996; Prentki et al., 2002) or by the activation of factors modulated by fatty
acids such as the G-protein-coupled receptor GPR40 (Itoh et al., 2003; Gromada et
al., 2008; Kebede et al., 2009) and peroxisome proliferator-activated receptors
(PPAR) (Sugden et al., 2003; Gremlich et al.,2005).
The FFA receptor GPR40 is preferentially expressed in the pancreatic ß-cells
(Itoh et al., 2003). The PPAR class of nuclear receptors is implicated in several
processes, including metabolism of lipids and carbohydrates (Scatena et al., 2008).
Three major isoforms of PPARs have been identified, PPARα, PPAR /δ and PPAR
(Kliewer et al., 1994). All isoforms are expressed in pancreatic -cells (Zhou et al.,
1998). The PPARα is activated by fibrates, hypolipidemic drugs used in the treatment
of dyslipidemia (Fruchart et al., 2001). Bezafibrate (BEZA) is a pan (α, /δ and )
PPAR activator that improves the lipid metabolism and in addition, reduces the risk of
developing type 2 diabetes (Tenenbaum et al., 2007; Flory et al., 2009).
It is well known that the reduction in plasma lipids improves the islet function in
IR. However, there are few studies on the mechanisms involved in this model of
dexamethasone-induced IR. In the present study, we investigated the participation of
FFA on the insulin secretion by pancreatic ß-cells of dexamethasone-induced insulin
resistant rats, through lowering lipid levels by the treatment with bezafibrate, focusing
on the GPR40 signaling pathway.
MATERIALS AND METHODS
Materials
Dexamethasone-phosphate (Decadron®) was from Aché (Campinas, SP,
was from Sigma (St. Louis, MO). Human recombinant insulin (Biohulin N) was from
Biobra´s (Montes Claros, MG, Brazil). The reagents used in the insulin secretion
protocol and RIA were from Mallinckrodt Baker and from Sigma (St. Louis, MO).
Sodium Thiopental (THIOPENTAX) was from Cristália (Itapira, SP, Brazil).
SDS-PAGE and western blotting were performed using Bio-Rad Systems (Hercules, CA,
USA), and all chemicals used were from Bio-Rad and from Sigma (St. Louis, MO).
Enzymatic colorimetric assay for the quantification of free fatty acids (FFA),
triglycerides (TG), total cholesterol (T-Chol), HDL cholesterol detection kits were from
Human do Brasil (Itabira, SP, Brazil). The antibodies anti-G-protein-coupled receptor
40 (GPR40) (rabbit polyclonal), anti-protein kinase C zeta (PKC ) (rabbit polyclonal),
anti-phospholipase C ß1 (PLCß1) (rabbit polyclonal) and anti-α-tubulin antibody were
from Santa Cruz Biotechnology (Santa Cruz, CA).
Animals and treatment
Experiments with animals were approved by the Institutional São Paulo State
University (UNESP) Committee for Ethics in Animal Experimentation according to the
Guide for the Care and Use of Laboratory Animals published by the US National
Institutes of Health (NIH publication No. 85-23 revised 1996). The rats were obtained
from the UNESP Animal Care Unit, Campus of Botucatu and kept at 22±2 Cº on a
12-hour light/dark cycle. The rats had access to food and water ad libitum.
The experiments were performed on 4 groups of male Wistar rats (3 months
old). Once a day during 28 days, the experimental control groups (CTL) and DEXA
received gavage of gum Arabic 5% (1 ml/kg b.w.) while BEZA and BEZA-DEXA
groups received bezafibrate (300 mg/kg b.w., dissolved in gum Arabic 5%). In the
injections of saline (1.0 ml/kg b.w.), and the DEXA and BEZA-DEXA groups received
intraperitoneal injections of dexamethasone phosphate (Decadron®, 1.0 mg/kg b.w.,
dissolved in saline).
Metabolic, Hormonal, and Biochemical measurements
Body weight was measured daily and food intake was measured during
dexamethasone treatment. On the day after the last treatment of each group, fasted
(12-14 hours) and fed rats had the blood collected from the tail to measurement of
blood glucose levels with a glucometer (One Touch; Johnson & Johnson).
Immediately after, the rats were killed by exposure to carbon dioxide followed by
decapitation. The serum obtained by centrifugation was used to measure all the
following parameters: insulin levels were measured by radioimmunoassay (RIA),
using a rabbit anti-rat insulin antibody and rat insulin as standard (Scott et al., 1981),
TG, T-Chol, FFA and HDL cholesterol were determined by enzymatic colorimetric
assay according to the manufacturer’s directions. Hepatic glycogen was measured in
fasted rats as described by Lo et al. (1970) with some modifications. The organs of
fed animals (listed in table 1) were withdrawn and weighed.
Intraperitoneal Glucose Tolerance Test (ipGTT)
On the day after the last treatment of each group, fasted rats (12-14 hours)
were anesthetized with sodium thiopental (60 mg/kg b.w). After checking the
absence of reflexes, unchallenged samples (time 0) were obtained from rats’ tails.
Immediately after, 50% glucose (2 g/kg b.w.) was administered and blood samples
were collected at 15, 30, 60 and 120 minutes from the tail tip for determination of
was added to an Eppendorf tube containing 200 µL of saline (NaCl 0.9%),
centrifuged at 15.000g and stored at -70ºC for subsequent measurement of insulin
content by RIA.
Intraperitoneal Insulin Tolerance Test (ipITT)
On the day after the last treatment of each group, fed rats were anesthetized
as described previously. A sample of blood was collected from the tail tip for glucose
measurement at time 0. Human recombinant insulin equivalent to 2 units/kg b.w. was
then injected IP. Further samples were collected at 10, 20 and 30 minutes for blood
glucose measurement. The constant rate for glucose disappearance (Kitt) was
calculated from the slope of the regression line obtained with log-transformed
glucose values between 0 and 30 minutes after insulin administration.
Isolation of Islet, Insulin Content, and Static Secretion Protocols
Islets were isolated by collagenase digestion of the pancreas as described
(Lacy; Kostianovsky, 1967), with modifications. Insulin contents of islets were
determined after extraction in acid-ethanol solution (12 mM HCl in 70% ethanol). The
islets were sonicated for 15 seconds, centrifuged for 10 minutes at 3000g, and the
supernatant was frozen for analysis of insulin content by RIA. For static incubation,
groups of 5 islets were firstly incubated for 1 hour at 37 ºC in a Krebs-bicarbonate
buffer solution of the following composition (in mM): 115 NaCl, 5 KCl, 2.56 CaCl, 1
MgCl2, 24 NaHCO3, 15 N-2 hydroxyethylpiperazine-N-2-ethanesulfonic acid (HEPES)
and 5.6 glucose, supplemented with 0.5% of bovine serum albumin and equilibrated
with a mixture of 95% oxygen and 5% carbon dioxide, pH 7.4. The medium was then
the end of the incubation, the samples were stored at -20ºC for subsequent
measurement of insulin content by RIA.
Protein extration and imunnoblotting
Pools of islets were homogenized in ice-cold cell lysis buffer (Cell Signaling)
using a cell homogenizer (Fisher Scientific, Suwanee, GA, USA). Protein
concentration from total cell lysate was determined by Bradford method according to
the manufacturer (Bio-Rad, Hercules, CA, USA). Protein obtained from islets (100
µg) was used for each experiment. The sample was applied to a polyacrylamide gel
and separated by SDS-PAGE in a BioRad miniature slab gel apparatus. The
electrotransfer of proteins from the gel to nitrocellulose membrane was performed for
90 minutes at 120 V (constant) in a Bio-Rad miniature transfering apparatus
(Mini-Protean) with 0.02% SDS and 20% methanol. After blocking for 2 h in Tris buffer salt
tween (TBST) 5% dry skimmed milk, membranes containing islet lysates were
washed in TBST (3-7 min) and incubated overnight with primary antibodies. After
washing in TBST (3-10 min), membranes were incubated with the appropriate
secondary antibody conjugated with HRP for 90 minutes in TBST 1% dried skimmed
milk. Antibody binding was detected by enhanced SuperSignal® West Pico
Chemiluminescent Substrate (Pierce, Rockford, IL, USA), as described by the
manufacturer. Blots were scanned (Epson expression 1600) and the densitometry of
the protein bands was determined by the pixels intensity using Scion Image software
(Scion Corporation, Frederick, MD, USA). The protein content values were corrected
by expression of α-tubulin used as a control blot.
Results are expressed as means ± SE of the indicated number of experiments.
One-way ANOVA for unpaired groups, followed by Tukey’s post test was used for
multiple comparisons of parametric data. The significance level adopted was P<0.05.
RESULTS
Dexamethasone-induced IR decreases body weight and food intake
The DEXA and BEZA-DEXA groups in the last 5 days of treatment showed a
reduction in body weight, but the significant reduction was observed from the third
day of the treatment compared to other groups (Fig. 1). The animals in the DEXA
group lost significantly more weight (14.69% ± 0.89) than the BEZA-DEXA group
(10.85% ± 0.66), compared to CTL and BEZA groups (n=8, P<0.05). In addition, we
observed that bezafibrate treatment does not influence the weight of the animals
compared to CTL group.
The food intake was measured to try to explain the reduction in the body
weight (Fig. 2). There was a significant reduction of food intake on the second day of
the treatment with dexamethasone in the DEXA and BEZA-DEXA groups (n=8,
P<0.05) compared to the BEZA group. However, on the last day of treatment the
BEZA-DEXA group increased their food intake compared to DEXA animals (n=8,
P<0.05). The bezafibrate treatment does not influence the food intake in relation to
CTL group (n=8, P<0.05).
Alterations of the overall organ mass induced by dexamethasone and
In table 1 the weight of internal organs are showed. All organs analyzed in the
DEXA group demonstrated a significant alteration in weight, except in epididymal and
retroperitoneal fat compared to CTL (n=8, P<0.05). The liver weight increased in
DEXA, BEZA and BEZA-DEXA groups by approximately 40%, 80% and 120%
respectively, when compared to CTL group. In the BEZA-DEXA group only the heart
weight remained unchanged compared to the DEXA group. While the kidney weights
in the BEZA group showed a significant increase in relation to the CTL (n = 8,
P<0.05).
Effects of treatment with dexamethasone and bezafibrate on blood glucose,
serum insulin, FFA, TG, HDL, T-Chol and hepatic glycogen content
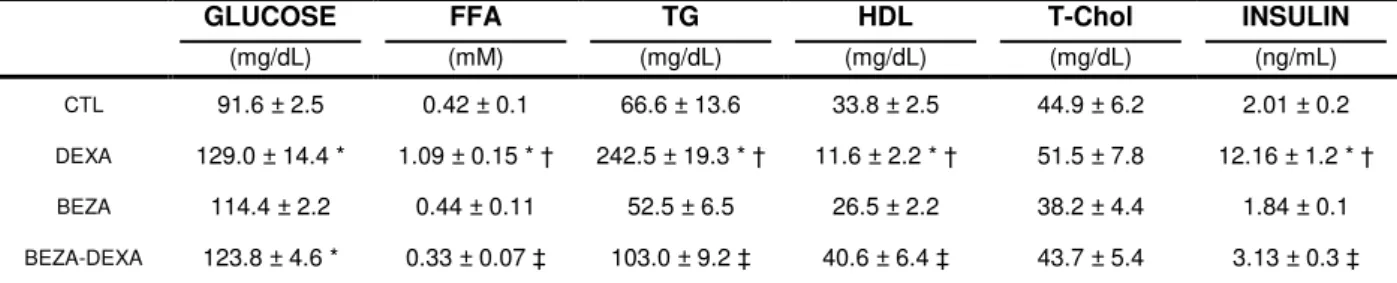
Table 2 shows the values measured in fasting animals. The DEXA group had
increased FFA, TG, insulin levels and blood glucose, and decreased HDL cholesterol
levels (n=8, P<0.05), but no change in the T-Chol levels compared to the CTL and
BEZA groups. On the other hand, in the BEZA-DEXA group there was an increase in
HDL cholesterol levels and a decrease in insulin, FFA and TG levels (n = 8, P<0.05)
in relation to the DEXA group, whereas their glucose levels were equivalent to the
DEXA group. In the BEZA-DEXA group the serum T-Chol levels remained
unchanged. In the BEZA group no metabolic changes were observed when
compared to the CTL.
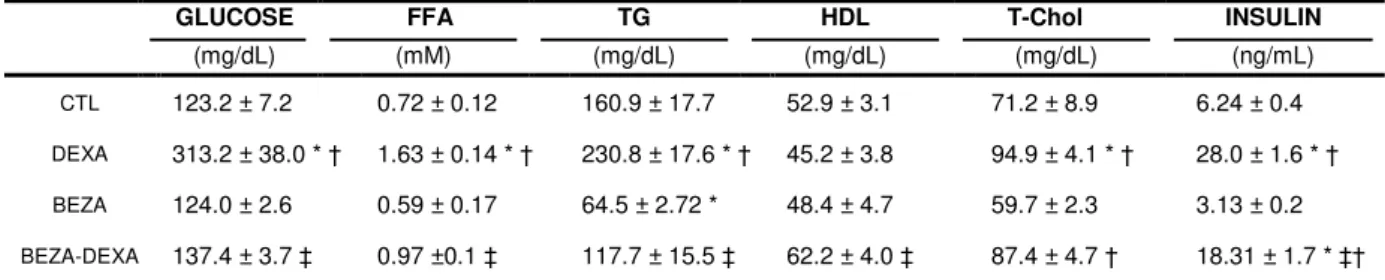
Table 3 shows the values measured for fed animals. In the DEXA group the
T-Chol levels demonstrated a significant increase when compared to the CTL and
BEZA groups (n = 8, P<0.05) and HDL cholesterol levels remained unchanged. A
(P<0.05) did not occur in the BEZA-DEXA group. In the BEZA-DEXA group there
was an increase in T-Chol levels compared to the BEZA.
The hepatic glycogen content in the fasting state (Fig. 3) increased in the
DEXA group (n = 8, P<0.05) compared to the CTL. However, in the BEZA-DEXA
group animals, there was a reduction (P<0.05) when compared to the DEXA group.
In the BEZA group did not exhibit significant differences in the hepatic glycogen
content in relation to CTL.
Effects of treatment with dexamethasone and bezafibrate on Glucose
Tolerance
The DEXA treatment impaired the peripheral insulin resistance. The blood
glucose values obtained in intraperitoneal glucose tolerance test (Fig.4A) carried out
on the DEXA group were greater at all times during the experiment (n=8, P<0.05)
compared to CTL. The BEZA group had unchanged blood glucose levels at all times
during the experiment compared to CTL. The glucose levels of the BEZA-DEXA
group were significantly higher at the15 and 30 minute intervals in relation the DEXA
group. In addition, the area under the curve (AUC), obtained from ipGTT (Fig. 4B), in
the DEXA group showed glucose intolerance (12575±344) compared to CTL
(7529±671) and BEZA animals (8095±823) (n = 8, P<0.05). Furthermore, the
BEZA-DEXA group (9094±714) improves glucose tolerance, when compared to the BEZA-DEXA
group.
The insulin concentration was significantly higher in the DEXA group (n = 8,
P<0.05) than all other groups during the entire experimental period (Fig. 4C). Only at
time interval 0 minutes did the BEZA-DEXA group show any significant increase in
AUC (Fig. 4D) was significantly increased in the DEXA group (5.89±1.25) in relation
to CTL (1.01±0.14) and BEZA (0.91±0.02) groups (n = 8, P<0.05). In the
BEZA-DEXA animals these values were reduced (2.47±1.23) compared to the BEZA-DEXA group
(n = 8, P<0.05)
Effects of treatment with dexamethasone and bezafibrate on peripheral insulin
sensitivity
The values obtained during intraperitoneal insulin tolerance test are shown in
Figure 5A. The DEXA group exhibited a decrease in insulin sensitivity demonstrated
by a significant reduction in the constant rate for glucose disappearance (Kitt) values
(13.0±0.76) compared to the CTL group (24.2± 2.3) and the BEZA group (32.0±4.9)
(Fig.5B). The BEZA-DEXA animals demonstrated greater in insulin sensitivity with a
significant increase in the Kitt (24.0±1.7) when compared to the DEXA group (n = 8,
P <0.05).
Glucose-induced insulin secretion in isolated islets
The islet insulin content remained unchanged in all groups: CTL (160±30.5),
DEXA (132±17.3), BEZA (167.87±23.5), BEZA-DEXA (107.87±11.6) ng/islet. As
shown in Figure 6, the concentration of 2.8 mM glucose did not significant difference
in insulin secretion between the groups. At the concentration of 16.7mM glucose,
DEXA islets (15.46±0.6 ng/mL) and BEZA islets (16.11±1.0 ng/mL) had higher
glucose-stimulated insulin secretion (GSIS) compared to the values in the CTL islets
(7.80±0.3 ng/mL). The BEZA-DEXA islets showed a significant decrease in GSIS
Protein expression of the GPR40 pathway in isolated islets
To determine how the FFA stimulated the insulin secretion, we analyzed the
protein expression of GPR40, PLCß1 and PKC . The protein expression of GPR40 in
the BEZA-DEXA group (13031±767) was significantly higher compared to other
groups (CTL, 9564±517; DEXA 9816±72 and BEZA 8495±739, n=4, P<0.05).
However, the protein PLCß1 increased in animals from BEZA-DEXA (11513±841)
only in relation to the DEXA group (8394 ± 217). When analyzed the protein
expression PKC , observed an increase in the BEZA-DEXA group (10837±275)
compared to other groups (CTL, 5075±668; DEXA, 4117±1424 and BEZA,
6472±234, n=4, P<0.05).
DISCUSSION
In this study, we investigated the contribution of the free fatty acids in
dexamethasone-induced insulin resistance and insulin secretion in rats, by
lipid-lowering therapy with bezafibrate.
The weight loss through dexamethasone treatment (Fig. 1) probably is due to
the anorexigenic effects of insulin in the hypothalamus (Wood, et al., 1979), observed
by a reduction of food intake (Fig. 2). However, the lower body weight loss in the
BEZA-DEXA group compared to the DEXA group is supported by the increase in food
intake on the last day of the dexamethasone-treatment, and by the reduction in the
levels of insulin observed in this group. The administration of bezafibrate did not
influence the food intake, neither body weight, unlike studies which reported a loss or
gain in weight (Nakano et al., 2007, Santos et al., 2009). Counteracting the absolute
weight loss in the DEXA and BEZA-DEXA groups, we observed a weight gain in both
organs analyzed (table 1) in all groups compared to CTL, and this could be due to
hepatomegaly promoted by activation of PPARα in rodents, but not in humans, as a
result of parenchymal peroxisome proliferation through increased oxidative stress
(Lee et al., 1995).
In the DEXA animals dyslipidemia was observed, a common feature among
insulin resistant individuals (Yaney; Corney, 2003) with a marked increase in the
levels of free fatty acids (FFA), triglycerides (TG), decrease in the levels of HDL
cholesterol but did not change in the T-Chol levels in fasting rats (table 2).
Bezafibrate treatment in normal fed rats exhibited only decreased TG levels (table 3).
In the BEZA-DEXA animals there was a reduction in FFA, TG levels, an increase in
HDL cholesterol levels and also the T-Chol levels remained unchanged (table 2)
consistent with previous reports (Tenembaum et al., 2005). Bezafibrate is a pan (α,
/δ and ) PPAR activator (Tenenbaum et al., 2007). PPARα is a major component
of the cellular lipid homeostatic by regulating the expression of genes involved in lipid
metabolism (Aoyama et al., 1998).
The DEXA group showed a significant increase in insulin values for both
fasting (table 2) and fed rats (table 3), which did not efficiently maintain
normoglycaemia because of insulin resistance. The BEZA-DEXA group had the
insulin values decreased both in fasting (table 2) and fed conditions (table 3), which
has been observed in other works (Sugden et al., 2003; Holness et al., 2005).
Furthermore, the BEZA-DEXA group also experienced a decrease in the glycaemia
of the fed rats, which could result in a reduction of insulin secretion. Kersten and cols.
(1999) demonstrated that the PPARα is related to the adaptation of glucose in fasting
state. However, in PPARα-null (-/-) there was no alteration in glycaemia compared to
induced model produced no alterations in glycaemia (Jia et al., 2004; Pickavance et
al., 2005).
Glucocorticoid-treatment stimulates the gluconeogenesis and the
glucogenolysis. However, we observed a decrease in both pathways in the
BEZA-DEXA group, confirmed by the improved glucose homeostasis and a decrease in the
levels of serum insulin. Seung-Soon and cols. (2011) reported that in a type 2
diabetes animal model, PPARα could be activated either by free fatty acids or by
glucocorticoid, causing up-regulation of gluconeogenic genes like hepatic
glucose-6-phosphatase and of phosphoenolpyruvate carboxylase. They also demonstrated the
synergistic effect of dexamethasone and a PPAR activator in the increased
expression of these enzymes in the primary cultured hepatocytes.
Bezafibrate improves glucose tolerance (Fig 4) and insulin sensibility (Fig. 5)
in dexamethasone-induced IR in rats. This fibrate is well known to restore normal
insulin action in animal models of insulin resistance induced by high-saturated fat
diets (Holness et al., 2003; Holness et al., 2005), high-fat high-sucrose diets (Santos
et al., 2009), pregnancy (Sugden et al., 2003; Holness et al., 2006) and in
Long-Evans Tokushima Fatty rats (Jia et al., 2004). Moreover, bezafibrate delayed the
onset and decrease the incidence of type 2 diabetes in patients with impaired fasting
glucose levels, and in obese patients over a long-term follow-up period (Tenenbaum
et al., 2007; Flory, et al. 2009).
DEXA islets showed increase in the glucose-stimulated insulin secretion
(GSIS) compared to CTL and BEZA-DEXA islets (Fig. 6). BEZA-DEXA islet restored
the patterns of insulin secretion stimulated by glucose. Several models of IR
demonstrated that the lipid lowering therapy reduced the GSIS (Lalloyer et al., 2006;
islets (Fig. 6) which is in agreement with previous reports (Yoshikawa et al., 2001;
Shimomura et al., 2004; Ravnskjær et al., 2005). Shimomura and cols. (2004)
described that PPARα and PPAR may induce insulin secretion by direct inhibition of
the ATP-sensitive potassium channel. Yoshikawa and cols. (2001) reported that
islets incubated with glucose and PPARα activator had an increased mRNA
expression of PPARα, acyl-CoA oxidase, carnitine-palmitoyltransferase-1 and
pyruvate carboxylase, which could contribute to increased GSIS. On the other hand,
neuronal, hormonal and metabolic factors can respond to an increase in GSIS of
BEZA islet.
Studies have shown that FFA binding to GPR40 activates phosholipase C,
resulting in the formation of inositol 1,4,5-triphosphate and diacylglycerol, thus
activating protein kinase C (PKC) isoforms. PKC is responsible for stimulating the
exocytosis of insulin secretory granules. Studies have shown that PKC expression
is regulated by LC-CoA (Yaney et al., 2000). Contrary to studies with GPR40,
BEZA-DEXA animals showed reduced FFA and insulin levels, and increased protein
content of the GPR40 pathway in isolated islets. According to Latour and cols.
(2007), the GPR40 is necessary but not sufficient for fatty acid stimulation of insulin
secretion in vivo. Thus, in the DEXA group there must be another mechanism
responsible for lipid stimulation of insulin secretion. GPR40 is preferentially
expressed in the pancreatic ß-cell. Although, there is evidence of the expression of
GPR40 in the glucagon-producing pancreatic α-cells (Flodgren et a., 2007). The fatty
acid linoleic acid activates GPR40 and phospholipase C resulting in increases in
intracellular Ca2+ and glucagon secretion (Wang et al., 2011).
These results indicate that treatment with bezafibrate improved ß-cell function
Nevertheless, we are not able to say whether these results were due only to the
circulating lipids. Augmented insulin secretion in the DEXA group appears to be
unrelated to the activation of the GPR40. However, despite the reduction in insulin
secretion, BEZA-DEXA islets showed activation of the GPR40 pathway, contrary to
the literature.
Acknowledgments
This work was supported by grants from the Foundation for Research Support
REFERENCES
Aoyama, T., Peters, J.M., Iritani, N., Nakajima, T., Furihata, K. a Hashimoto, T. and
Gonzalez, F.J. 1998. Altered constitutive expression of fatty acid-metabolizing
enzymes in mice lacking the peroxisome proliferator-activated receptor alpha
(PPARalpha). J. Biol. Chem. 273: 5678-84.
Barbera, M., Fierabracci, V., Novelli, M., Bombara, M., Masiello, P., Bergamini, E.
and De Tata, V. 2001. Dexamethasone induced insulin resistance and pancreatic
adaptive response in aging rats are not modified by oral vanadyl sulfate treatment.
Eur. J. Endocrinol. 145: 799-806.
Bollheimer, L.C., Skelly, R.H., Chester, M.W., McGarry, J.D. and Rhodes, C.J. 1998.
Chronic Exposure to Free Fatty Acid Reduces Pancreatic b Cell Insulin Content
by Increasing Basal Insulin Secretion That Is Not Compensated For by a
Corresponding Increase in Proinsulin Biosynthesis Translation. J. Clin. Invest.
101: 1094-1101.
Delaunay, F., Khan, A., Cintra A., Davani, B., Ling, Z.C., Andersson, A., Ostenson,
C.G., Gustafsson, J., Efendic, S. and Okret, S. 1997. Pancreatic b-cells are
important targets for the diabetogenic effects of glucocorticoids. J. Clin. Invest. 8:
2094-2098.
Flodgren, E., Olde, B., Meidute-Abaravicienem S., Winzell, M.S., Ahren, B. and
Salehi, A. 2007. GPR40 is expressed in glucagon producing cells and affects
glucagon secretion. Bioche. Biophys Res Commun. 354: 240-245.
Flory, J.H., Ellenberg, S., Szapary, P.O., Strom, B.L. and Hennessy, S. 2009.
Antidiabetic Action of Bezafibrate in a Large Observational Database. Diabetes Care. 32: 547–551.
Fruchart, J.C., Staels, B. and Duriez, P. 2001. The role of fibric acids in
atherosclerosis. Curr Atheroscler Rep. 3: 83-92.
Gremlich, S., Nolan, C., Roduit, R., Burcelin, R., Peyot, M.L., Delghingaro-Augusto,
V., Desvergne, B., Michalik, L., Prentki, M. and Wahli, W. 2005. Pancreatic islet
adaptation to fasting is dependent on peroxisome proliferator-activated receptor
alpha transcriptional up-regulation of fatty acid oxidation. Endocrinology. 146:
Gromada J. 2008. The free fatty acid receptor GPR40 generates excitement in
pancreatic -cells. Endocrinology. 147: 672–673.
Holness, M.J., Smith, N.D., Greenwood, G.K. and Sugden, M.C. 2003. Acute (24 h)
activation of peroxisome-proliferator–activated receptor (PPAR) alpha reverses high-fat feeding induced insulin hypersecretion in vivo and in perifused pancreatic
islets. J Endocrinol. 177: 197–205.
Holness, M.J., Smith, N.D., Greenwood, G.K. and Sugden, M.C. 2005. Interactive
influences of peroxisome proliferator-activated receptor alpha activation and
glucocorticoids on pancreatic beta cell compensation in insulin resistance induced
by dietary saturated fat in the rat.Diabetologia. 48: 2062-2068.
Holness, M.J., Greenwood, G.K. and Smith, N.D. 2006. Peroxisome
proliferator-activated receptor-alpha and glucocorticoids interactively regulate insulin
secretion during pregnancy. Diabetes. 12: 3501-3508.
Itoh, Y., Kawamata. Y., Harada, M., Kobayashi. M., Fujii, R., Fukusumi, S., Ogi, K.,
Hosoya, M., Tanaka, Y., Uejima, H., Tanaka, H., Maruyama, M., Satoh, R.,
Okubo, S., Kizawa, H., Komatsu, H., Matsumura, F., Noguchi, Y., Shinohara, T.,
Hinuma, S., Fujisawa, Y. and Fujino, M. 2003. Free fatty acids regulate insulin
secretion from pancreatic cells through GPR40. Nature. 422: 173–176.
Jia, D., Yamamoto, M., Otani, M. and Otsuki, M. 2004. Bezafibrate on Lipids and Glucose Metabolism in Obese Diabetic Otsuka Long-Evans Tokushima Fatty
Rats. Metabolism. 53: 405-413.
Karlsson, S., Ostlund, B., Myrse´n-Axcrona, U., Sundler, F. and Ahre´n, B. 2001.
ß-Cell adaptation to dexamethasone-induced insulin resistance in rats involves
increased glucose responsiveness but not glucose effectiveness. Pancreas.
22:148–156.
Kebede, M. A., Alquier, T., Latour, M.G. and Poitout, V. Lipid receptors and islet
function: therapeutic implications? Diabetes, Obesity and Metabolis. 11: p. 10-20,
2009.
Kersten, S., Seydoux, J., Peters, J.M., Gonzalez, F.J., Desvergne, B. and Wahli, W.
1999. Peroxisome proliferator-activated receptor alpha mediates the adaptive
response to fasting. J. Clin. Invest. 103: 1489-1498.
Kliewer, S.A., Forman, B.M., Blumberg, B., Ong, E.S., Borgmeyer, U., Mangelsdorf,