BGD
12, 10469–10510, 2015
Water use strategies in response to seasonal changes of
climatic factors
Z. Z. Zhang et al.
Title Page
Abstract Introduction
Conclusions References
Tables Figures
◭ ◮
◭ ◮
Back Close
Full Screen / Esc
Printer-friendly Version
Interactive Discussion
Discussion
P
a
per
|
Discussion
P
a
per
|
Discussion
P
a
per
|
Discussion
P
a
per
|
Biogeosciences Discuss., 12, 10469–10510, 2015 www.biogeosciences-discuss.net/12/10469/2015/ doi:10.5194/bgd-12-10469-2015
© Author(s) 2015. CC Attribution 3.0 License.
This discussion paper is/has been under review for the journal Biogeosciences (BG). Please refer to the corresponding final paper in BG if available.
Water use strategies of a young
Eucalyptus urophylla
forest in response
to seasonal change of climatic factors in
South China
Z. Z. Zhang1,2, P. Zhao1, R. Oren3, H. R. McCarthy4, J. F. Niu1, L. W. Zhu1, G. Y. Ni1, and Y. Q. Huang5
1
Key Laboratory of Vegetation Restoration and Management of Degraded Ecosystems, South China Botanical Garden, Chinese Academy of Sciences, Guangzhou 510650, China
2
College of Life Sciences, University of Chinese Academy of Sciences, Beijing 100049, China
3
School of the Environment, Duke University, Durham, NC 27708-0328, USA
4
University of Oklahoma, Department of Microbiology and Plant Biology, Norman, OK 73019, USA
5
Guangxi Institute of Botany, Chinese Academy of Sciences, Guilin 541006, China
Received: 29 May 2015 – Accepted: 15 June 2015 – Published: 09 July 2015 Correspondence to: P. Zhao ([email protected])
Published by Copernicus Publications on behalf of the European Geosciences Union.
BGD
12, 10469–10510, 2015
Water use strategies in response to seasonal changes of
climatic factors
Z. Z. Zhang et al.
Title Page
Abstract Introduction
Conclusions References
Tables Figures
◭ ◮
◭ ◮
Back Close
Full Screen / Esc
Printer-friendly Version
Interactive Discussion
Discussion
P
a
per
|
Discussion
P
a
per
|
Discussion
P
a
per
|
Discussion
P
a
per
|
Abstract
To depict the wet (April with a soil water content, SWC, of 37 %) and dry (October with a SWC of 24.8 %) seasonal changes in the water use and physiological response of a Eucalyptus urophylla plantation in subtropical South China characterized by mon-soon climate, the whole-year (June 2012 to May 2013) transpiration of E. urophylla
5
was monitored using the TDP method. Daily transpiration (ET) in October averaged
5.7±2.9 kg d−1 and was 58.0 % higher than that in April (3.6±2.3 kg d−1). The diff
er-ence is consistent with that of the radiation and evaporative demand of the two months, while the nocturnal transpiration (ET-NOC) in the wet season (0.18±0.021 kg d−
1
) was almost twice that in the dry season (0.11±0.01 kg d−1). Trees displayed a higher
stom-10
atal conductance (GS) (53.4–144.5 mmol m− 2
s−1) in the wet season and a lower GS
(45.7–89.5 mmol m−2s−1) in the dry season. The leaf-soil water potentials (ΨL) of the
two months (April and October) were−0.62±0.66 and−1.22±0.10 MPa, respectively.
A boundary line analysis demonstrated that the slight improvement in theGSby SWC
in wet season was offset by a significant decrease inD, and the slope ofGSsensitivity
15
toD (dGS/dlnD) in response toGSref (referencesGS atD=1 kPa) was affected by the
variance of radiation instead of SWC. Specific hydraulic conductivity (ks) of trees of
different sizes decreased by 45.3–65.6 % from the wet to the dry season. Combining the decreased maximum referenceGS atD=1 kPa (GSref-max) by 22.4 % with the
con-stant maxGS (GSmax) when ΨL<−1.2 MPa, we shed some light on the mechanism
20
underlying the high water-use efficiency (WUE) of thisEucalyptusspecie. With a slight change inGSref-max and high sensitivity ofksto decreasingΨL, large trees used water
more efficiently than small ones did. In addition, the−min the dry season (0.53±0.007)
was lower than that in the wet season (0.58±0.01) due to the difference in the ratio of
GS to the boundary layer conductance (gb) in the two months. The negative
relation-25
ship between−m (except when light is limited) andQproved to be a plastic response
to environmental changes for E. urophylla but did not change with decreased ks as
BGD
12, 10469–10510, 2015
Water use strategies in response to seasonal changes of
climatic factors
Z. Z. Zhang et al.
Title Page
Abstract Introduction
Conclusions References
Tables Figures
◭ ◮
◭ ◮
Back Close
Full Screen / Esc
Printer-friendly Version
Interactive Discussion
Discussion
P
a
per
|
Discussion
P
a
per
|
Discussion
P
a
per
|
Discussion
P
a
per
|
1 Introduction
Climate change resulting from global warming is gradually threatening tropical and subtropical forest communities in a variety of ways, one of which is the increasing frequency of severe droughts that are caused by changes in the precipitation pattern according to the IPCC’s report (Davidson et al., 2012). Over the past 50 years, China
5
has experienced significant changes in annual and seasonal precipitation (Zhai et al., 2005). Zhou et al. (2011) noted that with increasing air temperatures in southern China since 1980, rainfall patterns have shifted to more severe storms during the wet sea-son, more rain-free days and fewer days of light rain, even though the total rainfall did not change significantly. The direct effect of decreased rain events is the increased
va-10
por pressure deficit, which further induces more transpiration and soil evaporation. As a result, the soil moisture during the dry season has shown a significant decrease.
Tropical forests may not be resilient against climate change in the long term, pri-marily due to predicted reductions in rainfall, drought-induced excessive water loss and ecosystem disturbances (Zhou et al., 2013), thus decreasing forest productivity,
15
increasing tree mortality, and decreasing forest biomass carbon sinks (Chaves et al., 2002). In planted forests, trees are more vulnerable under severe environmental stress because of their weaker ecological resilience (Bleby et al., 2012). Eucalyptus is the most planted tree genus in the world (Teketay et al., 2000) and has become a major economic resource in the southern provinces of China. The coverage of this species is
20
expanding rapidly and has doubled in the past decade (Shi et al., 2012).
As reported, phenotypically “plastic” exotic species such asEucalyptusare likely to develop traits that are hydraulically compatible with their soil environment from a young age and not likely to remain fixed as environmental conditions change (Bleby et al., 2012). These species respond to environmental feedback on hydraulic development
25
such that older and taller trees may have substantially different hydraulic and physio-logical traits compared to their younger and smaller counterparts. This type of “trans-formation” plays an important role in tree robustness. Physiological regulations must
BGD
12, 10469–10510, 2015
Water use strategies in response to seasonal changes of
climatic factors
Z. Z. Zhang et al.
Title Page
Abstract Introduction
Conclusions References
Tables Figures
◭ ◮
◭ ◮
Back Close
Full Screen / Esc
Printer-friendly Version
Interactive Discussion
Discussion
P
a
per
|
Discussion
P
a
per
|
Discussion
P
a
per
|
Discussion
P
a
per
|
also be considered with the changing and stressful environment, consisting of the re-silience aspect at the single-tree level. Stomatal movement is the main physiological mechanism that controls gas exchange in terrestrial plants. Under light-saturating con-ditions and a high vapor pressure deficit (D), most plants reduce stomatal conductance (GS) to avoid dehydrative damage by limiting the rate of water loss and the
develop-5
ment of a potentially impairing low leaf water potential (ΨL) (Meinzer et al., 1993). The
absence of stomatal regulation would cause excessive xylem cavitation and a failure of water transport (Cochard et al., 1996; Lu et al., 1996). However, stomatal regulation is typically coordinated with hydraulic conductance, which gradually decreases with ag-gravated water access limitation in the soil. Understanding the mechanistic responses
10
of trees to low water availability and drought is essential to accurately incorporate these mechanisms into process-based ecophysiological models and global vegetation mod-els (McDowell, 2011).
Trees of different sizes usually respond to soil drought-induced water stress in dif-ferent ways due to the varied hydraulic structure (Forrester, 2015). To our knowledge,
15
small trees have lower overall water loss rates at both the leaf and canopy levels and a greater sensitivity of water loss in response to water stress (increasing D or de-creasing leaf water potential) than large trees (Dawson, 1996) and therefore have an advantage under drought conditions. Larger trees usually have a deeper root system for acquiring more available soil water, especially under drought conditions (Anderegg
20
et al., 2012). In addition, the tree height, leaf area and sapwood area are in allomet-ric relation with tree size in different ways, thereby changing the hydraulic properties when trees grow larger to adapt to the environment (Schäfer et al., 2000). This deviated physiological response had been intensely debated for many years and might be as-sociated with species, ages, nutrient, climates, etc. (Binkley et al., 2013; Aranda et al.,
25
BGD
12, 10469–10510, 2015
Water use strategies in response to seasonal changes of
climatic factors
Z. Z. Zhang et al.
Title Page
Abstract Introduction
Conclusions References
Tables Figures
◭ ◮
◭ ◮
Back Close
Full Screen / Esc
Printer-friendly Version
Interactive Discussion
Discussion
P
a
per
|
Discussion
P
a
per
|
Discussion
P
a
per
|
Discussion
P
a
per
|
By reducingGSto water vapor, plants minimize water loss and maintain the hydration
of plant cells asDincreases under conditions of low water availability. Thus, the magni-tude ofGS reflects the drought intensity. For example, Medrano et al. (2002) observed
a common response pattern that was species-and condition-dependent whenGSwas
light saturated. However, in addition to the regulation of stomatal aperture, the
stom-5
ata must react rapidly to avoid excessive water loss in response to high transpiration demand under drought. The sensitivity of stomata toDhas been accurately described using empirical relationships as the slope betweenGS and ln (D) (Oren et al., 1999)
and is closely related to the magnitude ofGSatD=1.0 kPa (GSref). The stomatal
sen-sitivity to D is linearly proportional to GSref (−0.6) for isotonic plants that are able to
10
maintain a constant minimum leaf water potential (Ψleaf) (Pou et al., 2012). However,
few studies have been conducted to explore the response of stomatal sensitivity toDin seasonal drought (Naithani et al., 2012). The hydraulic architecture of plants plays a vi-tal role in theGSresponse to changing leaf hydration (Sperry et al., 2002). In addition,
because the decrease inGS is usually accompanied by a change in hydraulic
conduc-15
tance, a better understanding of the coordination between hydraulic architecture and stomatal responses to changing D will provide insight into the diurnal and seasonal growth patterns of plants (Ocheltree et al., 2014).
Most of the research aboutE. urophyllain the subtropical monsoon climate of South China is related to the productivity (Du et al., 2012; Simpson et al., 2003), wood
prop-20
erty (Jiang et al., 2004; Luo et al., 2012, 2013), and disease (Zhou et al., 2008) consid-ering of the economic aspects, while the plasticity in physiological response and func-tion of tree species remain poorly understood. Our interest is in determining how the young plantedEucalyptusforest in South China will function under enhanced drought stress and varied atmosphere conditions. We hypothesized that trees growing in the
25
dry season would respond more sensitively to climatic factors (especially referred toD) and have less-efficient water-use traits (e.g., weak transpiration rates, small stomatal conductance) but greater sensitivity to soil–water deficits and high evaporative demand than in the wet season. More specifically, we seek to answer the following key
BGD
12, 10469–10510, 2015
Water use strategies in response to seasonal changes of
climatic factors
Z. Z. Zhang et al.
Title Page
Abstract Introduction
Conclusions References
Tables Figures
◭ ◮
◭ ◮
Back Close
Full Screen / Esc
Printer-friendly Version
Interactive Discussion
Discussion
P
a
per
|
Discussion
P
a
per
|
Discussion
P
a
per
|
Discussion
P
a
per
|
tions: (1) will the soil drought alter the water use ofE. urophylla? (2) How will the hy-draulic and physiological traits of trees respond following a seasonal climate change? (3) Will the small and large trees respond differently to seasonal drought?
2 Materials and methods
2.1 Study site and plant material
5
This study was conducted at the Huangmian state forest farm (24◦66′N, 109◦87′E)
ap-proximately 60 km southwest of Guilin city in South China. This farm is planted with Eu-calyptus urophyllafor lumber and pulp production. The plantation area was 32 000 ha in 2010. All of the reported measurements took place in anE. urophyllastand 3–5 years old on a hill with an inclination of approximately 30◦ facing southwest. The forest
den-10
sity was 1375 trees ha−1. The soil of this forest is characterized with heavy loam. This area is characterized by a low subtropical monsoon climate with an annual precipi-tation ranging from 1750 to 2000 mm and an average annual temperature of 19◦C. Although the rainfall is abundant, it is unevenly distributed through the year, produc-ing wet (March to September) and dry (October to February of the next year) seasons.
15
The measurement was carried out from June 2012 to May 2013. Fifteen trees ofE. uro-phyllawith an average height of 11.5 m and a mean diameter at breast height (DBH) of 10.1 cm were chosen for our study. An observation tower 23 m high was erected within the plantation providing access to the canopy of theE. urophyllastand.
2.2 Sap flux and environmental variable measurements
20
The sap flow density (Fd, g m− 2
s−1) of the 15 sample trees was monitored with Granier-type sensors (e.g., Granier, 1987). Details about the sensors and installation can be found in Zhu et al. (2015). The Fd of E. urophylla is assumed to be isotropic in
BGD
12, 10469–10510, 2015
Water use strategies in response to seasonal changes of
climatic factors
Z. Z. Zhang et al.
Title Page
Abstract Introduction
Conclusions References
Tables Figures
◭ ◮
◭ ◮
Back Close
Full Screen / Esc
Printer-friendly Version
Interactive Discussion
Discussion
P
a
per
|
Discussion
P
a
per
|
Discussion
P
a
per
|
Discussion
P
a
per
|
Dawson, 2008). An implicit assumption for sap flow measurement is that the vari-ability in xylem flux within a tree is smaller than that among trees. If not, Fd may
be used to estimate transpiration only after it is converted to a spatially weighted mean flux. Zhou et al. (2002) conducted a survey of the radial variation in the sap flow density for 3–4 year-old E. urophylla using the heat pulse method. The
varia-5
tion in sapwood depth from the outmost surface of the stem can be expressed as
y=ax3+bx2+cx+d, wherex is the ratio of the sensor depth to the radial sapwood thickness. We integrated the results of two plots in their study and obtained the equa-tiony =4.33x3−8.31x2+4.07x+0.52.
A meteorological station was equipped on the top of the tower. The
photosyn-10
thetic photon flux density (Q0, µmol m− 2
s−1
), temperature (T, ◦C), relative
humid-ity (RH, %), and wind speed (u, m s−1) were measured simultaneously with the sap flow measurement (Zhu et al., 2015). The rainfall data during the study period of Guilin were obtained from the China Metrological Data Sharing Service System (http://www.escience.gov.cn/metdata/page/index.html). The soil water content (SWC,
15
m3m−3) was monitored with three soil water probes (SM300, UK) that were buried 30 cm under the ground surface.
2.3 Tree morphological features
Allometry in plants has been conceptualized as a proportional- or ratio-driven process (“partitioning”) (Weiner, 2004). To obtain the allocation information, the sap wood depth
20
(ds) was measured from trees that were lumbered for wood pulp during the period of ro-tation cutting. We harvested 7 sample trees that were grown close to the experimental plot for biomass determination. The DBH was measured with diameter tape. The tree height (h) was measured with the tape draped from the top of the tower, and crown of sampled trees for sap flow measurements were aligned with tape to obtain the reading
25
of the tree height. The total leaf area (AL) was measured with a portable leaf area
me-ter (Licor-3000, USA). The sapwood depth was visually distinguished from heartwood by changed color at the boundary of the two parts on the cores before the sapwood
BGD
12, 10469–10510, 2015
Water use strategies in response to seasonal changes of
climatic factors
Z. Z. Zhang et al.
Title Page
Abstract Introduction
Conclusions References
Tables Figures
◭ ◮
◭ ◮
Back Close
Full Screen / Esc
Printer-friendly Version
Interactive Discussion
Discussion
P
a
per
|
Discussion
P
a
per
|
Discussion
P
a
per
|
Discussion
P
a
per
|
area was estimated (AS). Because the DBH of the harvested trees ranged from 6.6 to
11.1 cm, while those for sap flow measurements ranged from 8.5 to 16.06 cm, we re-ferred to Zhou et al.’s study (2004) to obtain biomass information ofE. urophyllatrees with a DBH greater than 11.1 cm. We used the fitted relationship between DBH and
AS and the AL from the harvested trees together with Zhou et al.’s study (2004) to
5
scale up transpiration based on sap flow measurement. Because Eucalyptus leaves are characteristically thick, tough and long lived and are generally retained throughout a growing season and often longer (Reich et al., 1999; Ashton, 1975; Cannell, 1989), these relationships do not account for the seasonal dynamics in leaf area.
2.4 Hydraulic properties of the stem xylem
10
The physical limitations on water flow through sapwood xylem influence stomatal be-havior and transpiration in trees, which can be expressed based on Darcy’s law as:
GSref∝EL=ks(∆Ψ−0.01h)
AS
ALh
=ksHp (1)
where the transpirational demand is proportional to theGS times the vapor pressure
deficit (D). The hydraulic conductivity (kS) of sapwood as a function of water
poten-15
tial differences between soil and leaf (∆Ψ) and the hydraulic properties of trees (Hp)
represent the interaction effect of the∆Ψ,hand Huber values.
To estimate the wet-dry seasonal variation in ∆Ψ, the leaf water potentials at pre-dawn (Ψpre-dawn) and midday (Ψmidday) were measured for sunny days in April (5 days)
and October (4 days). Five trees were selected for the experiment. The measurements
20
were averaged from three replicate shoots that were sampled from the mid-crown (most of the leaves were fully expanded) per tree. We assumedΨpre-dawn to be a substitute
for the water potential in the soil (ΨS) (Kim et al., 2008; Bleby et al., 2012) because soil
moisture remain unchanged throughout the whole sunny day. Therefore, the∆Ψwas calculated as the difference betweenΨSandΨmidday.
BGD
12, 10469–10510, 2015
Water use strategies in response to seasonal changes of
climatic factors
Z. Z. Zhang et al.
Title Page
Abstract Introduction
Conclusions References
Tables Figures
◭ ◮
◭ ◮
Back Close
Full Screen / Esc
Printer-friendly Version
Interactive Discussion
Discussion
P
a
per
|
Discussion
P
a
per
|
Discussion
P
a
per
|
Discussion
P
a
per
|
2.5 Canopy stomatal conductance
In the forests where transpiration is well-coupled with atmosphere conditions, the mean stomatal conductance can be calculated based on a simplified equation (Köstner et al., 1992) that is derived from Whitehead and Jarvis (1981) assuming that theFdscaled by
AS/ALis equal to the transpiration rate per unit of leaf area (EL). The mean stomatal
5
conductance for individual trees,GSi, can be calculated as:
GSi=(GVTaρEL)/D (2)
whereEL is whole-tree transpiration per unit leaf area (g m− 2
s−1),GV is the universal
gas constant adjusted for water vapor (0.462 m3kPa K−1kg−1), Ta is the air
temper-ature (K), ρ is the density of water (998 kg m−3), and D is in kPa. GSi is in units of
10
mmol m−2s−1(Monteith and Unsworth, 2013).
This approach is based on the assumption that the contribution of water that is stored in the trees above the sensors to transpiration is negligible or explicitly accounted for. If the contribution is not negligible, it can be accounted for by determining the time lags between water uptake and an appropriate driving variable (Köstner et al., 1992; Granier
15
and Loustau, 1994). The forest had an LAI of 1.68±0.28 m2m−2 and did not show
significant seasonal changes (p=0.78) (Zhu et al., 2015). Therefore,GSicalculation is
not subjected to errors that are caused by leaf area dynamics. Thus,GSiwas estimated
after (1) performing a cross-correlation analysis betweenDandFd, and using the time
lag to infer a time-correctedFd and (2) filtering out data forD <0.6 kPa in the hours of
20
early morning and late afternoon (Oren et al., 1998).
Many non-linear functions and models have been used to analyze the effect of en-vironmental variables on GS (Monteith, 1995; Dang et al., 1997; Martin et al., 1997).
Granier et al. (1996) proposed that stomatal sensitivity is proportional to the magnitude ofGS at lowD(D=1 kPa) when soil moisture is not limiting, which was expressed as:
25
GS=GSref−mlnD (3)
BGD
12, 10469–10510, 2015
Water use strategies in response to seasonal changes of
climatic factors
Z. Z. Zhang et al.
Title Page
Abstract Introduction
Conclusions References
Tables Figures
◭ ◮
◭ ◮
Back Close
Full Screen / Esc
Printer-friendly Version
Interactive Discussion
Discussion
P
a
per
|
Discussion
P
a
per
|
Discussion
P
a
per
|
Discussion
P
a
per
|
whereGSref is the intercept (i.e., the value ofGS at D=1 kPa in a log-linear
relation-ship), and−mis the slope of the regression fit representing stomatal sensitivity to D
(i.e., dGS/ d lnD). Oren et al. (1999) demonstrated thatmis approximately 0.6 by
ana-lyzing data from a variety of sources that were acquired with both porometric and sap flux estimates ofGS. In this study, the−mandGSrefforE. urophyllain the wet and dry
5
seasons will be estimated to determine the response ofGS to drought.
The interaction between∆Ψ,GSandALin response toDat steady state (and infinite boundary layer conductance,gbl) can be described by the following function (modified
from Sperry, 1995):
kΨ=GS×D×
AL
∆Ψ (4)
10
wherekΨis the whole-tree hydraulic conductance.
2.6 Data analysis
Statistical analyses were performed using SAS (version 9.2, SAS Institute, Cary, NC). A multiple regression analysis was conducted to determine the hydraulic architecture effect on tree water use in the wet and dry seasons. A pairedttest with SAS was used
15
to compare the differences in environmental and plant physiological changes between wet and dry seasons. A boundary-line analysis was conducted in Excel (version 2010, Microsoft Office Excel) to set up the relationship between environmental conditions and maximal canopy stomatal conductance, and Origin pro (version 8.6, Origin Lab, USA) was used to draw all of the graphs in this paper.
BGD
12, 10469–10510, 2015
Water use strategies in response to seasonal changes of
climatic factors
Z. Z. Zhang et al.
Title Page
Abstract Introduction
Conclusions References
Tables Figures
◭ ◮
◭ ◮
Back Close
Full Screen / Esc
Printer-friendly Version
Interactive Discussion
Discussion
P
a
per
|
Discussion
P
a
per
|
Discussion
P
a
per
|
Discussion
P
a
per
|
3 Results
3.1 Water and atmospheric conditions
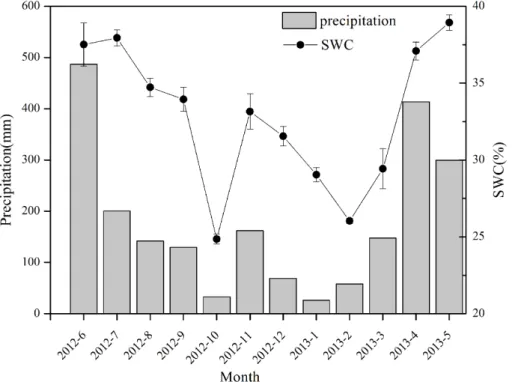
The precipitation (P) in the research site (Huangmian) totaled 2167.6 mm from June 2012 to May 2013, which was slightly higher than the annual mean (1900– 2000 mm). There was a significant monthly variation from the minimum of 26.2 mm in
5
January to the maximum of 487 mm in June. The water input was mainly contributed by precipitation in late spring and early summer (i.e., from April to June), which accounted for 55.4 % of the whole year, while that from October to February was 16 % and is typically defined as the dry season in South China. As a whole, the rainfall in Huang-mian followed a typical pattern in South China (much more water input in Spring and
10
Summer, relatively drier in autumn and winter). The seasonal change in the soil water content (SWC, m3m−3) in the forest was well correlated with that of rainfall (Fig. 1). The
nonlinear curve fit between SWC andP indicated that SWC linearly increases withP
whenP <200 mm and holds a constant value of 0.38 m3m−3whenP >200 mm (Sup-plement Fig. S1), meaning that the soil was not saturated throughout most of the year
15
except for the period from April to July.
The radiation (Q), evaporative demand (D) and soil water content (SWC) significantly changed from April to October. The SWC in October decreased 32.6 % from April, revealing a significant difference in the soil water conditions between the wet and dry seasons. Variations in the two months were contributed by rain pulse four times in
20
April and one time in October. The monthly averageQshowed an inverse pattern with SWC, which was 154.2±109.4 µmol m−2s−1in April and 283.7±108.6 µmol m−2s−1in
October.Dwas higher in October (1.07±0.39 kPa) than in April (0.32±0.28 kPa). The
differences in the three environmental factors between the two seasons were significant (p <0.01).
25
BGD
12, 10469–10510, 2015
Water use strategies in response to seasonal changes of
climatic factors
Z. Z. Zhang et al.
Title Page
Abstract Introduction
Conclusions References
Tables Figures
◭ ◮
◭ ◮
Back Close
Full Screen / Esc
Printer-friendly Version
Interactive Discussion
Discussion
P
a
per
|
Discussion
P
a
per
|
Discussion
P
a
per
|
Discussion
P
a
per
|
3.2 Tree water use in different seasons
A boundary line analysis of the relationship betweenFdandQwas conducted, and the
maximalFdwas derived from the exponential relationship (Fig. S2). The Fd of the 15
trees was 41.03±7.97 g m−2s−1and 38.82±13.16 g m−2s−1in the dry and wet seasons,
respectively, implying a similar ability to transport water to the canopy. The tree size did
5
not have any effect onFdeven though a weak negative relationship between DBH and
Fdin the dry season (R 2
=0.19,p=0.06) was observed.
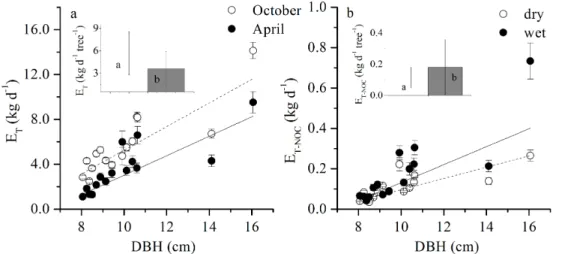
The annual standETwas 462.42 mm, and theETin October and April accounted for
12.24 and 6.57 %, respectively. The maximal (minimal) dailyET of individual trees in
the dry and wet seasons was 14.1±0.7 kg d−1(2.49±0.16 kg d−1) and 9.52±0.97 kg d−1
10
(2.2±0.3 kg d−1), respectively. The daily transpiration (ET) in October averaged 5.7±
2.9 kg d−1and was 58.0 % higher than that in April (3.6±2.3 kg d−1) (Fig. 2a,p <0.01).
The greatest variance was observed for the tree of DBH=8.5 cm, whoseETin October
increased by 185.1 % from April. In contrast, theET of the largest tree (DBH=16.1 cm)
increased by 48.5 %, lower than the mean value. The wet/dry ratio varied from 0.4
15
to 0.8 and slightly increased with the tree size (R2=0.03), implying that theET of the
larger trees was less sensitive to seasonal changes in environmental factors.
In our stand, the nocturnal transpiration (ET-NOC) was 0.18±0.021 kg in April and
0.11±0.01 kg in October, indicating its decrease with decreasing water supply (Fig. 2b,
p=0.047). This transpiration accounted for a proportion of dailyET by 1.82±0.45 %
20
and 4.51±1.34 % in October and April, respectively. However, the variances inET-NOC
among individuals were much higher in April than in October, which mirrored a different sensitivity of trees responding to environmental changes at nighttime. The nocturnal sap flow (ET-NOC) also followed a linear relationship with tree size, but larger trees were
much more sensitive to the environmental changes in April than in October. The ratio
25
ofET-NOC between the wet and dry seasons for different trees ranged from 0.6 to 2.7
BGD
12, 10469–10510, 2015
Water use strategies in response to seasonal changes of
climatic factors
Z. Z. Zhang et al.
Title Page
Abstract Introduction
Conclusions References
Tables Figures
◭ ◮
◭ ◮
Back Close
Full Screen / Esc
Printer-friendly Version
Interactive Discussion
Discussion
P
a
per
|
Discussion
P
a
per
|
Discussion
P
a
per
|
Discussion
P
a
per
|
The water potential at pre-dawn (Ψpre-dawn) was −0.24±0.04 MPa and −0.21±
0.03 MPa in the dry and wet seasons (p=0.23), respectively, and at pre-night (Ψpre-night) was−0.29±0.02 and−0.31±0.05 MPa. The water potential at noon (Ψnoon)
was−7.51±2.32 and−14.55±2.31 MPa in April and October (p <0.01), respectively.
None of the above values were significantly different among the 5 trees (p >0.05).
5
The water potential gradients at midday (∆Ψ) averaged −0.62±0.66 (April) and −1.22±0.10 MPa (October). Similar to the leaf water potential,∆Ψshowed no
signifi-cant variance among the five trees (ANOVA,p=0.14 in April andp=0.25 in October) or between the two months (p=0.33). ∆Ψwas much higher in April than in October (p <0.01), which was consistent with the seasonal pattern ofET.
10
3.3 GSand its sensitivity in response to vapor pressure deficit under different light conditions
A boundary line analysis of the relationship betweenD andGS was performed in the
dry (October) and wet (April) seasons. The datasets of GS for each tree were
clas-sified by radiation (9 levels). The data at night (Q0=0) were excluded because the
15
plant physiological response in the night was much more complicated than that in the daytime (Oren et al., 2001). The relationship between the lnD andGS of each small
subset was linearly fitted, and the intercept and slope corresponded to theGsref(GS at
D=1 kPa) and sensitivity in response toD(dGS/ d lnD, mmol m− 2
s−1kPa−1), respec-tively (Oren et al., 1999). Then, the relationship betweenGSrefand−d lnD /dGSfor the
20
two months was fitted.
TheGSreflinearly increased with sensitivity in both the dry and wet seasons (Fig. 3).
The−mfrom the relationship was significantly different among the different light levels,
ranging from 0.46–0.69 (dry season) and 0.48–0.82 (wet season). We also qualified the tree size effect on −m in both seasons; the −m at different light levels did not
25
change significantly with the tree size. TheGSref under different light conditions was
normalized by the value at the maximum Q0 of each tree in both seasons, and the
relationship between theGSref and meanQ0 at that level for all of the trees was fitted
BGD
12, 10469–10510, 2015
Water use strategies in response to seasonal changes of
climatic factors
Z. Z. Zhang et al.
Title Page
Abstract Introduction
Conclusions References
Tables Figures
◭ ◮
◭ ◮
Back Close
Full Screen / Esc
Printer-friendly Version
Interactive Discussion
Discussion
P
a
per
|
Discussion
P
a
per
|
Discussion
P
a
per
|
Discussion
P
a
per
|
with an exponential function expressed as:
GSref=a×(1−exp(−b×Q0)) (5)
wherearefers to the maximum dependent variable. As a result, the normalizedGSrefof
all of the trees increased rapidly whenQ0was low and gradually saturated at the
max-imum (Fig. 4a). The normalizedGSref reached 90 % of the maximum (GS90) when Q0
5
was 287.8 and 167.1 µmol m−2s−1in the dry and wet seasons, respectively, indicating
that theGSref in the wet season was more sensitive to light, resulting in a lower
satu-ration point than that in the dry season (p <0.01). The effect of Q0 on −m was also
qualified in both seasons (Fig. 4b). When light was limited, −m gradually increased
and then decreased whenQ0became strong enough (ANOVA, Duncan,p <0.01). Of
10
note, the−m in the wet season (0.58±0.01) was higher than that in the dry season
(0.53±0.007) (p=0.038) when all of the data were considered, but it was not
signifi-cant when the data from the low-light conditions (first two light levels) were removed. The max GS (GSref-max) of each tree was obtained from the exponential function
(Eq. 5, corresponding to a) before being normalized. The GSref-max was fitted to the
15
tree size (Fig. 5). The GSref-max of small trees (<9 cm) in the wet season increased
rapidly with DBH, then decreased before approaching a constant value, while no clear relationship between theGsref-max and tree size was observed in the dry season. The
GSref-max averaged 68.8±14.4 mmol m−
2
s−1 and 88.6±25.1 mmol m−2s−1 in the dry
and wet seasons, respectively, and the latter was significantly higher (p <0.01). The
20
GSref-max ratio of dry to wet ranged from 0.58 to 1.26 (0.81 on average), decreased
rapidly when DBH<9 cm and stabilized after DBH>9 cm (Fig. 5).
To depict the maximal potential water use of E. urophylla under a given soil mois-ture, the boundary analysis that was performed above for the dry and wet seasons was applied at different light levels (Fig. S3). All of the data during the monitoring period
25
(June 2012 to May 2013) were considered in the analysis. SWC was evenly divided into five intervals from 20 to 45 % and then classified byQ0 as above. The slope for
BGD
12, 10469–10510, 2015
Water use strategies in response to seasonal changes of
climatic factors
Z. Z. Zhang et al.
Title Page
Abstract Introduction
Conclusions References
Tables Figures
◭ ◮
◭ ◮
Back Close
Full Screen / Esc
Printer-friendly Version
Interactive Discussion
Discussion
P
a
per
|
Discussion
P
a
per
|
Discussion
P
a
per
|
Discussion
P
a
per
|
(p=0.15). TheGSref-max of each tree also slightly improved by SWC but was not
signif-icant (p >0.05), as some of these values were significantly improved or suppressed by SWC when each tree was fitted, while the others were weakly related. The relationship between−mand meanQ0was also fitted and still independent from SWC (p >0.05).
3.4 Hydraulic architectures and sap wood conductivity
5
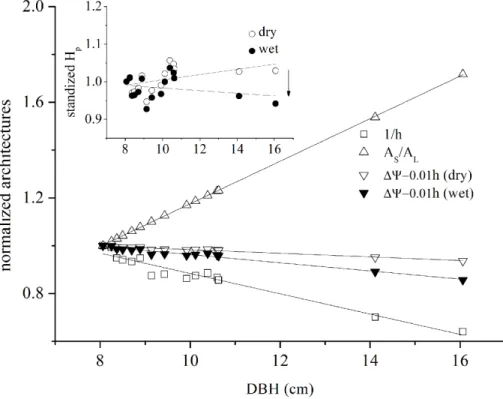
To determine the effect of the tree hydraulic structure on the plant physiological re-sponse, the integrative effects of Huber value, tree height and leaf water potential of the 15 trees onGs were described using Eq. (1). The Huber value linearly increased with
DBH (Fig. 6), while the decrease in the other components (∆Ψ−0.1h, 1/h)
counter-acted the positive effect and led to weakly changed hydraulic properties (Hp).∆Ψ−0.1
10
hand 1/h are known as the “voltage” and “conductance”, respectively, between the root and leaf. However, the extent of compensation depends on the change in∆Ψ. The mean Hp in the dry season was significant higher than that in the wet season
(p=0.002, Pairedttest,n=15), and both were independent from tree size (p >0.05). Equation (1) was applied when D=1 kPa to evaluate the seasonal change in ks
15
(Fig. 7b). As a result, the ks of both seasons was linearly fitted. The ks in the wet
season (29.1±13.1 mmol m−1MPa−1) was much higher than that in the dry season
(9.4±3.2 mmol m−1MPa−1). In addition, large trees had a much higher seasonal
vari-ation inks (p <0.01). As shown in Fig. 7b, the dry to wet ratio ofksdecreased rapidly
with tree growth and maintained constant when DBH>10 cm.
20
4 Discussion
4.1 Water use ofE. urophylla
From June 2012 to May 2013, the transpiration accumulated 462.42 mm (1.26 mm d−1), accounting for 21.3 % of the total rainfall. This value was much lower as a young
BGD
12, 10469–10510, 2015
Water use strategies in response to seasonal changes of
climatic factors
Z. Z. Zhang et al.
Title Page
Abstract Introduction
Conclusions References
Tables Figures
◭ ◮
◭ ◮
Back Close
Full Screen / Esc
Printer-friendly Version
Interactive Discussion
Discussion
P
a
per
|
Discussion
P
a
per
|
Discussion
P
a
per
|
Discussion
P
a
per
|
est than that in other areas of the world. Transpiration rates in Eucalyptus forests range from 0.5 to 6.0 mm d−1, mostly from 2.0 to 4.0 mm d−1 (Cunningham et al., 2009; Yunusa et al., 2010; Mitchell et al., 2009; Benyon et al., 2006). Even the same species, E. urophylla, in a savanna in Venezuela transpired more water than in our study (2.3 mm d−1) (Herrera et al., 2012). In general, transpiration may reach
maxi-5
mum values when the canopy is completely closed (Shi et al., 2012). The relatively low LAI (1.68±0.28) revealed a high-opening forest canopy in our study and might be the
reason for low transpiration.
ETwas promoted during the drought period compared to that during the wet season.
Meanwhile, a significant decrease in the soil water content (by 27.3 %) was observed
10
from September to October. A boundary analysis with the partitioning of the multiple effects of D, Q0 and SWC on stomatal conductance demonstrated that GSref-max was
enhanced by weakly increased SWC for some trees but depressed for the other, and
−m was also maintained constant along soil moisture gradients under different light
conditions (Fig. 4b). In agreement with our results, the reported higher transpiration
15
for aEucalyptus miniata in Australian savannas in the dry season also suggests that soil water availability is not limited during the extended dry season (O’Grady et al., 1999). A deep root system may explain the enhanced water during periods of de-creased soil water content. Eucalyptus species have a high photosynthetic capacity and WUE (Whitehead and Beadle, 2004), which are attributed to the high growing
20
speed of the root system under the ground. For example, fine roots have been ob-served down to a depth of 6 m in 1 year-old Brazilian eucalypt plantations (Christina et al., 2013). This observation implies that during a prolonged dry season, trees would obtain more water from the ground water with deep roots. Jarvis (1993) believed that trees in aerodynamically rough forests that are well coupled to the atmosphere
con-25
tinue their transpiration at the rate that is imposed by D under unlimited soil water availability. The promotedET in the dry season in our study can be explained by a low
decoupling coefficient (0.10±0.03, unpublished data) and an obvious increase inDby
BGD
12, 10469–10510, 2015
Water use strategies in response to seasonal changes of
climatic factors
Z. Z. Zhang et al.
Title Page
Abstract Introduction
Conclusions References
Tables Figures
◭ ◮
◭ ◮
Back Close
Full Screen / Esc
Printer-friendly Version
Interactive Discussion
Discussion
P
a
per
|
Discussion
P
a
per
|
Discussion
P
a
per
|
Discussion
P
a
per
|
other conditions. Zhou et al. (2004) reported a significantly decreased daily sap flux with decreased available soil water ofE. urophyllaplantation in the Nandu River water-shed on the Leizhou Peninsula, Guangdong Province, China, where the atmospheric conditions are very similar to those in our study. These authors believed that the soil type produces uncertainty in this relationship.
5
Despite the unlimited transpiration in the dry season, the rapidly decreased SWC in our research site revealed the weak ability of soil to hold water. With a low LAI for
Eucalyptus(Whitehead and Beadle, 2004), many studies demonstrated that plants un-derEucalyptustrees are sparsely distributed in some small swales, resulting in a high evaporation of the surface ground (Campinhos Jr., 1999). Similar low species diversity
10
was also observed in our stand. In addition, some litter on the ground enhanced the surface exposure. Combined with the prolonged transpiration, the indirect impact ofE. urophyllaon the regional water balance should not be ignored, especially in drought areas. To address the effect of transpiration on water balance, the water table level of
Eucalyptus grandis hybrid plantations in Brazil was observed and found to decrease
15
gradually before clear cutting 6 years after seeding and recover to the normal level 1–2 years after replanting (Almeida et al., 2007).
The nighttime sap flow is regarded as water recharge in the trunk and is vital for the plant water-use strategy, especially in a drought landscape (Fisher et al., 2007). The similarΨpre-nightandΨpre-dawnin the dry and wet seasons revealed the same demands
20
for water replenishment in the night. However, nocturnal sap flux (ET-NOC) in the wet
season (0.18±0.021 kg d−1) was almost twice that in the dry season (0.11±0.01 kg d−1).
The fast growth of E. urophylla may contribute to this quantitative difference, as the stem capacitance increased from October 2012 to April 2013 (Bohrer et al., 2005; Phillips et al., 2009). However, few trees can double in size in half a year, especially for
25
large trees. Thus, the difference inET-NOC was inferred to be caused by leaf
transpira-tion at nighttime. In fact, evidence was found by simultaneous leaf level gas exchange measurement and water potential measurement, demonstrating that stomatal conduc-tance in April and October was 63.1±31.0 and 33.6±5.0 mmol m−2s−1, respectively,
BGD
12, 10469–10510, 2015
Water use strategies in response to seasonal changes of
climatic factors
Z. Z. Zhang et al.
Title Page
Abstract Introduction
Conclusions References
Tables Figures
◭ ◮
◭ ◮
Back Close
Full Screen / Esc
Printer-friendly Version
Interactive Discussion
Discussion
P
a
per
|
Discussion
P
a
per
|
Discussion
P
a
per
|
Discussion
P
a
per
|
whenQ0=0 after pre-night and before the pre-dawn. A new finding was reported that
a subsequent increase in transpiration in the night 6 h after dusk was caused by the wood circadian clock regulation ofGS and Fd forEucalyptus grandis (Resco de Dios
et al., 2013). The authors concluded that the endogenous regulation ofGSis an
impor-tant driver of nighttime water flux under natural environmental variability. We believe
5
thatE. urophylla tended to transpire water continually after sufficient water recharge, especially when water was available in the soil. The same conclusion was proposed across a diversity of ecosystems and woody plant species by various methods, and a variety of explanations were considered plausible for the mechanism (Dawson et al., 2007).
10
4.2 Stomatal regulation in response to the leaf water potential
Stomatal closure is usually treated as direct response to the change in leaf water po-tential as related closely to cell turgor (Martorell et al., 2014). A significant decrease (by 22.4 %, Fig. 5) inGSwas observed accompanying a two-fold increase in∆Ψin the dry season. According to Eq. (2), ifGSis constant, a 234.4 % increase inDwill lead to
15
the same proportional enhancement ofELandET because the difference inTaandAL
between the two months was not significant (p >0.05). Thus, a 22.4 % decrease inGS
eventually led to a less increase inETandELby 159.5 %. The light-induced opening of
stomata enhances leaf transpiration, which consequently decreases the leaf water po-tential and therefore transpires more water along the SPAC system (Whitehead, 1998;
20
Lambers et al., 2008). Stomata are usually regarded as the key in the regulation of transpiration (Jarvis and McNaughton, 1986), while the role ofΨL has been less
em-phasized in most related studies (Aranda et al., 2005). In fact, the change in GS is
a response to alteredΨL(Hölttä and Sperry, 2014).
To understand the role ofΨL in the regulation ofE. urophyllatranspiration, we fitted
25
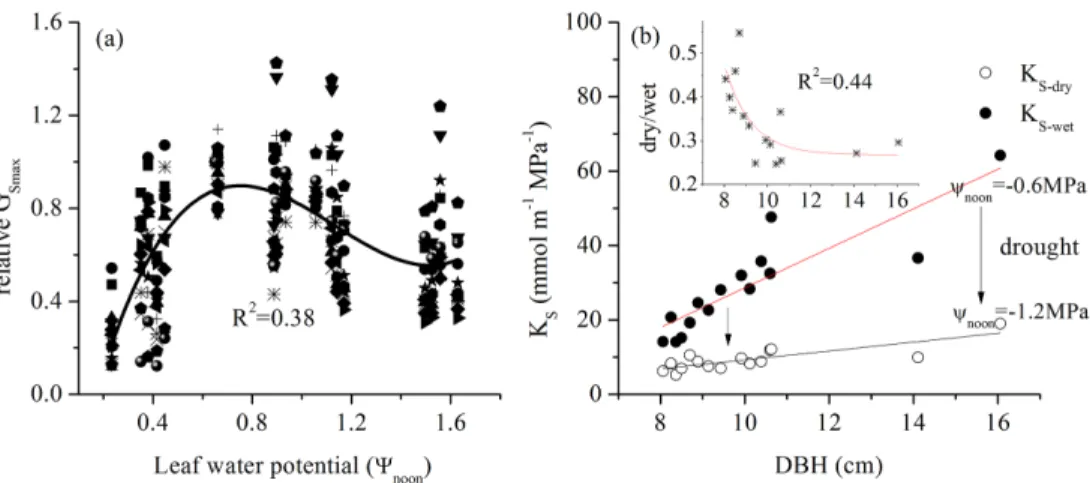
the relationship between leaf water potential at noon and the correspondingGSmax
(nor-malized by the measurement on 19 April 2013) of 15 trees.GSmaxwas positively related
BGD
12, 10469–10510, 2015
Water use strategies in response to seasonal changes of
climatic factors
Z. Z. Zhang et al.
Title Page
Abstract Introduction
Conclusions References
Tables Figures
◭ ◮
◭ ◮
Back Close
Full Screen / Esc
Printer-friendly Version
Interactive Discussion
Discussion
P
a
per
|
Discussion
P
a
per
|
Discussion
P
a
per
|
Discussion
P
a
per
|
ΨLis derived from theGSpromoted water loss on the leaf (Dow and Bergmann, 2014).
However, this value peaked and was maintained from−0.6 to−0.9 MPa for a while
be-fore a gradual decrease. This trend is consistent with the relationship betweenΨLand
GSacross 70 trees species (Klein, 2014). Of note, the stomata did not fully close when
ΨL reached the minimum value when ΨL=−1.6 MPa. In addition, GS ofEucalyptus
5
pauciflora gradually decreased with ΨL when ΨL>1.0 MPa (Martorell et al., 2014),
while a stomatal closure of 25 % of the maximum remained whenΨL=−1.6 MPa
ac-cording to the fitting line. This value was lower than our result (50–60 %, Fig. 7a). The twist ofGS from the max with decreasedΨLrevealed the beginning of “plastic”
adjust-ment to water loss, and the decreased slope of the fit curve indicated a less-sensitive
10
GS toΨL. Klein et al. (2014) reported that the minimum (maximum) value of ΨL can
reach−2.2 MPa (−1.0 MPa) whenGSdecreased to 50 % of the max. This result implies
lots of carbon assimilation for trees because less-sensitive stomata will take up more CO2 and lose more water at the same time. The 50–60 % of GSmax at−1.6 MPa
indi-cates thatE. urophyllawas more likely to maintain a balance between gas exchange
15
and water loss under a given leaf water potential.
4.3 Hydraulic conductivity and promoted water-use efficiency
A change inΨL depends on the leaf water loss and water recharge by sap flow. ΨL
decreases if water loss>water recharge. The stomata aperture showed less change when ΨL<−1.2 MPa. When ΨL decreased to −1.2 MPa in the dry season, ks
de-20
creased by 45.3 to 65.6 % from the wet season along tree size ranks (Fig. 7a). The decreasedΨLindicated a failed water recharge by sap flow whenGS was maintained
constant. Thus,ks will continue to decrease whenΨL<−1.2 MPa to drive the change
inΨL. Such a water-use strategy may contribute to a high water-use efficiency for E.
urophylla, especially under dry conditions because of a low water flux in the xylem and
25
high gas exchange on the leaves. We found thatGSdecreased by 22.4 % from the wet
to dry seasons, whileksdecreased by 45.3 to 65.6 %, much higher thanGS. If the tree
leaves in the wet and dry seasons have the same demand for CO2, the WUE will also
BGD
12, 10469–10510, 2015
Water use strategies in response to seasonal changes of
climatic factors
Z. Z. Zhang et al.
Title Page
Abstract Introduction
Conclusions References
Tables Figures
◭ ◮
◭ ◮
Back Close
Full Screen / Esc
Printer-friendly Version
Interactive Discussion
Discussion
P
a
per
|
Discussion
P
a
per
|
Discussion
P
a
per
|
Discussion
P
a
per
|
be higher in the dry season. This possibility had been demonstrated by some other studies, such that stable carbon isotopes in tree rings indicate an improved water-use efficiency and drought responses of a tropical dry forest tree species (Brienen et al., 2011). A large number of studies have demonstrated that moderate drought contributes to the high WUE of tree species of different ecosystems, including forest (Maseyk et al.,
5
2011), farmland (Sharma et al., 2015), desert (Liu et al., 2012), etc. However, an in-creased water-use efficiency does not necessarily lead to enhanced tree growth under xeric and mesic conditions (Lévesque et al., 2014) because stomata may not react ef-fectively under severe drought or limited soil water, resulting in the failure of hydraulic compensation and even death (Pita et al., 2003).
10
Here, we tried to determine the effect of tree size on plant physiology as proposed in the “Introduction”. The ratio of dry/wetksdecreases from 0.55 to 0.30 with increased
tree size. Because ΨL tended to remain constant when ΨL<−1.2 MPa, the greater
depression ofks for large trees indicated a higher WUE according to the above
dis-cussion. Otto et al. (2014) argued that dominant clonalEucalyptus grandis×urophylla
15
trees use water more efficiently; however, the underlying mechanisms that are respon-sible for higher WUE are unclear. We simulated the relationship betweenΨLand
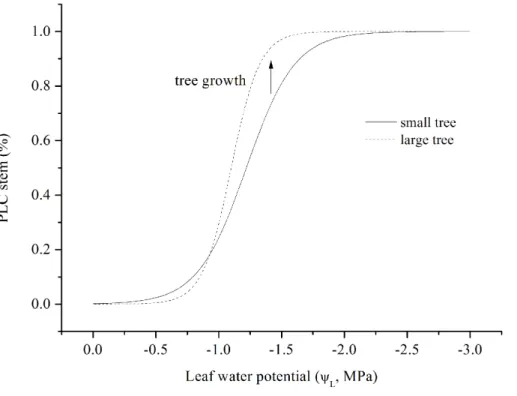
per-centage loss of hydraulic conductivity (PLC) for large and small trees, and a more sensitiveks was observed for the dominant tree (Fig. 8). These results seem to shed
some light on the mechanisms under the high WUE of the dominant trees.
20
It was also implied that large trees are more vulnerable in the face of drought stress. An increased Huber value as trees grew in our study revealed the demands for en-hancing the ability of water transportation, while the fast-growing speeds in tree height counteracted this type of hydraulic compensation. For a planted forest where resource-ful stress is limited, more investment will be allocated to tree height growth. The
re-25
source allocations ofE. urophyllaeventually maintained a constantHp that was
BGD
12, 10469–10510, 2015
Water use strategies in response to seasonal changes of
climatic factors
Z. Z. Zhang et al.
Title Page
Abstract Introduction
Conclusions References
Tables Figures
◭ ◮
◭ ◮
Back Close
Full Screen / Esc
Printer-friendly Version
Interactive Discussion
Discussion
P
a
per
|
Discussion
P
a
per
|
Discussion
P
a
per
|
Discussion
P
a
per
|
trees of the same height in a naturalEucalyptus marginata take five times longer to grow compared to those growing on a restored site. Obviously, we concluded that the restored forest was more vulnerable with a high growing speed.
In addition to tree size and drought, other climatic factors among the climate changes (including nitrogen deposition and elevated CO2, among others) were also reported
5
to affect WUE (Vaidya et al., 2014; Cruz et al., 2014; Novriyanti et al., 2012). Ward et al. (2013) proposed that the decreased stomatal conductance under these condi-tions is attributed to the high WUE. However, concern regarding the change inkswas
less emphasized. Domec et al. (2010) argued that some species under elevated CO2
altered the hydraulic pathway, most likely structurally, affecting the liquid phase
trans-10
port and consequently reducing stomatal conductance. This argument contrasts with previous studies focusing on a direct stomatal response to CO2. Thus, we proposed
that hydraulic changes in sap wood contribute greatly to enhanced WUE under most conditions.
4.4 Elastic fluctuating isotonicity with radiation
15
The−maveraged 0.58±0.01 and 0.53±0.007 (Fig. 3) in April and October,
respec-tively. Oren et al. (1999) reported that as long as stomata regulate the leaf potential near a constant value, a slope near 0.6 is expected. This variation depended on the
Drange, boundary layer conductance (gbl), and changes in hydraulic conductance
as-sociated withD. To determine the effect of the D range, we selected the data shown
20
in Fig. 3 by the criterion that D ranged from 1 to 2 kPa for each light level to perform a boundary analysis. Then,−mof the 15 trees at each light level was compared with
the results that were derived from all of the data. As a result, the relationship between
−mandQin the wet and dry seasons was not significantly different from that analyzed
above (p=0.43 and 0.14, respectively, ANOVA). Characterized by narrow leaves, the
25
gblof theE. urophyllastand in April and October was 930.1 and 1149.8 mmol m− 2
s−1, respectively, which led to a ratio ofgbl/ GSof more than 2 in October. Oren et al. (1999)
BGD
12, 10469–10510, 2015
Water use strategies in response to seasonal changes of
climatic factors
Z. Z. Zhang et al.
Title Page
Abstract Introduction
Conclusions References
Tables Figures
◭ ◮
◭ ◮
Back Close
Full Screen / Esc
Printer-friendly Version
Interactive Discussion
Discussion
P
a
per
|
Discussion
P
a
per
|
Discussion
P
a
per
|
Discussion
P
a
per
|
argued that the−mis negatively related to thegbl/GSand equals 0.55 when thegbl/GS
is 10, which is the case of our study.
Of note, GSref was negatively related to Q and ranged from 0.32 to 0.83 in the dry
season and 0.22 to 1.10 in the wet season for the 15 trees (Fig. 4b), even though no SWC effect was found. An ANOVA analysis of −m at different light levels indicated
5
a significant seasonal difference in D ranging 1–2 kPa (p <0.01). i.e., the sensitivity was not maintained constant even within a single day when the light intensity varied substantially. The fact that−mincreases rapidly under low light conditions may be due
to the closed stomata in the morning. Oren et al. (1999) suggested that low light may be expected to cause deviations in−mfrom the predicted slope (0.6) and that stomata
10
continue to regulate the leaf water status even under non-saturating light. As the low-light data were removed (Q <200 µmol m−2s−1), a linear decrease in−mwith radiation
was observed (Fig. 4b). To qualify the effect of max radiation in different locations on the stomatal sensitivity, we analyzed the relationship between the maxQ and mean
−mwithin thatQrange (Fig. 9).
15
The average−mof each light range linearly decreased with the increase in the max
light condition. Schäfer et al. (2000) assessed the importance of the mechanism for sustaining gas exchange in tall trees by directly relating−mtoGSref, and these authors
concluded that tall trees have lower GSref sensitivity than short trees. These authors
argued that the lower stomatal sensitivity in tall trees ensures a more stable carbon
20
uptake rate over the wide diurnal range of D and may serve to support carbon ex-change. Combining the tree size effect as proposed above, it was hypothesized that less-sensitive stomata causing much more access to light on the leaves may be an-other strategy for plants to improve WUE. However, a lowerGSrefof large trees was not
observed in our study, which may be the consequence of a highly opened canopy, as
25
BGD
12, 10469–10510, 2015
Water use strategies in response to seasonal changes of
climatic factors
Z. Z. Zhang et al.
Title Page
Abstract Introduction
Conclusions References
Tables Figures
◭ ◮
◭ ◮
Back Close
Full Screen / Esc
Printer-friendly Version
Interactive Discussion
Discussion
P
a
per
|
Discussion
P
a
per
|
Discussion
P
a
per
|
Discussion
P
a
per
|
inD, and compared to dominant trees in the forest, plants growing under the canopy will be inversely more sensitive as light is more precious there (Fig. 9). However, there is no doubt that light plays a significant role in controlling the stomata response toD. Obviously, further studies are needed for revealing the mechanism within this relation-ship.
5
Giving the importance ofGSreffor trees to regulate water loss under severe drought, it
was predictable that stomata should be more sensitive during the drought period to pre-vent excessive water loss, asks suffered a substantial decrease. Bourne et al. (2015)
observed a linear relationship between the stomatal sensitivity toDand the aridity in-dex for fiveEucalyptusand concluded that the stomata are more sensitive to drought
10
and play a selective role in constraining the water-use response among the five Euca-lyptusspecies. However, our results, even thoughGSdecreased by 22.4 % from the wet
to the dry season, did not support this result, as the seasonal difference was caused by the difference ingbl/GS. One of the possibilities may be the relatively high SWC at
our research site. As presented by Martorell et al. (2014), the leaf water potential ofE.
15
pauciflorareached a minimum of−3.0 MPa. Because such an extreme drought stress
was not found in our stand, we cannot verify this possibility under field conditions. An-other reason may be related to the same demand for carbon assimilation because the light conditions were similar in both the dry and wet seasons (Schäfer et al., 2000).
5 Conclusions
20
a. The transpiration of E. urophylla was weakly enhanced by the increase in soil water content and eventually offset by the decrease inD during the wet season. Our results also revealed a water compensatory mechanism ofE. urophyllawhen
ETwas relatively lower in the wet season by nighttime transpiration, which partially
compensated for the lower water use in the daytime by a proportion of 4.51 %.
25
BGD
12, 10469–10510, 2015
Water use strategies in response to seasonal changes of
climatic factors
Z. Z. Zhang et al.
Title Page
Abstract Introduction
Conclusions References
Tables Figures
◭ ◮
◭ ◮
Back Close
Full Screen / Esc
Printer-friendly Version
Interactive Discussion
Discussion
P
a
per
|
Discussion
P
a
per
|
Discussion
P
a
per
|
Discussion
P
a
per
|
b. The combined regulation of water use by decreased stomatal and hydraulic con-ductances kept the leaf water potential from hydraulic failure. However, more dra-matically decreasedksmay shed some light on the mechanism of the high WUE
ofEucalyptuswhen exposed to drought conditions.
c. Our results verified the hypothesis that trees of different sizes have different
strate-5
gies to respond to climate factors (D,Q0, and SWC). As a tree grows,ksis more
sensitive to water loss. Because large trees suffered more water loss than small trees did, the rapid response ofkswill potentially improve the WUE.
d. The decrease in stomatal sensitivity of GSref to D along the radiation gradient
accounted for another aspect of “plastic characteristics” forE. urophylla. It is
pre-10
dicted that trees growing under high light conditions will ensure a more stable carbon uptake rate. However, the sensitivity did not decrease significantly with decreasedksas expected.
The Supplement related to this article is available online at doi:10.5194/bgd-12-10469-2015-supplement.
15
Acknowledgements. This research Supported by the National Nature Science Foundation of
China (41030638, 31170673, 41275169), the Provincial Nature Science Foundation of Guang-dong (S2012020010933, 2014A030313762) and the CAS/SAFEA International Partnership Program for Creative Research Teams.
References
20
Almeida, A. C., Soares, J. V., Landsbergc, J. J., and Rezende, G. D.: Growth and water balance
ofEucalyptus grandishybrid plantations in Brazil during a rotation for pulp production, Forest
BGD
12, 10469–10510, 2015
Water use strategies in response to seasonal changes of
climatic factors
Z. Z. Zhang et al.
Title Page
Abstract Introduction
Conclusions References
Tables Figures
◭ ◮
◭ ◮
Back Close
Full Screen / Esc
Printer-friendly Version
Interactive Discussion
Discussion
P
a
per
|
Discussion
P
a
per
|
Discussion
P
a
per
|
Discussion
P
a
per
|
Ambrose, A. R., Sillett, S. C., and Dawson, T. E.: Effects of tree height on branch hydraulics, leaf structure and gas exchange in California redwoods, Plant Cell Environ., 32, 743–757, doi:10.1111/j.1365-3040.2009.01950.x, 2009.
Anderegg, W. R. L., Berry, J. A., Smith, D. D., Sperry, J. S., Anderegg, L. D. L., and Field, C. B.: The roles of hydraulic and carbon stress in a widespread climate-induced forest die-off, P.
5
Natl. Acad. Sci. USA, 109, 233–237, doi:10.1073/pnas.1107891109, 2012.
Aranda, I., Gil, L., and Pardos, J. A.: Seasonal changes in apparent hydraulic conductance and their implications for water use of European beech (Fagus sylvaticaL.) and sessile oak [
Quer-cus petraea(Matt.) Liebl] in South Europe, Plant Ecol., 179, 155–167,
doi:10.1007/s11258-004-7007-1, 2005.
10
Aranda, I., Forner, A., Cuestaa, B., and Valladaresb, F.: Species-specific water use by forest tree species: from the tree to the stand, Agr. Water Manage., 114, 67–77, doi:10.1016/j.agwat.2012.06.024, 2012.
Ashton, D. H.: The seasonal growth ofEucalyptus regnansF. Muell, Aust. J. Bot., 23, 239–252, doi:10.1071/BT9750239, 1975.
15
Benyon, R. G., Theiveyanathan, S., and Doody, T. M.: Impacts of tree plantations on ground-water in south-eastern Australia, Aust. J. Bot., 54, 181–192, doi:10.1071/BT05046, 2006. Binkley, D. and Laclau, J. P.: Why one tree grows faster than another: patterns of light use and
light use efficiency at the scale of individual trees and stands, Forest Ecol. Manag., 288, 1–4, doi:10.1016/j.foreco.2012.08.009, 2013.
20
Bleby, T. M., Colquhoun, I. J., and Adams, M. A.: Hydraulic traits and water use ofEucalyptus
on restored versus natural sites in a seasonally dry forest in southwestern Australia, Forest Ecol. Manag., 274, 58–66, doi:10.1016/j.foreco.2012.02.029, 2012.
Bohrer, G., Mourad, H., Laursen, T. A., Drewry, D., Avissar, R., Poggi, D., Oren, R., and Katul, G. G.: Finite-element tree crown hydrodynamics model (FETCH) using porous
me-25
dia flow within branching elements – a new representation of tree hydrodynamics, Water Resour. Res., 41, W11404, doi:10.1029/2005WR004181, 2005.
Bourne, A. E., Haigh, A. M., and Ellsworth, D. S.: Stomatal sensitivity to vapour pres-sure deficit relates to climate of origin in Eucalyptus species, Tree Physiol., 35, 266–278, doi:10.1093/treephys/tpv014, 2015.
30
Brienen, R. J. W., Wanek, W., and Hietz, P.: Stable carbon isotopes in tree rings indicate im-proved water use efficiency and drought responses of a tropical dry forest tree species, Trees, 25, 103–113, doi:10.1007/s00468-010-0474-1, 2011.