“
Taller and Shorter
”
: Human 3-D Spatial
Memory Distorts Familiar Multilevel Buildings
Thomas Brandt1,2,6,7*, Markus Huber1,5, Hannah Schramm1,5, Günter Kugler1, Marianne Dieterich2,3,4, Stefan Glasauer1,2,3,5,6
1Clinical Neuroscience, Ludwig-Maximilians-University Munich, Germany,2German Center for Vertigo and Balance Disorders—IFBLMU (DSGZ), Ludwig-Maximilians-University Munich, Germany,3Department of Neurology, Ludwig-Maximilians-University Munich, Germany,4Munich Cluster for Systems Neurology (SyNergy), Munich, Germany,5Center for Sensorimotor Research; Ludwig-Maximilians-University Munich, Germany,6Bernstein Center for Computational Neuroscience; Ludwig-Maximilians-University Munich, Germany,7Hertie Foundation, Frankfurt a.M., Germany
Abstract
Animal experiments report contradictory findings on the presence of a behavioural and neu-ronal anisotropy exhibited in vertical and horizontal capabilities of spatial orientation and navigation. We performed a pointing experiment in humans on the imagined 3-D direction of the location of various invisible goals that were distributed horizontally and vertically in a familiar multilevel hospital building. The 21 participants were employees who had worked for years in this building. The hypothesis was that comparison of the experimentally deter-mined directions and the true directions would reveal systematic inaccuracy or dimensional anisotropy of the localizations. The study provides first evidence that the internal represen-tation of a familiar multilevel building was distorted compared to the dimensions of the true building: vertically 215% taller and horizontally 51% shorter. This was not only demon-strated in the mathematical reconstruction of the mental model based on the analysis of the pointing experiments but also by the participants’drawings of the front view and the ground plan of the building. Thus, in the mental model both planes were altered in different direc-tions: compressed for the horizontal floor plane and stretched for the vertical column plane. This could be related to human anisotropic behavioural performance of horizontal and verti-cal navigation in such buildings.
Introduction
Most swimming and flying species move and navigate in both the horizontal and vertical tions within their 3-D environment. They use path integration, continuously integrating direc-tion and distance to envisaged goals. The honeybee integrates image modirec-tion across its eyes [1] Fish store horizontal and vertical components separately in their internal representation of space [2]. The vertical component may be less critical for survival in ground-based animals like rats or dogs compared to, e.g., bats [3]. However, animal experiments report contradictory findings as to whether there is a behavioral and neuronal anisotropy [4] exhibited in vertical OPEN ACCESS
Citation:Brandt T, Huber M, Schramm H, Kugler G, Dieterich M, Glasauer S (2015)“Taller and Shorter”: Human 3-D Spatial Memory Distorts Familiar Multilevel Buildings. PLoS ONE 10(10): e0141257. doi:10.1371/journal.pone.0141257
Editor:Elizabeth J Coulson, University of Queensland, AUSTRALIA
Received:August 11, 2015
Accepted:October 6, 2015
Published:October 28, 2015
Copyright:© 2015 Brandt et al. This is an open access article distributed under the terms of the
Creative Commons Attribution License, which permits unrestricted use, distribution, and reproduction in any medium, provided the original author and source are credited.
Data Availability Statement:All relevant data are within the paper and its Supporting Information files (supplementary table 3).
Funding:This work was supported by the German Federal Ministry of Education and Research Grants 01GQ0440 (BCCN), 01EO0901 (IFB DSGZ); Hertie Foundation.
and horizontal capabilities of spatial orientation and navigation, particularly with respect to the comparability of available reference frame cues [5]. Evidence was reported that rats give priority to the vertical dimension of space when relevant for orientation [6]. On the other hand, it has been shown that they exhibit a behavioural anisotropy when distributing their time freely between vertical and horizontal movements; they seem to prioritize the horizontal in both foraging and detour tasks [7]. The representation of the 3-D world is based on the activity of place cells in the hippocampus (information on position [8]), grid cells in the ento-rhinal cortex (information on distance [9,4]), and head direction cells (information on direc-tion [10]). Rats climbing a wall showed impaired path integration by grid cells in the vertical domain [10]. The authors argue that these results can be simply accounted for by considering the different reference frames used by the rat. They present experimental evidence of the capa-bility of rats to orient and navigate in the vertical domain [11].
Our current study on 3-D orientation and spatial memory in humans was stimulated by an accidental observation made in dogs living for several days with their owners in a multilevel hotel [12]. The dogs had difficulties finding the right floor but correctly ran to the correspond-ing“right door”on the“wrong floor”. Our main question was whether humans also show an anisotropy of spatial memory for horizontal and vertical dimensions in a familiar multilevel building, i.e., a huge 15-floor university hospital (Fig 1). This can be investigated by two differ-ent experimdiffer-ental approaches: by a real navigation task in a familiar multilevel building [13] or by imagining and pointing to different landmarks within this building. Both experimental approaches have been shown to be complementary rather than equivalent and to yield different results in the horizontal plane of a virtual town [14]. Here we chose the second approach and designed a pointing experiment on the imagined 3-D direction of the location of various well-known but invisible goals that were distributed horizontally and vertically. The participants were employees who had worked for years in the building and were familiar with the localiza-tion of all targets. The hypothesis was that comparison of the assumed and the true direclocaliza-tions might reveal systematic inaccuracy or dimensional anisotropy of localizations. Further, these localizations would allow the construction of a virtual 3-D model of our spatial memory and the internal representation of the building in our mind.
Materials and Methods
All participants had worked regularly at the University Clinic for at least 5 years. They gave their verbal consent to participate in this study. They were just asked to participate in a direc-tion-pointing experiment, which did not require written consent and required the participants to be naïve as to the aims and procedure of this psychophysical experiment. The consent was documented in the trial protocol. The experiment was approved by the Institutional Review Board of the ethics committee of the Ludwig-Maximilians University Munich in accordance with the Helsinki Declaration.
Participants
Design and procedure
All experiments were conducted in the same office where the enclosing walls prevented visibil-ity of the targets (see Figs1and3for location). The examinee position for the pointing experi-ments was on the right side of the ground floor; it was chosen because this was a familiar meeting room. An optical tracking system (Qualisys, 8 cameras, frame rate 200 Hz) was used to track the pointing movements. Participants wore infrared reflective markers attached to their right index finger, right hand wrist and elbow, left and right shoulders, and forehead and faced along the short axis of the main building. The tracking system was installed to follow the whole movement range of all participants. All experiments were done under conditions of open eyes and a brightly illuminated test room.
For the calibration procedure the participants were instructed as follows:“In the first part of the experiment we will tell you at which corner of the room you have to look and point. Stand still, with lowered arms. Then point at the mentioned corner for 2 seconds, and then lower your arm.”The corners were defined as lower-right, upper-right, lower-middle, upper-middle, lower-left and upper left corner, corresponding to the heading position of the participants.
Pointing experiment: Instructions for the actual experiment were“In the second part, we will mention 15 various locations in the hospital such as wards, entrance, lecture halls in differ-ent horizontal directions and on differdiffer-ent vertical levels (Table 1). The proportion of more ver-tically placed targets to targets placed more horizontally was balanced. Please point and look toward these targets. Imagine that a laser-pointer is attached to your index finger and its beam is to be directed to the assumed location of the mentioned target in the hospital. If you think you are pointing to the correct place, keep gaze and arm steady for 2 seconds and then lower your arm for the next condition.”The targets were distributed over the whole building (coordi-nate ranges along the long axis of main building -270 m to 226 m, along the short axis 2 m to 236 m, along the vertical axis -8 m to 38 m; absolute target distances 11 m to 358 m), and all participants were familiar with the locations (Fig 1).
Drawings: After the pointing experiment, participants were asked to draw a schematic front view and ground plan of the main building. The drawings were used to compare ratios of width, height, and length of the building with those derived from pointing (see sections below).
Fig 1. Pointing locations.Pointing locations as seen from above overlaid on an architectural ground plan of the hospital building. Note that the targets were not placed more toward the corners of the building but rather were distributed all over the building.
Data processing
The recorded trajectories of the markers were labelled according to their attached joint offline in the QTM (Qualisys Tracking Manager) software. The end of each pointing episode was determined when the position of the wrist marker began to move downwards minus 0.2 s. The recorded and labelled data were exported to Matlab for further analysis. One hundred data points (0.5 s) before the end of a pointing episode were accumulated and averaged to calculate the pointing direction. Pointing direction was determined as follows (for methodological details see [15,16]). First, the mean error of the pointing direction toward the calibration cor-ners was determined by using two different methods:
1. the direction starting at the mid-eye towards the pointing finger,
2. the direction defined by the shoulder towards the pointing finger.
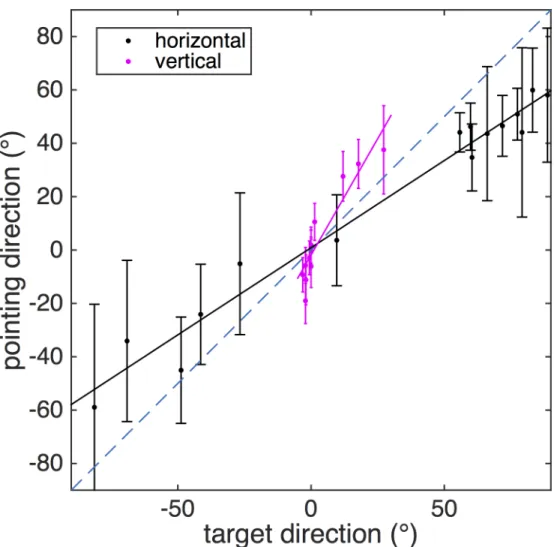
Fig 2. Pointing directions.Horizontal (azimuth, black dots) and vertical (elevation, red stars) mean pointing directions (error bar gives circular SD) plotted over mean target direction. Accurate pointing directions would agree with the dashed blue line. Orientation of the participants during the pointing task coincided with the short axis of the main building (tall red building part inFig 3) and with zero azimuth angle. Note that horizontal pointing angles were on average smaller than target angles, indicating a reduction of perceived length of the building, while the opposite was the case for vertical angles, indicating an overestimation of the building’s height.
The errors for the two methods were calculated for each participant and the method with the smallest error was used to define the participant’s individual pointing method. All calcula-tions were done using Matlab Release 2013 or higher (Mathworks, USA) and its Optimization Toolbox.
Calibration
The measured pointing directions to the corners of the room were used to calibrate the point-ing angles of the experiment. Since the exact position of each corner relative to the head of the participant was known, it was possible to calculate the hypothetically exact pointing direction to the corners. The pointing directions are expressed in azimuth (Azhorizontal) and elevation (Elvertical) angles. The difference between an exact pointing direction and the measured pointing direction was used to calculate a calibration matrixMβ, according to the ordinary Fig 3. 3-D model of the hospital building.A: original building. B: building reconstructed from the averaged pointing directions of the participants assuming a linear transformation of the building. C: building reconstructed from pointing but allowing for linearandquadratic transformation. Green flag indicates the position of the participants in the building. Red: main building. Note that the mental model appears to be compressed for the horizontal floor plane, stretched for the vertical column plane, and curved toward the subjective straight ahead.
least squares estimation:
Mb¼ ðD
TDÞ 1
DTP
c ð1Þ
whereDis a 3xN matrix containing the difference between exact and measured pointing angles (difference ofAz, difference ofEl) and a vector of ones, which represents an offset.Pcis a matrix containing all measured pointing angles. The i-th column ofPcis a vector containing the pointing angles for the i-th target.
The calibration matrix allowed adjustment of the pointing angles for the experiment with:
~p0 ¼M
b~pm ð2Þ
wherep!mis a vector containing the measured pointing angles during the experiment and~p0
contains the calibrated pointing angles. The pointing angle was transformed into a unit vector with the appropriate pointing direction for further processing.
Data analysis
Pointing angles indicated by azimuth and elevation were averaged over targets or subjects using circular statistics (CircStat toolbox for Matlab [17]).
To further understand the errors in pointing angles, a transformed building that best matched the subjects’mean pointing directions was calculated. An optimization procudure (Matlab function lsqnonlin) was used to search for a linear transformationTof the normalized target directions~t
iderived from the target coordinates that would minimize the angles between
the normalized average pointing directions~p
i and the transformed and normalized directions
of the targets~t0
i¼Tt
!
i so that
X
i
arccosð~p
i T~tiÞ ¼min ð3Þ
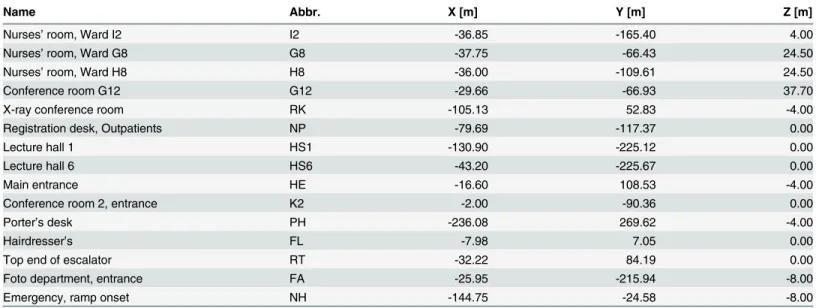
The linear transformation represented by the transformation matrixTallowed for rotation, shearing, and scaling. By adding a quadratic term, a second transformation function was Table 1. Names and coordinates of the target positions relative to the location of the participant.
Name Abbr. X [m] Y [m] Z [m]
Nurses’room, Ward I2 I2 -36.85 -165.40 4.00
Nurses’room, Ward G8 G8 -37.75 -66.43 24.50
Nurses’room, Ward H8 H8 -36.00 -109.61 24.50
Conference room G12 G12 -29.66 -66.93 37.70
X-ray conference room RK -105.13 52.83 -4.00
Registration desk, Outpatients NP -79.69 -117.37 0.00
Lecture hall 1 HS1 -130.90 -225.12 0.00
Lecture hall 6 HS6 -43.20 -225.67 0.00
Main entrance HE -16.60 108.53 -4.00
Conference room 2, entrance K2 -2.00 -90.36 0.00
Porter’s desk PH -236.08 269.62 -4.00
Hairdresser’s FL -7.98 7.05 0.00
Top end of escalator RT -32.22 84.19 0.00
Foto department, entrance FA -25.95 -215.94 -8.00
Emergency, ramp onset NH -144.75 -24.58 -8.00
generated to allow for a non-linear distortion. The same approach was used to calculate an individual transformation matrix for each participant corresponding to his or her respective pointing directions.
For 3-D modelling the ground plan of the building (Fig 1) was used to create a 3-D model with the AutoCAD software (Autodesk Inc., USA). The previously calculated general linear transformation was applied to the 3-D model using Matlab, and the aspect ratios of the result-ing main buildresult-ing of the new model were determined by calculatresult-ing its length, height, and width. To generate the figures, the transformed model was imported back to AutoCAD. The aspect ratios of length-height (L/H) and length-width (L/W) determined from the individual transformation matrices were then compared to the corresponding aspect ratios derived from the participants’drawings.
Results
According to the calibration procedure, approximately 57% of the participants (12 of 21) used the eye-finger pointing strategy. The average unsigned pointing error during the calibration procedure was 8.6±1.2°.
Averaged horizontal and vertical pointing directions over all subjects are shown inFig 2
(seeS1 Filefor individual data). Horizontal pointing directions were smaller than true target directions, indicating a compression of the perceived building along its long axis. In contrast, vertical pointing directions were larger, as if the height of the building had been overestimated. To quantify this relation the respective linear regressions were calculated for each subject. The average slope of horizontal pointing directions was 0.63±0.28 (including two outliers with neg-ative slopes), for vertical pointing directions 1.73±0.48. Both average slopes are significantly different from unity (accurate pointing) and from each other (t-tests, all p<0.0001).
From the pointing directions, it was estimated how the building would look, if pointing were accurate on average. To this end, a linear or linear-quadratic transformation was applied to the target coordinates, minimizing the difference between the transformed target directions and average pointing directions. The transformed buildings are shown inFig 3together with the original building for comparison. The linear transformation was then applied to the data of each participant in order to derive individual transformations. From the transformed buildings the aspect ratios of length-height and length-width were calculated and averaged.Fig 4 com-pares these values with the true aspect ratios and those derived from the drawings of the partic-ipants (seeTable 2for values). A repeated measures ANOVA of the ratios (factor 1: L/H or L/ W; factor 2: from pointing or from drawing) shows a highly significant effect of L/H vs. L/W (F(1,20) = 47.7, p<0.0001) but no effect of drawing vs. pointing (F(1,20) = 3.17, p = 0.09 n.s.)
or interaction between the two factors.
Discussion
Our current understanding of neural representation of the surrounding 3-D space is based on the assumption that cognitive maps are continuously encoded by place cells, grid cells, and head direction cells [18]. The formation of such cognitive maps depends on a cascade of increasingly complex associative processes involving object location, subject location, and then
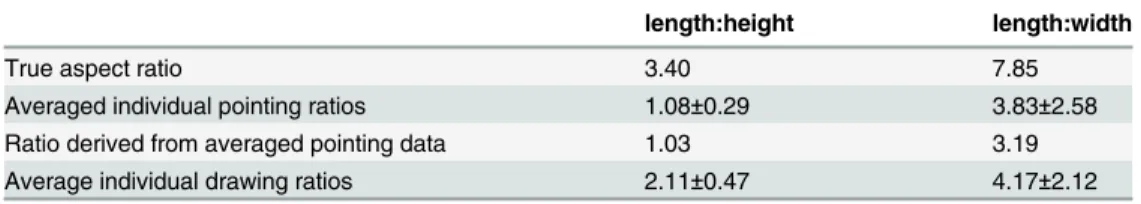
Table 2. Aspect ratios of the main building (see alsoFig 3).
length:height length:width
True aspect ratio 3.40 7.85
Averaged individual pointing ratios 1.08±0.29 3.83±2.58
Ratio derived from averaged pointing data 1.03 3.19
Average individual drawing ratios 2.11±0.47 4.17±2.12
doi:10.1371/journal.pone.0141257.t002
Fig 4. Aspect ratios of the main building.A: Front view (top row) and top view (bottom row) of the main building. Left column: true proportions of the building. Middle column: Transformed building according to averaged pointing directions. Right column: Transformed building according to averaged aspect ratios from participants’drawings. Note that depictions are shown at equal height. B: Bar graph of aspect ratios. Left length:height, right: length:width. Left bar (light gray): true aspect ratio of the building, middle bar (gray): averaged ratios of transformed buildings according to individual pointing directions, right bar (dark gray): ratio taken from individual drawings. Error bars denote standard deviation.
the formation of building blocks for learning temporo-spatial sequences [19]. Orientation and navigation depend on the interplay of various cognitive processes [20]. One such process is landmark-based piloting, i.e., (1) identify individual landmarks, (2) use these landmarks to determine your (?) current position and heading, (3) access long-term knowledge about the spatial relationships between locations, and (4) use this knowledge to plan a route to the navi-gational goal [21]. The parahippocampal place area seems to be critical for landmark recogni-tion, the retrosplenial/medial parietal region, for localization and orientarecogni-tion, and both medial temporal lobe and retrosplenial/medial parietal lobe regions, for long-term spatial knowledge [21].
Furthermore, the posterior hippocampus plays a significant role in both the encoding and retrieval of spatial memory, orientation, and navigation [22]. It has different functions than the anterior hippocampus; whereas the posterior hippocampus is mainly involved in cognitive functions, the anterior is more involved in emotional processes [23]. There is also a hippocam-pal separation for processing vestibular inputs (anterior hippocampus) and visual inputs (posterior hippocampus) [24]. The separation of vestibular and visual information in the hip-pocampal formation has a twofold functional consequence: missing input from one system may be partially substituted by the other, and the task-dependent sensorial weight can be shifted to the more reliable modality for navigation [24]. The latter is reflected by the structural and functional plasticity of the hippocampal formation observed in professional dancers and slackliners. They have smaller anterior (vestibular) volumes as a result of long-term suppres-sion of destabilizing vestibular input, but larger posterior (visual) volumes as a result of increased utilization of visual cues for balance [25].
There seem to be several separate vestibular pathways connecting the hippocampus with the parietal cortex to subserve spatial learning and spatial memory [26]. The posterior parietal cor-tex and the parahippocampal place area are believed to integrate multisensory spatial represen-tation and the planning of goal-directed movements [27,28,22]. It is not yet fully understood how the neural mechanisms in the parahippocampal place area, retrosplenial cortex, and medial temporal lobe interact to form a global representation of the 3-D world [21].
The resulting horizontally and vertically distorted internal representation is supported by the subjects’drawings of the front view and ground plan of the building. The drawings, i.e., the imagination of the building, confirm the 3-D reconstruction: both planes are altered differently (compressed for the horizontal floor plane and stretched for the vertical column plane). While the compression observed in the horizontal plane can be related to general effects in magnitude estimation such as the regression effect [32], the vertical stretching shows quite the opposite tendency. Questions arise as to how to interpret these results with respect to the anisotropy of a weaker performance of navigation in the vertical versus the horizontal dimension, which was described in rodents [4,7], dogs [12], and humans [13]. PET measurements in the latter study showed increased glucose metabolism in the right hippocampus, bilateral retrosplenial cortex, and pontine tegmentum during horizontal navigation [13]. In contrast, vertical navigation acti-vated the bilateral hippocampus and the vestibular insular cortex.
An anisotropic navigation performance may be due to the different cues provided during way finding on a horizontal floor versus the traversing of the building vertically by a stairwell. The stairwell provides fewer landmarks during locomotion and predominantly relies on path integration, i.e., the performed path is compared with the internal representation of the path along the floors. The horizontal plane provides many more landmarks on the way to the desti-nation. These landmarks may allow us to re-compute the distance to the destination, which may correct for the shorter imagined distance of the initial route plan. This may be related to the specific strategies for navigating multilevel buildings: the direction strategy, which relies on routes that first head towards the horizontal position of the goal and a floor strategy that relies on routes that first head towards the vertical position of the goal [29]. These authors found that experienced subjects preferred the floor strategy, which also resulted in a better way-finding performance.
The imagined building in our study appeared to be convexly curved. This impression may be due to the eccentric position of the participant which causes a bias of the most distant targets inhorizontal directions toward the subjective straight ahead (seeFig 3).
The finding of our current study that an internal representation of a familiar multilevel building is distorted raises several questions. For example, does this representation depend on the subject’s position (viewpoint) and if so, how? Does the shape of the representation change during true locomotion or imagined locomotion within the building? This is relevant because of the so-called‘Event-Horizon-Effect’. Previous research using virtual or real environments has revealed that walking through doorways causes a location-updating effect with a decline in memory, suggesting a segmentation of internal representations of space [33,34]. This is also reflected by grid cell behaviour in rat experiments in which the firing pattern was initially com-partmentalized but after longer experience in the same environment reflected the connected environments [35].
Supporting Information
S1 File. Pointing data.Supplementary information contains a semicolon-delimited CSV data file with pointing data (in deg) generated by Matlab. Each row contains data of one participant (15 columns horizontal angles and 15 columns vertical angles, one column for each target, same order as inTable 1). Missing values are denoted by the string 'NaN'.
Acknowledgments
We thank J. Benson for copyediting the manuscript.
Author Contributions
Conceived and designed the experiments: TB MH HS GK MD SG. Performed the experiments: TB MH GK. Analyzed the data: TB MH HS GK SG. Wrote the paper: TB MH MD SG.
References
1. Dacke M, Srinivasan MV. Honeybee navigation: distance estimation in the third dimension. J Exp Biol. 2007; 210: 845–853. PMID:17297144
2. Burt de Perera T, Holbrook RI. Three-dimensional spatial representation in freely swimming fish. Cogn Process. 2012; 13: S107–S111. doi:10.1007/s10339-012-0473-9PMID:22915259
3. Ulanovsky N. Neuroscience: How is three-dimensional space encoded in the brain? Curr Biol. 2011; 21: R886–R888. doi:10.1016/j.cub.2011.09.031PMID:22075427
4. Hayman R, Verriotis MA, Jovalekic A, Fenton AA, Jeffery KJ. Anisotropic encoding of three-dimen-sional space by place cells and grid cells. Nat Neurosci. 2011; 14: 1182–1188. doi:10.1038/nn.2892 PMID:21822271
5. Taube JS, Shinder M. On the nature of three-dimensional encoding in the cognitive map: Commentary on Hayman, Verriotis, Jovalekic, Fenton, and Jeffery. Hippocampus. 2012; 23: 14–21. doi:10.1002/ hipo.22074PMID:22996337
6. Grobety MC, Schenk F. Spatial learning in a three-dimensional maze. Anim Behav. 1992; 43: 1011– 1020.
7. Jovalekic A, Hayman R, Becares N, Reid H, Thomas G, Wilson J, et al. Horizontal biases in rats’use of three-dimensional spaces. Behav Brain Res. 2011; 222: 279–288. doi:10.1016/j.bbr.2011.02.035 PMID:21419172
8. Ekstrom AD, Kahana MJ, Caplan JB, Fields TA, Isham EA, Newman EL, et al Cellular networks under-lying human spatial navigation. Nature. 2003; 425: 184–187. PMID:12968182
9. Fyhn M, Molden S, Witter MP, Moser EI, Moser MB. Spatial representation in the entorhinal cortex. Sci-ence. 2004; 305: 1258–1264. PMID:15333832
10. Valerio S, Taube JS. Path integration: how the head direction signal maintains and corrects spatial ori-entation. Nat Neurosci. 2012; 15: 1445–1453. doi:10.1038/nn.3215PMID:22983210
11. Taube JS, Wang SS, Kim SY, Frohardt RJ. Updating of the spatial reference frame of head direction cells in response to locomotion in the vertical plane. J Neurophysiol. 2013; 109: 873–888. doi:10.1152/ jn.00239.2012PMID:23114216
12. Brandt T, Dieterich M.“Right Door, Wrong Floor”: a canine deficiency in navigation. Hippocampus. 2013; 23: 245–246. doi:10.1002/hipo.22091PMID:23355406
13. Zwergal A, Schöberl F, Xiong G, Werner P, Pradhan C, Bartenstein P, et al. Anisotropy of human hori-zontal and vertical navigation in real space: behavioral and PET correlates. Cerebral Cortex. 2015; in press.
14. Meilinger T, Frankensteiner J, Bülthoff H. Learning to navigate: experience versus maps. Cognition. 2013; 129: 24–30. doi:10.1016/j.cognition.2013.05.013PMID:23820180
15. Henriques DYP, Crawford JD. Role of eye, head, and shoulder geometry in the planning of accurate arm movements. J Neurophysiol. 2002; 87: 1677–1685. PMID:11929889
16. Khan Z, Crawford JD. Coordinating one hand with two eyes: optimizing for field of view in a pointing task. Vision Res. 2003; 43: 409–417. PMID:12535998
17. Berens P. CircStat: A Matlab Toolbox for Circular Statistics. J Stat Soft. 2009; 31: 10. Available:http:// www.jstatsoft.org/v31/i10
18. Yoder RM, Taube JS. The vestibular contribution to the head direction signal and navigation. Front Integr Neurosci. 2014; 8: 32. doi:10.3389/fnint.2014.00032PMID:24795578
19. Banquet JP, Gaussier P, Quoy M, Revel A, Burnod Y. A hierarchy of associations in hippocampo-corti-cal systems: cognitive maps and navigation strategies. Neural Comput. 2005; 17: 1339–1384. PMID: 15901401
21. Epstein RA, Vass LK. Neural systems for landmark-based wayfinding in humans. Phil Trans R Soc B. 2014: 369: 20120533. doi:10.1098/rstb.2012.0533PMID:24366141
22. Aradillas E, Libon DJ, Schwartzman RJ. Acute loss of spatial navigational skills in a case of a right pos-terior hippocampus stroke. J Neurol Sci. 2011; 308: 144–146. doi:10.1016/j.jns.2011.06.026PMID: 21762930
23. Fanselow MS, Dong HW. Are the dorsal and ventral hippocampus functionally distinct structures? Neu-ron. 2010; 65: 7–19. doi:10.1016/j.neuron.2009.11.031PMID:20152109
24. Hüfner K, Strupp M, Smith P, Brandt T, Jahn K. Spatial separation of visual and vestibular processing in the human hippocampal formation. Ann N Y Acad Sci. 2011; 1233: 177–178. doi:10.1111/j.1749-6632. 2011.06115.xPMID:21950991
25. Hüfner K, Binetti C, Hamilton DA, Stephan T, Flanagin VL, Linn J, et al. Structural and functional plastic-ity of the hippocampal formation in professional dancers and slackliners. Hippocampus. 2011; 21: 855– 865. doi:10.1002/hipo.20801PMID:20572197
26. Hitier M, Besnard S, Smith PF. Vestibular pathways involved in cognition. Front Integr Neurosci. 2014; 8: 59. doi:10.3389/fnint.2014.00059PMID:25100954
27. Calton JL, Taube JS. Where am I and how will I get there from here? A role for posterior parietal cortex in the integration of spatial information and route planning. Neurobiol Learn Mem. 2009; 91: 186–96. doi:10.1016/j.nlm.2008.09.015PMID:18929674
28. Smith PF, Geddes LH, Baek JH, Darlington CL, Zheng Y. Modulation of memory by vestibular lesions and galvanic vestibular stimulation. Front Neurol. 2010; 1: 141. doi:10.3389/fneur.2010.00141PMID: 21173897
29. Hoelscher T, Meilinger T, Vrachliotis G, Brösamle M, Knauff M. Up the down staircase: Wayfinding strategies in multi-level buildings. J Environ Psychol. 2006; 26: 284–299.
30. Thibault G, Pasqualotto A, Vidal M, Droulez J, Berthoz A. How does horizontal and vertical navigation influence spatial memory of multifloored environments? Atten Percept Psychophys. 2013; 75: 10–15. doi:10.3758/s13414-012-0405-xPMID:23238988
31. Buechner SJ, Hoelscher C, Strube G. Path choice heuristics for navigation related to mental represen-tations of a building. In: Proceedings of the European Cognitive Science Conference. Delphi, Greece. 2007. pp. 504–509.
32. Petzschner FH, Glasauer S, Stephan KE. A Bayesian perspective on magnitude estimation. Trends Cogn Sci. 2015; 19: 285–293. doi:10.1016/j.tics.2015.03.002PMID:25843543
33. Radvansky GA, Krawietz SA, Tamplin AK. Walking through doorways causes forgetting: further explo-rations. Q J Exp Psychol (Hove) 2011; 64:1632–1645
34. Lawrence Z, Peterson D. Mentally walking through doorways causes forgetting: the location updating effect and imagination. Memory 2014; [Epub ahead of print]