ISSN 1546-9239
© 2007 Science Publications
Corresponding Author: W. F. Mohammad, Electrical Engineering Department. Al-Isra Private University, Jordan
Fast Power Loss Computation and Shunt Capacitor Insertion Using
Fuzzy Logic Technique
1Wagah F. Mohammad, 1Nabil Tawalbeh and 2Kasim M. Al-Aubidy
1Electrical Engineering Department, Al-Isra Private University, Jordan
2Computer Engineering Department, Philadelphia University, Jordan
Abstract: Fast power loss computation was implemented using supervisory control and data acquisition system (SCADA) with personal computer. Logic Control Array (LCA) and EPROM circuits were used to implement SCADA system to facilitate the required measurements to obtain the daily load profile for residential and commercial customers. LCA, EPROM and PC were used to simplify the electronic circuits, reduce the cost and speed up the computation time.
An illustrative example had been considered to measure, store and show the active power, reactive power, load voltage, load current, power factor and the shunt capacitors current. It as observed that when 2.7 MVAR bank capacitor inserted in the network the load current decreased from 740.8A to 688.4A and the power factor was improved from 0.80 to 0.93, which reduced the apparent power, hence allowing to add more loads to the network and release the feeder capacitor. A rule-based fuzzy decision maker had been designed and tested with the real data collected from Jordan electricity board using SCADA system. The calculated output was almost similar to that obtained from the first approach presented in this study. The advantage of using fuzzy decision maker was its simplicity that can be implemented on a programmable logic device.
Key words: Power factor improvement, power loss computation, fuzzy-based decision maker, capacitor insertion, programmable logic device
INTRODUCTION
Capacitors are widely used in distribution system to achieve power loss reduction and to maintain the voltage profile with impermissible limits and to minimize the voltage flicker in power distribution networks. The extent of these benefits depends on the location, size, type and number of capacitors and the fast method of capacitor insertion[1-3]. The power factor depends on the electrical loads type; it is usually that the current lagging voltage and the angle of lagging are varied as the load varied and the daily time elapse. Increasing the lagging will cause more energy loss in the distribution network. This problem has been overcome by inserting shunt capacitors in the distribution network which is essentially reduces the current drawn from the network.
If the daily energy losses are evaluated the different load patterns of daily local current (DLC) of different customers could be taken into account. The customers are divided into three groups: Urban residential, commercial and industrial. Each type of load has its typical DLC set for twenty four hours at working days. The fast method of total power loss calculation can be manipulated using supervisory control and data acquisition system (SCADA), with personal computer[4,5]. Data acquisition operation includes measurements of voltages, load currents,
Load
Q2=Q1-QC Q1
P P
Q1
QC
Q2
P
S2
S1
θ2
θ1
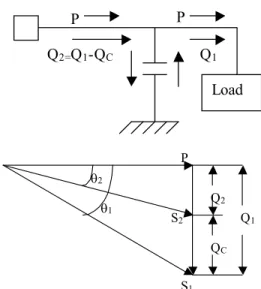
Fig. 1: Illustration of power factor correction
power factors and power capacitor currents, also estimate power and reactive power from the main transformer. An electronic circuit based on Logic Control Array (LCA) has been designed and built to do all the measurements and insert the required shunt capacitors at the right time and allocation.
fuzzy logic is used which imitates the process of natural evolution. This tool proved to be very successful for capacitors evaluation and insertion[6-8]. A special feature of the fuzzy set approach is that it is capable of dealing with uncertain and linguistic terms such as “heavy load” to describe system loading condition. It is also suitable as a decision maker.
Power factor correction: As mentioned earlier, the fundamental function of shunt capacitors is to regulate the voltage and reactive power flows at the point where they are inserted, in other words they are improving the power factor of the load. In typical distribution loads, the current lags the voltage; the cosine of the angle between current and voltage is known as the power factor of the circuit. Figure 1 illustrates the power factor correction for a given system. Capacitors draw leading reactive power from the source; i.e. they supply lagging reactive power to the load:
Assume that a load is supplied with a real power P, lagging reactive power Q1 and apparent power S1 at a
lagging power factor of:
1
2 2 2
1
1
P P
Cos 1
S ( P Q )
θ = =
+ (1)
When a shunt capacitor of Qc KVA is installed, the
power factor can be improved from
Cos
θ
1 toCos
θ
2when:
2 1
2 2 2
2
1 C
P P
Cos
S P ( Q Q )
θ = =
+ −
(2) Therefore, as can be observed from the above
figure, the apparent power and the reactive power are decreased from S1 KVA to S2 KVA and from Q1 KVAR
to Q2 KVAR (by providing a reactive power of Qc)
respectively.
The economic power factor is the point at which the economic benefits of adding shunt capacitors just equals the cost of capacitors. Today’s high plant and fuel costs have pushed the economic power factor toward unity[9]. It worth to be careful that as a lagging system power factor is detrimental to the system on various counts, a leading system power factor is also undesirable. It tends to result in over voltages, higher losses and lesser capacity utilization. For the above reasons fast energy loss computation and efficient method of inserting and removing the shunt capacitors must be implemented in real-time.
Many power-factor-correction tables can be tabulated[9] using personal computers to simplify the calculations involved in determining the capacitor size necessary to improve the power factor of a given load from original to desired value. The capacitor size (Qc in
KVAR) is:
Q
C= P
L* k
(3)where; k is a correction factor, and PL is the active
power load.
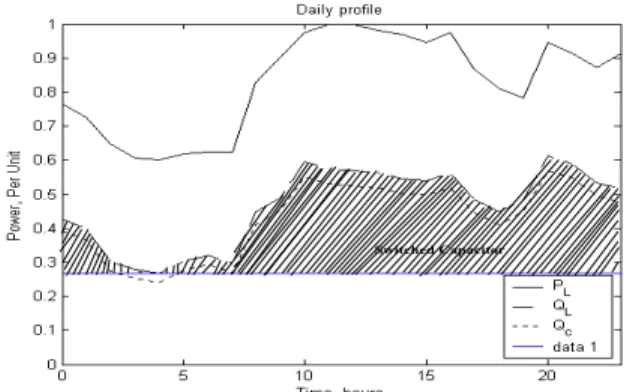
Switched Capacitor
Fig. 2: Sizing of the fixed and switched capacitors A load flow digital computer program (will be discussed and explained later) can be employed to determine the KVolt-Ampere, KVolt and KVAR at annual peak level for the distribution substation. As a result of local flows program runs, the system’s lagging reactive loads (i.e. power demands) can be determined and the results can be plotted on curve as shown in Fig. 2. This curve is called the reactive daily curve, once the daily reactive load curve is obtained, then by visual inspection of the curve the size of the fixed capacitor can be determined to meet the minimum reactive load, the high and variable remaining demands of the loads are met by the switched capacitors.
To meet the daily reactive power and switched capacitors many utilities apply the rule of thumb to determine the size of the switched capacitor. In this research a very fast computation system based on SCADA system is used to find the reactive load duration curve for residential, commercial and industrial customers at weekdays. Then a fuzzy logic is used to determine the size of switched capacitors.
SCADA-based power factor measurement:
Supervisory control and data acquisition (SCADA) system could be considered as one of the most recent technologies used for data collection and control for distribution power system. Figure 3 shows the block diagram of data acquisition system to measure the kilovolt-amperes, kilovolts and kilovars at daily reactive load curve. A logic control array is used to; * Control the input and output circuit of the personalcomputer,
* Speed up the measurements operation,
* Reduce the required electronic circuits and minimize the cost.
Fig. 3: Block diagram of data acquisition system The final circuits which consist of set of power transistors (BC337-40) are controlled by the LCA output signal to drive the relays which insert or disconnect the shunt capacitors.
As start, shunt capacitors are applied to the substation bus for correcting to an initial power factor, for example, 90 percent. Then, a load flow run is performed to determine the total system Kilovolt-amperes and kilowatt losses at this level and capacitors kilovars are noted. Later additional capacitors are applied to substation bus under test to increase the power factor by 1 percent and another load flow run is made. This process of iteration is repeated until the power factor becomes unity. It is found from theoretical and experimental data that the additional capacitor size required can be calculated as:
C P K
Q P ( ta n ta n )
∆ = φ − θ (4)
where; ∆ QC is the required capacitor size in KVAR,
PPK is the system demand at annual peak in KW,
tan φ is the tangent of original power factor angle and tan
θ
is the required power factor angle.Illustrative example: To verify the proposed method of shunt capacitor insertion, the measurements of daily peak load Pdp at single feeder fed by 33 / 11KV, 16
MVA substation transformers were made from August to July. The program has the ability to measure, store and show the active power, reactive power, load voltage, load current, power factor and the shunt capacitor current, every ten seconds. For this reason capacitor can be inserted in the power network in no time and the power loss can be reduced to minimum.
Figure 4 represents variation of load current (IL)
and shunt capacitor current (IQC) after 10 second when a
bank capacitor of 2.7 MVAR inserted in the network.. If this figure inspected carefully, you can noticed that at time=0, IQC=0A and IL= 740.8A. When the bank
capacitor of 2.7 MVAR is inserted at time t=10 seconds the currents IQC = 158.47A and IL = 688.44A. It is very
interesting to notice that when shunt capacitors are inserted in the network will draw a lead current from the (substation) transformer and supply a lagging current to the load. The load current will decrease consequently; the total substation transformer current
0 20 40 60 80 100 120 650
660 670 680 690 700 710 720 730 740 750
t, [s] IL2
, [A]
0 20 40 60 80 100 1200 20 40 60 80 100 120 140 160 180
IQC2
[A]
I L2 IQC2
Fig 4: Variation of IL and IQC with time before and
after capacitor insertion
will be decreased. The power factor is improved from 0.80 up to 0.936 and this leads to add more loads on the network and release the feeder capacity.
Figure 5 represents the daily peak loads for different customers (residential, commercial and industrial) for working days. The measurements were taken at substation transformer of 132/33 KV, 40 MVA
power, during April-June. It is very interesting to notice that there is a lot of differences between the customers. In residential the fixed reactive power is around 37% of the maximum reactive power and it occurs around seven o'clock at the morning. On the other hand there is no fixed reactive power for the commercial and becomes minimum for long time of the day namely between 00:00 and 08:00 am and it is maximum on the other times of the day. The story from the industrial daily load profile is quite different. At first the constant reactive power is quite high around 67% of the maximum reactive power. Also the variable reactive power is quite changeable. These changeable events occur during all the hours’ day and nights. From the above inspection, it is understandable that different feeders must be used for different type of customers in order to insert the right values of the shunt capacitors in the networks, rather than putting identical units of bank capacitors at all networks, which will be never used sometime or could be more than what is needed and that will the power factor leading, which result in over-voltages and higher losses.
0 5 10 15 20 0
0.1 0.2 0.3 0.4 0.5 0.6 0.7 0.8 0.9 1
Time, hours
Power, Per Unit
Daily profile PL
Q L FixQ Q
c
(a)
0 5 10 15 20
0 0.1 0.2 0.3 0.4 0.5 0.6 0.7 0.8 0.9 1
Time, hours
Power, Per Unit
Daily profile PL
Q L FixQ Qc
(b)
0 5 10 15 20
0 0.1 0.2 0.3 0.4 0.5 0.6 0.7 0.8 0.9 1
Time, hours
Power, Per Unit
Daily profile
P L Q L FixQ Q
c
(c)
Fig. 5: Active and reactive power of the transformer for twenty four hours for different customers, (a) residential , (b) commercial, (c) industrial
Fuzzy Rule Base
Fuzzy Inference
F
u
zzi
fier
D
e
fu
zz
if
ie
r
C
apa
c
itor
B
ank
Reactive Power Power Factor
Fig. 6: Fuzzy Decision Maker Layout
A fuzzy-based decision maker (FDM) has been proposed to compute the required shunt capacitor to improve the power factor according to the measured power factor (A) and measured reactive power (B), as
Table 1: Fuzzy rules A
---
B VS S M L VL
VS S S S VS VS
S M S S S VS RS M M S S VS M L M M S VS RL L M M S VS L L L M S S VL VL L M M S
Fig. 7: Universe of discourse of the variables
shown in Fig. 6. The measured variables are inverted into suitable linguistic variables. In this application, the following linguistic variables are used for measured power factor (A) and calculated variable (C); Very Small (VS), Small (Sb), Medium (M), Large (L) and Very Large (VL). The fuzzy sets definition for measured reactive power (B) are; Very Small (VS), Small (S), Rather Small (RS), Medium (M), Rather Large (RL), Large (L) and Very Large (VL). Figure 7 shows the universe of discourse and fuzzy sets of these variables. Fuzzy sets can have a variety of shapes, however, a triangular or a trapezoid can often provide an adequate representation of the knowledge[11].
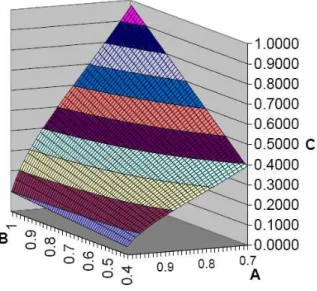
Fig. 8: Control action calculated from FDM
since we have five fuzzy sets for first input variable and seven fuzzy sets for the second input variable. Each rule is represented by IF and THEN statement such as; IF A is S and B is RS THEN C is M
This means that if the measured power factor is small and the reactive power is rather small, then the fuzzy calculated output is medium.
The Mamdani-style inference process is used[11] and the center of gravity defuzzification method is applied to convert the fuzzy output into a crisp value. Figure 8 demonstrates the control action calculated from the FDM and can be used as an index to select the suitable shunt capacitor.
CONCLUSION
Fast energy loss computation has been implemented using data acquisition system. Logic control array has been used to control the input and output interface of the personal computer. The electronic circuit has the ability to measure, store and monitor the active power, reactive power, load voltage, load current, power factor and the shunt capacitor currents. The daily peak loads for residential, commercial and industrial customers has been measured and drawn. Several differences between customers were outlined, where fixed capacitor is minimum for commercial, medium for residential and maximum for industrial customers. On the other hand, the switched capacitor is minimum for industrial, medium for residential and maximum for commercial customers. Therefore, to find the best solution of the above complicated combinational problem, a fuzzy-based decision maker has been used to compute the suitable shunt capacitor required to improve the power factor according to the measured parameters.
The proposed fuzzy decision maker has been tested with the real data collected from Jordan and the calculated output is almost similar to that obtained from
the first approach presented in this study. The advantage of using fuzzy decision maker is its simplicity that can be implemented on a programmable logic device and can be programmed to improve the power factor.
REFERENCES
1. Granger, I.S. and S.H. Lee, 1981. Optimum size and location of shunt capacitors for reduction of losses on distribution feeders. IEEE Trans. Power Appar. Syst., PAS-100: 1105-1118.
2. Fawzi, T.H., S.M. El-Sobki and M.A. Abdel-Halim, 1983. New approach for the application of shunt capacitors to the primary distribution feeders. IEEE Trans . Power Appra. Syst., PAS-102: 10-13. 2. Ponnavaikko, M. and K.S.P. Rao, 1983. Optimal
choice of fixed and switched shunt caoacitors on radial distributers by the method of local variations. IEEE Trans. Power Appra. Syst., PAS-102: 1607-1615.
3. Kaplan, M., 1984. Optimization of number, location, size, central type and central settings of shunt capacitors on radial distribution feeders. Trans . Power Appra. Syst., PAS-103: 2659-2665. 4. Batur, I. and A.N Guven, 1994. A proposed
application of an industrial DOS computer for distribution substation monitoring and central. IEEE Trans. on Power Delivery, 9: 729-735. 5. Raid, M.C.F., 2002. Study and improvement of
supervisory control and data acquisition system in distribution station. M.Sc. Thesis, Mousel University, Iraq.
6. Kuo, H.C. and Y.Y. Hso, 1993. Distribution system load estimation and service restoration using a fuzzy set approach. IEEE Trans. on Power Delivery, 8: 1950-1957.
7. Nazarko, J. and W. Zalewski, 1999. The fuzzy regression approach to peak load estimation in power distribution system. IEEE Trans. on Power Systems, 4: 3.
8. Levitin, G., A. Kalyuzhny, A. Shenkman and M. Cherktov, 2000. Optimal capacitor allocation in distribution systems using a genetic algorithm and fast energy loss computation techniques. IEEE Trans. on Power Delivery, 15: 2.
9. Gonen, T., 1986. Electric Power Distribution System Engineering. Section: Application of Capacitors Distribution Systems. McGraw-Hill Inc, pp: Page 385-398.
10. Al-Abdaly, I.S.H., 2003. Computerized method for capacitor banks insertion to improve power factor in the distribution substation. M.Sc. Thesis, Mousel University, Iraq.