Original scientifi c paper UDC: 005.21:005.336.1(497.11) doi: 10.5937/ekonhor1501045T
I N T RODUC T ION
All decisions of a company can be classifi ed into three categories: strategic, tactical and operational. Strategic decisions concern the business portfolio, the level of the vertical integration and markets in which the company will run its bu–sinesses. Tactical decisions relate to investment projects (i.e. capital budgeting)
that implement a pre-formulated strategy. Operational decisions are made in daily operations for the purpose of the implementation of approved projects and business plans. The ultimate criterion in all decisions should be the maximization of the company value. In a simplifi ed interpretation, all decisions should be directed toward improving a company’s performance. In order to improve performance, it is necessary to choose the measures or metrics that will credibly indicate the level of its achievement. Hence the great importance of performance measures - since what
PR AC TICES OF PER FOR MANCE MEASUREMEN T IN
COMPANIES IN T HE REPUBLIC OF SERBIA
Miroslav Todorovic*, Djordje Kalicanin and Aleksandra Nojkovic
Faculty of Economics, University of Belgrade, Belgrade, the Republic of Serbia
A large number of acronyms which indicate diff erent performance metrics, such as EBIT (Earnings Before Interest And Taxes), EBITDA (Earnings Before Interest, Taxes, Depreciation, And Amortization), ROIC (Return On Invested Capital), NPV (Net Present Value), EVA (Economic Value Added), IRR (Internal Rate Of Return), ROE (Return On Equity), ROA (Return On Assets) etc. are in use nowadays. In practice, managers cannot and do not want to apply all of these metrics and managers’ choice does not necessarily rely on what theory emphasizes as their advantages and disadvantages. We surveyed 64 CFOs in order to explore the corporate practice in the Republic of Serbia. The DCF-based capital budgeting metrics are dominant compared to the traditional metrics, and the one that is used the most is the profi tability index, only to be followed by the IRR and the NPV. The Payback Period is yet frequently used. The earnings-based corporate performance metrics are still the most important. However, the presence of EVA and balanced scorecard is not negligible. Large companies use them signifi cantly more than small companies. The orientation towards EVA and balanced scorecard increases with the internationalization of a fi rm as well. Finally, companies using sophisticated capital budgeting metrics are prone to using sophisticated corporate performance metrics.
Keywords: performance measurement, capital budgeting metrics, corporate performance metrics
JEL Classifi cation: G31, M21
can be measured can be managed, too. They are clear guidelines in the planning, implementation and control of a business strategy, projects and daily operations. Measurement should not be an end in itself; it should have some meaning - it should indicate the quality of the goal achievement as well as the company’s ability (or inferiority) to achieve these goals. A comprehensive and coherent structure of performance measures is called the performance measurement system - the PMS.
Today, a large number of metrics are used in textbooks on corporate fi nance, strategic management and strategic fi nance, not only for the measurement of companies’ performances - corporate performance metrics - the CPM, but also for the evaluation of investment projects - capital budgeting metrics - the CBM1. Capital budgeting can be seen as a separate
methodology, and, in a specifi c way, also as an integral part of the PMS enabling the creation of the shareholder value. Capital budgeting and the PMS can be said to represent the connecting point of corporate fi nance and strategic management systems making the cornerstone of strategic fi nance. Relying on the projected future costs and benefi t, the CBM represent a kind of expected or ex ante metrics, while the CPM stand for the ex post measures of the achievement. In business practice, managers cannot and do not want to apply all available metrics and their selection process does not necessarily rely on the theoretical advantages and disadvantages of diff erent metrics.
The aim of this research is to gain an insight into the presence of diff erent performance metrics in companies in Serbia in order to contribute to the narrowing gap between the theory and practice of corporate fi nance. The research was conducted by surveying managers of 64 companies in the Republic of Serbia (RS), in the period from March to September 2014. This research of ours included a wide range of companies with diff erent characteristics in terms of their size, industry, leverage level, degree of diversifi cation and internationalization etc. Alongside a general insight into the usage of various measures, this allowed us to gain an insight into possible diff erences in practices between companies with diff erent characteristics, e.g. between large and small companies, public corporations and private companies, diversifi ed and
undiversifi ed companies etc. Based on the aim of the research, three hypotheses were tested:
H1: The Discounted-Cash-Flow-based metrics are dominant in capital budgeting in companies in Serbia;
H2: The presence of the sophisticated corporate performance metrics and the performance measurement systems is not negligible;
H3: The characteristics of the companies determine the presence of particular performance measures in practice.
This paper is organized as follows. The next section introduces the theoretical background and the literature review with respect to these subjects of study. Then, an overview of the research methodology is presented. Finally, the results are discussed and several conclusions are made.
THEORETICAL BACKGROUND AND
LITERATURE OVERVIEW
The PMS are formalized, information-based routines and procedures that managers use in maintaining or changing the direction of the business (Simons, 2000, 4). It is recommended that metrics should pass three tests before being included in the PMS (Simons, 2000, 234-240):
• they should be in line with the strategy,
• they should be objective and
• they should be aligned with the supreme aim of
maximizing the enterprise’s value.
The measures can be identifi ed as Key Results Indicators - the KRIs, in the case of past achievements, or Key Performance Indicators - the KPIs, in the case of the possibilities and capabilities of the company to achieve its goals in the future (Parmenter, 2007). In this way, it is emphasized that a comprehensive PMS should be facing both ex ante and ex post. Also,
& Norton, 1992; Niven, 2006). The lack of the PMS can have very negative eff ects on the formulation and implementation of a business strategy (Micheli, Mura & Agliati, 2011). These assumptions were used to develop a comprehensive PMS called Balanced Scorecard - the BSC (Kaplan & Norton, 1992; 1996). That PMS integrates in one framework the whole structure of objectives and their measures, targets and initiatives enabling their achievement. Objectives, measures, targets and initiatives can be included in one of the next perspectives: the fi nancial perspective, the consumer perspective, the perspective of internal business processes and the learning and growth perspective. A special advantage of this system is its being derived from the strategy map - a graphically described business strategy (Kaplan & Norton, 2000). The traditional system of performance was predominantly based on accounting metrics (Net Profi t, Earnings Per Share - the EPS, Earnings Before Interest and Taxes - EBIT, Return on Assets - the ROA, Return on Equity - the ROE etc.) and on the traditional CBM such as the Payback Period - the PP and the Accounting Rate of Return - the ARR. With a further development of corporate fi nance, the CBM based on the Discounted Cash Flow - the DCF, such as the Net Present Value - the NPV, the Internal Rate of Return - the IRR and the Profi tability Index - the PI come to life. Finally, respecting the request of the owners (shareholders) to maximize the value of their stakes in companies, the concept and methodology of Value-Based Management - the VBM - was created. The vanguard of the VBM is the value-based performance measurement (Kaličanin, 2005). There was a sporadic development of these metrics in the second half of the twentieth century; however, their full development and usage started in the last few decades of the twentieth century. Some of the most famous CPM developed in those years were based on the market value of companies or on the concept of the economic profi t or on the discounted cash fl ow such as the Market Value Added - the MVA, the Economic Value Added - the EVA, Residual Income, Cash Flow Return on Investment - the CFROI, the Shareholder Value Added - the SVA, the Cash Value Added - the CVA, Excess Return, the Future Growth Value - the FGV etc. EVA is world-wide expected to be one of the most
popular VBM measures. On the other hand, the BSC is the framework for describing value-creating strategies (Speckbacher, Bischof & Pfeiff er, 2003). These metrics are seen as complementary ones. The BSC should lead to value creation explicitly shown by EVA. Also, EVA could be used as one of the fi nancial metrics in a BSC formulation. Therefore, the contemporary PMS usually include not only accounting metrics but also value-based performance metrics rather than only fi nancial as well as non-fi nancial metrics.
Empirical researches into corporate fi nance have generally been rare in Serbia, the region, Central and Eastern Europe and developing countries in general. On the other hand, most of the researches in the US, Western Europe and other developed countries are based on samples with a large number of companies using historical data from fi nancial statements (book values), fi nancial markets (market values) or the intersection of these two sets of data. The advantages of such researches are in the good statistical design and reproducibility of results because of the big size of the samples and the good availability, reliability and objectivity of historical data from fi nancial statements or fi nancial markets. The major drawback of these studies is that one can hardly conclude how fi nancial managers in business practices actually make decisions. This aspect can be explored only through fi eld studies.
of capital budgeting. After this study, a number of later studies sought to confi rm or deny the Graham-Harvey fi nding or to analyze the practice from new perspectives (Ryan & Ryan, 2002; Sandahl & Sjögren, 2003; Brounen, De Jong & Koedijk, 2004; Lazaridis, 2004; Dedi & Orsag, 2007; Truong, Partington & Peat, 2008; Verma, Gupta & Batra, 2009; Baker, Dut a & Saadi, 2011; Correia, 2012; Andrés, Fuente & San Matin, 2014).
To our best knowledge, no wider fi eld studies on the use of performance metrics in corporate practice in Serbia have been conducted so far. Based on the content of domestic academic textbooks (Kaličanin, 2006; Todorović, 2010; Ivanišević, 2012; Djuričin, Janošević & Kaličanin, 2013), one could get the impression that, as early as at university, managers acquire suffi cient knowledge that investment projects should be evaluated before their execution and, because of their obvious superiority, it is thought that managers ought to use only the DCF CBM, especially the NPV. Additionally, they should use the value-based CPM, especially EVA, as well as the complex and multidimensional technique of the BSC. In the absence of empirical research in Serbia, the possibility that managers of domestic companies still do not behave in this „expected manner” was in the domain of a „reasonable doubt”.
THE RESEARCH METHODOLOGY
The main objective of the study was to contribute to the narrowing gap between the theory and practice of corporate fi nance, with a focus on the use of performance metrics. The starting point was the
consideration of the extent to which theoretical concepts are actually applied by the managers in business practice. In this sense, the managers of 64 companies were surveyed. Our study included a relatively wide range of companies with diff erent characteristics in terms of their size, industry, listing status, leverage level, degree of diversifi cation and internationalization etc. Apart from our gaining a general insight into the usage of various measures, this also allowed us to gain an insight into possible diff erences in practices between companies with diff erent characteristics, for example, between large and small companies, public corporations and private companies, diversifi ed and undiversifi ed companies etc.
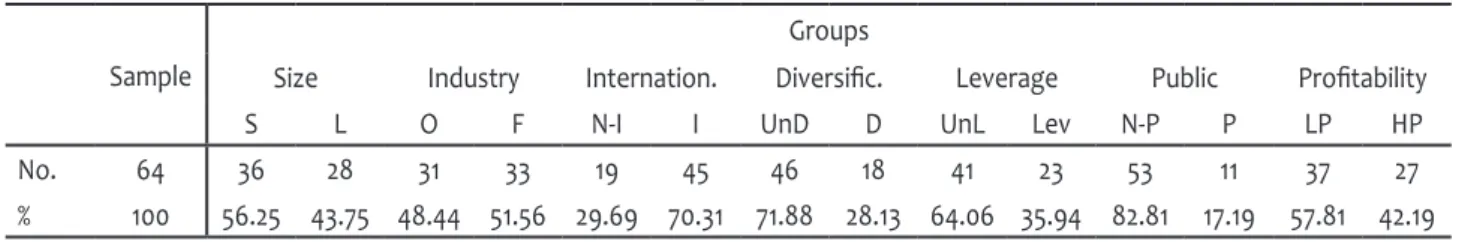
The survey was conducted between March and September 2014, by collecting responses to the survey with Chief Financial Offi cers - the CFOs (or Chief Executive Offi cers - the CEOs) of the companies. In order to determine how various companies’ characteristics aff ect their practice of performance measurement, all fi rms in the sample were divided into seven sets of two subsamples. The sample overview is given in Table 1.
Twenty-eight companies (or 43.7% of the total number) were classifi ed as large companies (L) with revenues of more than EUR 10 million2. The average revenue per company in the sample was EUR 40.08 million, and the average total asset was EUR 53.73 million. More than half of the companies in the sample (51.56%) belonged to the food and beverage industry (F). The majority of the companies (70.31%) had sold abroad (I). The eighteen companies were included in the diversifi ed companies (D) that operated in three or more industries and/or generated more than 5% of
Table 1 Sample characteristics
Sample
Groups
Size Industry Internation. Diversifi c. Leverage Public Profi tability
S L O F N-I I UnD D UnL Lev N-P P LP HP
No. 64 36 28 31 33 19 45 46 18 41 23 53 11 37 27
% 100 56.25 43.75 48.44 51.56 29.69 70.31 71.88 28.13 64.06 35.94 82.81 17.19 57.81 42.19
their revenue from non-core businesses. We classifi ed 23 companies as the leveraged companies (Lev), with the total debt ratio (short-term and long-term debts) in the total resources above 30%3. The majority of the companies (85.81%) were not listed (N-P) in Belgrade or any other stock exchange. Twenty-seven companies were classifi ed as profi table companies (HP), with the ROA (net earnings to total assets) greater than 5%. In the area of the CBM, the following modalities were off ered to managers: 1) the NPV, 2) the IRR, 3) the Profi tability Index - the PI4, 4) the Payback Period - the PP, 5) the Discounted Payback Period - the DPP 6) the Accounting Rate of Return - the ARR. All the CBM, especially the DCF CBM, could be calculated using diff erent sets of estimates. In this regard, managers were asked whether they calculated capital budgeting metrics exclusively with the use of one set of inputs (estimates) or diff erent sets of inputs - scenarios (such as „good”, „average” and „bad”) - a scenario analysis or otherwise tested the impact of changes in certain inputs on a certain metric - a sensitivity analysis. Within the CPM part of the survey, the respondents were off ered the following options: 1) the accounting earnings (net profi t, EBIT, EBITDA etc.) as absolute indicators, 2) the accounting rates of return (ROE, Return on Invested Capital - the ROIC, the ROA etc.) as relative indicators, 3) EVA and 4) the BSC. The frequency of the use of diff erent metrics in business practice was examined using a 5-point Likert scales (1-never, 5-always). In order to detect any statistically signifi cant diff erences in the practices of using diff erent metrics between companies with diff erent characteristics, we ran a t-test to compare the mean values of the two samples5.
The limitation of this type of research is that the at itudes, beliefs and opinions of the managers examined are not necessarily the way they actually behave when making business decisions. To avoid this drawback, managers were asked to confi rm the acceptance and usage of diff erent metrics in their business practices, not their views on the advantages and/or disadvantages of such metrics. Also, we asked the surveyed managers to be honest in their answers (since individual results regarding their companies would not be published). However, we were not in a position to see how honest they really were and
what the actual adoption of the various performance metrics in business practice was like. Because of that, in order to improve the reliability of the responses, we collected data on the registration number and used this information to collect additional information about the size of the companies, the leverage and their profi tability. The publicly available data from The Serbian Business Registers Agency were used for such purposes.
RESULTS AND ANALYSIS
The results of the study are presented in two sections, each relating to one of the previously noticed metrics area - the CBM and the CPM. The percentage of the companies which used (always - 5 or almost always - 4 on the Likert scale) the given metrics are accounted in the tables. The tables also contain the descriptive statistics, precisely group the means and the p-value indicated as: ***, **, * signifi cant diff erence at the 0.01, 0.05, and 0.10 level, respectively.
Capital Budgeting Metrics
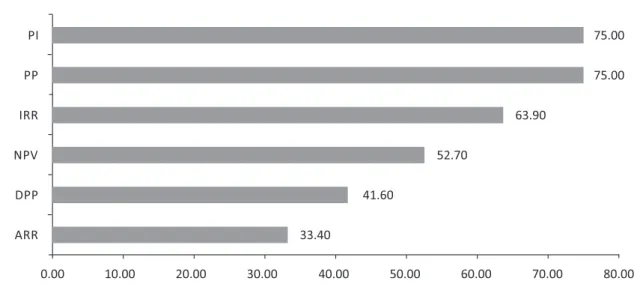
Our fi rst focus was to fi nd out the frequency of the use of diff erent CBM. The survey results are shown in Figure 1.
Payback Period is used as an additional metric, which certainly should not be seen as a big mistake. Although the textbooks devote far more space to the NPV, emphasizing its superiority, we have shown that this method was not the most widely used one in business practice. Only slightly more than half of the managers (52.7%) used this method always or almost always in the evaluation of investment projects. An encouraging result of our study was that the DCF metrics were considered to be more important than the non-DCF method, which is similar to the fi nding of Kester’s et al. (1999). Only 8.3% of the surveyed managers did not use any of the DCF metrics - the NPV, the IRR or the PI - they rather used the traditional CBM instead. About 19% of the total number of the companies used only the DCF metrics. The remaining part of the sample, i.e. about 73% of the companies, used a combination of the traditional and the DCF metrics. Another encouraging result of our research was that the DPP and the ARR were the least present metrics. Since these metrics are not characterized by a kind of qualities, we can conclude that it is good that their adoption was low. The main diff erence in our fi ndings in relation to the previous research does not lie in the high rating of the PP (and the IRR) but in the excellent ranking of the PI. Our results support G. Truong et al (2008), who concluded that, in Australia, projects were usually
evaluated using the NPV, the IRR and the PP, and S. Verma et al (2009), with very similar results, but on the corporate practice in India. Our fi ndings slightly diff er from the fi nding of the study conducted by L. Dedi and S. Orsag (2007) in Croatian fi rms, who found out the following priority list of metrics: 1) the IRR (59%), 2) the PP (56%) and 3) the NPV (42%). There is also a slight diff erence in relation to Spain, where the most favored metric was the PP, which was followed by the IRR and the NPV (Andrés et al, 2014). The PP was the most preferred metric in Cyprus as well (Lazaridis, 2004). Besides, our study cannot support the results of H. K. Baker et al (2011), who found out that, in Canada, there was a strong preference for the NPV followed by the IRR and the PP. We found out that the IRR was preferred over the NPV, which is also contrary to the fi ndings of P. A. Ryan and G.P. Ryan (2002), who found out in their survey of Fortune 1000 companies that the NPV was preferred over the IRR and other capital budgeting metrics. Finally, having in mind that less than 10% of the companies did not use the DCF metrics, we can point out that, in RS, the DCF metrics have become a norm, such as that shown by V. M. Jog and A. Srivastava (1995) in the case of Canadian fi rms. We further explored whether the use of metrics diff ers across fi rms’ sizes, industry, profi tability, leverage etc. The survey results are shown in Table 2.
Figure 1 The percentage of the respondents who always or almost always use the given CBM
We found several statistically signifi cant diff erences between diff erent groups of companies. The managers of the large and listed companies were loyal to these metrics of the „old school” - the NPV and the IRR; the public (listed) companies used the NPV to a signifi cantly greater extent than the private companies (4.43 vs. 3.34) and the large companies used the method of the IRR signifi cantly more than the small ones (4.15 vs. 3.56). We could assume that, in the case of the listed companies, the managers’ perception of the strong pressure of the fi nancial market to earn a return above the WACC was the main reason for higher „loyalty” toward the metrics than the use of the WACC. Furthermore, large and listed companies usually have the greatest percentage of CFOs (and CEOs), with the highest degree in fi nance. We assume they are keen to apply what they learned at university and apply those metrics that they believe are the most credible ones. The diversifi ed companies used the PI more in relation to the undiversifi ed ones (4.45 vs. 3.64). The reason for this probably lies in the fact that diversifi cation requires more „prudential” metrics in investment decision-making and the PI is a superior method for project ranking and for making a comparison between investment projects in diff erent business units in a multi-businesses company. The internationalization clearly increased the tendency towards the NPV and the PP. Belonging to a particular industry and the company’s profi tability were irrelevant to the managers’ tendency to use diff erent metrics.
Although not at the level of statistical signifi cance, the careful examination of the results in Table 2 can
easily reveal a very interesting fi nding - the tendency towards the use of all the metrics was higher for the large, public7, internationalized and diversifi ed companies. Those types of companies (typically well-known in a small national economy like the Serbian one) usually engage CFOs with sound fi nancial education; they usually have good procedures and staff with bet er knowledge in fi nancial departments and usually evaluate their investment projects together with specialized consultants in the areas of fi nance and accounting. In that context, not using the CBM would be surprising. The tendency towards the use of all the metrics was also higher for the leveraged companies. One possible explanation can be found in the disciplining role of a debt that leads to the rigorous investment process. Additionally, it is expected that, in their applications for fi nancial support of banks, those companies must carry out an investment analysis of a higher quality.
In some way, there was a similarity in our results with D. Brounen et al (2004), who stated that managers in large U.S. companies generally preferred the DCF metrics. The same comparison could be made with G. Sandahl and S. Sjögren (2003), who found out that the large companies were the ones to more frequently use the DCF method than the small ones. Again, there is a partial congruence with C. Correia (2012), who found out that those larger companies preferred the DCF metrics, and that the small fi rms used the PP and the ARR to a greater extent. Our fi nding, as well as M. G. Danielson and J. A. Scot ’s fi nding (2006), that small businesses usually use the DCF metrics more Table 2 The frequency of the use of the diff erent CBM
Metric
All Mean
% use Mean Size Industry Internation. Diversifi c. Leverage Public Profi tability
S L O F N-I I UnD D UnL Lev N-P P LP HP
NPV 52.70 3.56 3.31 3.75 3.92 3.35 2.63 3.82** 3.36 4.00 3.25 3.94 3.34 4.43** 3.58 3.50 IRR 63.90 3.89 3.56 4.15* 3.77 3.96 3.38 4.04 3.72 4.27 3.80 4.00 3.83 4.14 3.92 3.83 PI 75.00 3.89 3.81 3.95 3.54 4.09 3.63 3.96 3.64 4.45* 3.70 4.13 3.79 4.29 4.04 3.58 PP 75.00 4.08 3.75 4.35 4.15 4.04 3.50 4.25* 4.00 4.27 4.05 4.13 4.00 4.43 4.00 4.25 DPP 41.60 3.17 2.81 3.45 2.85 3.35 2.50 3.36 3.08 3.36 3.10 3.25 3.00 3.86 3.21 3.08 ARR 33.40 2.97 2.94 3.00 2.62 3.17 2.75 3.04 2.92 3.09 2.90 3.06 3.00 2.86 3.04 2.83
rarely than large companies could be explained by the limited education background of the managers in small companies and the small staff size. Interestingly, we can compare the results of our study that showed that the domestic public companies preferred the NPV in relation to H. W. George and T. K. Chong (1998), who found out that the executives of the public companies in Singapore considered the IRR and the PP to be equally important. It is hard to explain the greater tendency of the internationalized companies in Serbia to be using the PP metrics, just as much as it is diffi cult to explain the greater adoption of this metric in this case of the large companies in Cyprus (Andrés et al, 2014).
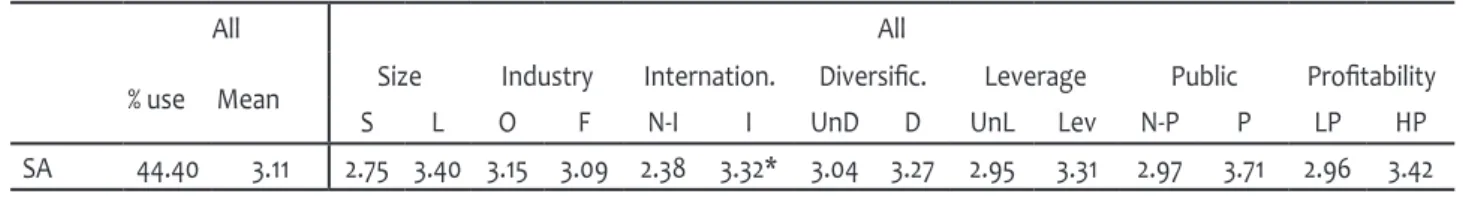
Furthermore, we wanted to assess the presence of a scenario and/or sensitivity analysis (SA) in capital budgeting. The results are shown in Table 3.
The evaluation of investment projects was usually done using one set of data and assumptions. However, there are companies (44.4%) that sought to take multiple scenarios into consideration. We found that the managers of the large, diversifi ed, leveraged, public and profi table companies had a greater tendency towards the scenario analysis; however, the diff erence towards the use of the scenario analysis was only statistically signifi cant between the internationalized and the non-internationalized companies (3.32 vs. 2.38). The diff erence could be explained by diff erent types of risks as a consequence of the internationalization of business operations. There are usually several unknowns about political and legal, economic, socio-cultural, technological and ecological factors in a foreign country, as well as unknowns regarding the same industry but in a foreign country. A company can hardly know well all competitive forces as it can do in
its domestic market. It is more diffi cult to predict all important competitors’ movements and the dynamics of rivalry, buyers’ plans regarding purchasing and the price they might be willing to pay, suppliers’ intentions regarding their switching to other partners and the vertical integration and their pricing strategy, the future pressure of substitutes that could come from other industries as well as a threat of new entrants. That is the reason why, in evaluating an investment decision, internationalized fi rms usually include changes in single or several assumptions about the costs (rising), the selling price (lowering), the project starting date (delaying) and so forth.
Corporate Performance Metrics
Our second focus was to fi nd out the frequency of the use of diff erent corporate performance metrics - the CPM. More specifi cally, expecting a predominant reliance on the accounting metrics, we were interested in the presence of EVA (or the economic profi t) and the BSC in the companies in Serbia. We obtained the answers shown in Figure 2.
It is not surprising that the absolute measures of the accounting profi t were still the most common in the business practice in RS. Over 4/5 of the managers (82.9%) relied on them when observing/assessing the company’s performance. There was also a relatively high presence of the relative accounting indicators such as ROA, ROE, ROIC etc.; they were in use in about 2/3 of the companies. Comparing to the accounting metrics, there was a sharp diff erence in the adoption of modern metrics (or the PMS), namely EVA and the BSC. EVA was being used more frequently than the BSC. Seemingly the relatively poorly used EVA was
Table 3 The frequency of the use of a scenario/sensitivity analysis
All All
% use Mean Size Industry Internation. Diversifi c. Leverage Public Profi tability
S L O F N-I I UnD D UnL Lev N-P P LP HP
SA 44.40 3.11 2.75 3.40 3.15 3.09 2.38 3.32* 3.04 3.27 2.95 3.31 2.97 3.71 2.96 3.42
still present in constant or nearly constant use in ¼ of the companies. In relation to what had been recorded in the earlier studies conducted in RS (Stančić, Todorović & Čupić, 2012; Domanovic, 2013), this was an obvious forward. The conclusion that the VBM starts to be not only rhetoric but also supported by a sound methodology can be drawn. Besides, another very encouraging result was the presence of the BSC in a lit le less than 1/5 of the companies (18.8%). There were diff erent forms of the BSC implementation. The simplest only implies a combination of the fi nancial and the non-fi nancial measures; the second type involves the strategy maps and the third one implies linking incentives to the BSC. Due to the design of our study, it was impossible to test which form of the BSC the companies in RS used: at least, however, they used some meaningful mixture of the fi nancial and the non-fi nancial metrics. EVA and the BSC are assumed to have been less present because they are less-known, much more complex to use and, as opposed to the accounting metrics, they are not the direct result of the statutory accounting records. Besides, there are still researches into the eff ectiveness of those metrics. Theoretically, they are almost perfect, but on the other hand, there are many limitations and problems in their practical use. Probably, that imperfection makes many domestic managers unready to try them without demur. Additionally, modern metrics are often promoted by global consulting companies. In RS, excluding auditing, the consulting industry did not at ract so many big global players that would promote
these metrics. Perhaps there are not enough companies which can fi nancially aff ord to use them. Namely, the application of those metrics is very often facilitated by a piece of software usually too expensive for domestic companies. Finally, managers are pret y aware of possible fee obligations for patented metrics. All these factors seriously limit its use and make managers more loyal to the accounting metrics.
We continued our analysis by trying to see if there was any diff erence between the practices in the corporate performance metrics of diff erent groups of companies. The results are shown in Table 4.
The survey results reported in the previous table indicate that the adoption of diff erent metrics varied signifi cantly across the company’s size, its level of internationalization and profi tability.
EVA was signifi cantly more used in the large companies than in the small ones (the mean of 2.96 vs. 1.78) and in the companies that generated revenues from foreign markets rather than in those that only sold on the domestic market (2.60 vs. 1.58). We found that there was a similar situation when the usage of the BSC was concerned in the large (2.61 for the large ones, 1.92 for the small ones) and internationalized companies (2.40 for the internationalized ones vs. 1.79 for the non-internationalized ones). EVA was least prevalent in the companies that generated revenues solely on the domestic market (the mean of 1.58) and the most common in the large companies (2.96). The Figure 2 Percentage of respondents who always or almost always used the given CPM
BSC was mostly used by the listed companies (2.64) and it was also present the least in the companies that earned their income solely on the domestic market (1.79). The somewhat wider acceptance of the BSC by the listed companies could originate from their awareness of the essence of the BSC.
On the basis of the previous results, we could conclude that the sophistication of companies in their orientation towards modern performance metrics increased with the size and the level of the internationalization of the fi rms. Additionally, we found that the large and internationalized companies were also using more relative accounting metrics than the small and non-internationalized ones. Finally, the large fi rms were also more prone to using absolute accounting numbers comparing than the small companies. Therefore, the large companies used all the metrics to a signifi cantly greater extent than tge small companies. The wider acceptance of all the metrics in the large companies in comparison to the small companies could be explained by the development of the processes and the quality of the staff at the fi nance controlling and planning departments in the large companies. The PMS were usually developed at those departments. They represented the central units communicating with many other departments regarding the PMS and its parts and components. A somewhat unusual fi nding is that the fi rms with a higher profi tability had a tendency to use less relative accounting metrics (3.15 vs. 3.95). The other characteristics of the companies
had no infl uence on the choice of the performance measures.
There are a few studies that were conducted in several countries on the topic of the acceptance of diff erent metrics. The results are variegated and should be taken with a large grain of salt. A research conducted in the USA in 1998 into the EVA acceptance of the Fortune 500 companies revealed that only 9.4% of the companies specifi cally stated that they used EVA as a performance measure, as a „trendy” tool (Abdeen & Haight, 2002). Referring to the research conducted by the Institute of Management Accountants, M. W. Meyer (2004) argues that, in 1995, 18% of the largest US companies used EVA and in 1996, „34% of the companies actually used EVA”! According to a survey conducted by the Business Finance Magazine in 20048, 33% of the companies used the BSC, whereas 18% of the companies used EVA. However, the large companies (with revenues of more than $1 billion) used the BSC in even 59% of the cases, and 33% of them used EVA. G. Speckbacher et al (2003) found that about a quarter of the most important publicly traded fi rms (26%) in the German-speaking countries (Germany, Austria and Swiz erland) used the BSC, while the majority of them used it in the simplest way. They also noticed that the larger companies (measured as the number of employees) were more likely to use the BSC while the retail industry used this metric signifi cantly less. M. Marc, D. Peljhan, N. Ponikvar, A. Sobota i M. Tekavcic (2010). found that even 68% of the large Slovenian companies used the BSC or some other Table 4 The frequency of the use of diff erent CPM
Metric
All Mean
% use Mean Size Industry Internation. Diversifi c. Leverage Public Profi tability
S L O F N-I I UnD D UnL Lev N-P P LP HP
ACC
EARN 82.90 4.31 4.00 4.71*** 4.29 4.33 4.11 4.40 4.30 4.33 4.22 4.48 4.28 4.45 4.38 4.22 ACC
ROR 64.10 3.61 3.11 4.25*** 3.68 3.65 2.63 4.02*** 3.54 3.78 3.46 3.87 3.58 3.73 3.95 3.15** EVA 25.00 2.30 1.78 2.96*** 2.26 2.33 1.58 2.60*** 2.30 2.28 2.32 2.26 2.36 2.00 2.49 2.04 BSC 18.80 2.22 1.92 2.61** 2.1 2.33 1.79 2.40* 2.28 2.06 2.17 2.30 2.13 2.64 2.24 2.19
integrated PMS. However, comparing the results of the two studies conducted in 2003 and 2008, they noticed that the Slovenian companies still preferred fi nancial measures to non-fi nancial ones. Another investigation about the use of the BSC within small companies conducted in the UK and Cyprus (Giannopoulos, Holt, Khansalar & Cleanthous, 2013) showed that awareness was signifi cantly higher in Cyprus (45%) than in the UK (20%). However, the percentage of the „aware” companies that really used the BSC was the same in both countries (25%).
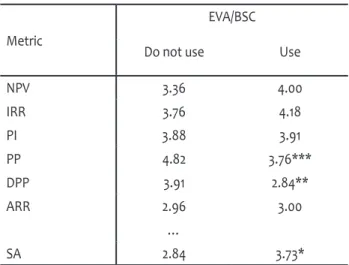
Ultimately, we asked ourselves whether there was a meaningful relationship in the use of the CBM and the use of the CPM. We expected that the companies increasingly using EVA or the BSC also used the DCF metrics more in the area of capital budgeting. The results are presented in Table 5.
Table 5 The simultaneous use of the CBM and the CPM
Metric
EVA/BSC
Do not use Use
NPV 3.36 4.00
IRR 3.76 4.18
PI 3.88 3.91
PP 4.82 3.76***
DPP 3.91 2.84**
ARR 2.96 3.00
…
SA 2.84 3.73*
Source: Authors
The companies that used modern corporate performance metrics also used the DCF metrics (the NPV, the IRR and the PI) to a greater extent, but the diff erence was not statistically signifi cant. However, these companies used the traditional CBM, namely the PP and the DPP, less to a statistically signifi cant extent. Finally, we also found that the managers of these
companies had greater propensity towards a scenario analysis.
CONCLUSION
were also inclined to use signifi cantly more the traditional, non-DCF capital budgeting metrics. The previously described diff erences in the presence of diff erent metrics across the companies with diff erent characteristics clearly confi rmed our third hypothesis. This study opened possibilities for several future researches. Longitudinal studies are quite a logical (and usual) extension to this kind of research subjects because of the possibility of changing the mentioned practices. Another very interesting thing could be a simultaneous research across the countries in the region because many of the surveyed companies have their subsidiaries in those countries with some autonomy in investment decision making. In the end, a special study can be conducted with the purpose of fi nding out whether using sophisticated metrics leads to a bet er fi nancial performance.
ENDNOTES
1 The term methods of capital budgeting is usually used in the literature; nevertheless, the term capital budgeting metrics can also be found to be in use (Brigham & Houston, 2012, 400).
2 All quantitative data refer to the day of 31st Dec. 2013 and were collected from the website of The Serbian Business Registers Agency (www.apr.rs).
3 The same threshold was used by J. R. Graham and C. R.
Harvey (2001).
4 The profi tability index is also referred to as the benefi t-cost
ratio.
5 We were guided by J. C. F. de Winter and D. Dodou’s (2010) conclusion, revealing that the t-test could be used instead of
the Mann-Whitney-Wilcoxon test since the two tests had an
equivalent power.
6 Besides, this attitude was usually characterized as a wrong
orientation because the NPV is described in textbooks as a
superior method. Nevertheless, the objection is not apposite since managers do not necessarily remember all the lessons learnt during their studies.
7 Except for the ARR.
8
http://businessfinancemag.com/planning-budgeting-amp-reporting/performance-managements-growing-pains, accessed on the day of 28th Feb. 2015
REFERENCES
Abden, A. M., & Haight, T. G. (2002). A Fresh Look At Economic Value Added: Empirical Study Of The Fortune Five-Hundred Companies. The Journal of Applied Business Research, 18(2), 27-36.
Andrés, P. de, Fuente, G. de, & San Martin, P. (2014). Capital budgeting practices in Spain. Business Research Quarterly,
(Article in press), ht p://dx.doi.org/10.1016/j.brq.2014.08.002. Baker, H. K., Dut a, S., & Saadi, S. (2011). Corporate fi nance
practices in Canada: Where do we stand? Multinational Finance Journal, 15(3/4), 157-192.
Brigham, E. F., & Houston, J. F. (2012). Fundamentals of Financial Management. Concise Edition, Cengage Learning.
Brounen, D., de Jong, A., & Koedijk, K. (2004). Corporate fi nance in Europe: Confronting theory with practice.
Financial Management, 33(4), 71-101.
Correia, C. (2012). Capital budgeting practices in South Africa: A review. South African Journal of Economic and Management Sciences, 43(2), 11-29.
Danielson, M. G., & Scot , J. A. (2006). The capital budgeting decisions of small businesses. Journal of Applied Finance, 16(2), 45-56.
Dedi, L., & Orsag, S. (2007). Capital Budgeting Practices: A Survey of Croatian Firms. South East European Journal of Economics and Business, 2(1), 59-67. doi:
10.2478/v10033-007-0016-y
de Winter, J. C. F., & Dodou, D. (2010). Five-point Likert items: t test versus Mann-Whitney-Wilcoxon. Practical Assessment, Research & Evaluation, 15(11), 1-16.
Domanovic, V. (2013). The eff ectiveness of the performance measurement in terms of contemporary business environment. Economic Horizons, 15(1), 33-46. doi:10.5937/
ekonhor1301031D
Đuričin, D., Janošević, S., i Kaličanin, Đ. (2013). Menadžment i
strategija. Beograd, Republika Srbija: Ekonomski fakultet.
Graham, J. R., & Harvey, C. R. (2001). The theory and practice of corporate fi nance: Evidence from the fi eld. Journal of Financial Economics, 60(2-3), 187-243.
doi:10.1016/S0304-405X(01)00044-7
practices of listed fi rms in Singapore. Singapore Management Review, 20(1), 9-23.
Giannopoulos, G., Holt, A., Khansalar, E., & Cleanthous, S. (2013). The Use of The Balanced Scorecard in Small Companies. International Journal of Business and Management, 8(14), 1-22. doi: 10.5539/ijbm.v8n14p1
Ivanišević, M. (2012). Poslovne fi nansije. Beograd, Republika Srbija: Ekonomski fakultet.
Jog, V. M., & Srivastava, A. (1995). Capital Budgeting Practices in Corporate Canada. Financial Practice and Education, 5(2),
37-43.
Kaličanin, Đ. (2005). Merenje performansi zasnovano na vrednosti. Ekonomika preduzeća, 53(3-4), 91-100.
Kaličanin, Đ. (2006). Menadžment vrednosti preduzeća. Beograd. Republika Srbija: Ekonomski fakultet.
Kaplan, R. S., & Norton, D. P. (1992). The balanced scorecard – measures that drive performance. Harvard Business Review, 70(1), 71-79.
Kaplan, R. S., & Norton, D. P. (1996). The Balanced Scorecard: Translating Strategy into Action. Boston, Massachuset s:
Harvard Business School Press.
Kaplan, R. S., & Norton, D. P. (2000). Having Trouble with Your Strategy? Then Map It! Harvard Business Review, 78(5),
167-176.
Kester, G., Chang, R. P., Echanis, E. S., Haikal, S., Isa, M. Md., Skully, M. T., Tsui, K. C., & Wang, C. J. (1999). Capital budgeting practices in the Asia-Pacifi c region: Australia, Hong Kong, Indonesia, Malaysia, Philippines, and Singapore. Financial Practice and Education, 9(1), 25-33.
Lazaridis, I. (2004). Capital budgeting Practices: A survey in the Firms in Cyprus. Journal of Small Business Management, 42(4), 427-433. doi: 10.1111/j.1540-627X.2004.00121.x
Lintner, J. (1956). Distribution of incomes of corporations among dividends, retained earnings, and taxes. The American Economic Review, 46(2), 97-113.
Marc, M., Peljhan, D., Ponikvar, N., Sobota, A., & Tekavcic, M. (2010). Performance Measurement in Large Slovenian Companies: An Assessment of Progress. International Journal of Management & Information Systems, 14(5), 129-139.
Meyer, M. W. (2004) Finding performance: The new discipline in management, In A. Neely (Ed.). Business performance measurement: Theory and practice (pp. 113-124). New York, NY:
Cambridge University Press.
Micheli, P., Mura, M., & Agliati, M. (2011). Exploring the roles of performance measurement systems in strategy implementation: The case of a highly diversifi ed group of fi rms. International Journal of Operations & Production Management, 31(10), 1115-1139. ht p://dx.doi.
org/10.1108/01443571111172453
Moore, J. S., & Reichert, A. K. (1983). An analysis of the fi nancial management techniques currently employed by large US corporations. Journal of Business Finance & Accounting, 10(4),
623-645. doi: 10.1111/j.1468-5957.1983.tb00456.x
Niven, P. R. (2006). Balanced Scorecard Step-by-step: Maximizing Performance and Maintaining Results. 2nd ed. John Wiley &
Sons, Inc.
Parmenter, D. (2007). Key Performance Indicators: Developing, Implementing and Using Winning KPI’s. New Jersey: John
Wiley & Sons.
Pike, R. (1996). A longitudinal survey on capital budgeting practices. Journal of Business Finance & Accounting, 23(1),
79-92. doi: 10.1111/j.1468-5957.1996.tb00403.x
Ryan, P. A., & Ryan, G. P. (2002). Capital budgeting practices of the Fortune 1000: How have things changed? Journal of Business and Management, 8(4), 355-364.
Sandahl, G., & Sjögren, S. (2003). Capital budgeting methods among Sweden’s largest groups of companies: The state of the art and a comparison with earlier studies. International Journal of Production Economics, 84(1), 51-69. doi:10.1016/
S0925-5273(02)00379-1
Simons, R. (2000). Performance Measurement & Control Systems for Implementing Strategy: Text & Cases. Prentice Hall, Inc.
Speckbacher, G., Bischof, J., & Pfeiff er, T. (2003). A descriptive analysis on the implementation of Balanced Scorecards in German-speaking countries. Management Accounting Research, 14(4), 361-388. doi:10.1016/j.mar.2003.10.001
Stančić, P., Todorović, M., & Čupić, M. (2012). Value-based management and corporate governance: A study of Serbian corporations. Economic Annals, 57(193), 93-112. doi:10.2298/
EKA1293093S
Todorović, M. (2010). Poslovno i fi nansijsko restrukturiranje
preduzeća. Beograd. Republika Srbija: Ekonomski fakultet.
Truong, G., Partington, G., & Peat, M. (2008). Cost of capital estimation and capital budgeting practice in Australia.
Australian Journal of Management, 33(1), 95-121. doi:
10.1177/031289620803300106
The Journal of Business Perspective, 13(3), 1-17. doi:
10.1177/097226290901300301
Miroslav Todorovic is an Associate Professor at the Faculty of Economics, University of Belgrade, Belgrade, the Republic of Serbia, where he teaches the subjects of Business Finance, Corporate Restructuring and Auditing (undergraduate studies), and Issues in Corporate Finance, Issues in Auditing, Strategic Finance and Investment Management and Policy (master studies). He also teaches courses in the PhD studies at the Faculty of Economics in Belgrade and the Faculty of Economics in Kragujevac.
Djordje Kalicanin is an Associate Professor at the Faculty of Economics, University of Belgrade, Belgrade, the Republic of Serbia, where he acquired all his degrees. He teaches the courses in Strategic Management, Strategic Finance and Business Strategy. He is the author of articles in the scientifi c fi elds of strategic management, business planning and value-based management.
Aleksandra Nojkovic is an Associate Professor at the Faculty of Economics, University of Belgrade, Belgrade, the Republic of Serbia, on the courses in Econometrics and Time Series Analysis. She received her PhD at the Faculty of Economics, University of Belgrade. Her research interests are focused on macro-econometric modelling, the time series analysis and micro-econometrics.
Received on 13th March 2015,
after revision, accepted for publication on 6th April 2015.