Trends and Determinants of Antiretroviral
Therapy Patient Monitoring Practices in
Kenya and Uganda
Emily Dansereau1, Emmanuela Gakidou1, Marie Ng1, Jane Achan2, Roy Burstein1, Brendan DeCenso3, Anne Gasasira4, Gloria Ikilezi1, Caroline Kisia5, Samuel H. Masters6, Pamela Njuguna7, Thomas A. Odeny8, Emelda A. Okiro9, D. Allen Roberts1, Herbert C. Duber1*
1Institute for Health Metrics and Evaluation, University of Washington, Seattle, Washington, United States of America,2Department of Pediatrics and Child Health, Makerere University, Kampala, Uganda,3RTI International, Research Triangle Park, North Carolina, United States of America,4African Leaders Malaria Alliance, Kampala, Uganda,5Action Africa Health-International, Nairobi, Kenya,6University of North Carolina, Chapel Hill, North Carolina, United States of America,7IFC World Bank Group, Nairobi, Kenya,
8Department of Epidemiology, University of Washington, Seattle, Washington, United States of America,
9Bill & Melinda Gates Foundation, Seattle, Washington, United States of America
Abstract
Introduction
Patients receiving antiretroviral therapy (ART) require routine monitoring to track response to treatment and assess for treatment failure. This study aims to identify gaps in monitoring practices in Kenya and Uganda.
Methods
We conducted a systematic retrospective chart review of adults who initiated ART between 2007 and 2012. We assessed the availability of baseline measurements (CD4 count, weight, and WHO stage) and ongoing CD4 and weight monitoring according to national guidelines in place at the time. Mixed-effects logistic regression models were used to ana-lyze facility and patient factors associated with meeting monitoring guidelines.
Results
From 2007 to 2012, at least 88% of patients per year in Uganda had a recorded weight at ini-tiation, while in Kenya there was a notable increase from 69% to 90%. Patients with a docu-mented baseline CD4 count increased from 69% to about 80% in both countries. In 2012, 83% and 86% of established patients received the recommended quarterly weight monitor-ing in Kenya and Uganda, respectively, while semiannual CD4 monitormonitor-ing was less com-mon (49% in Kenya and 38% in Uganda). Initiating at a more advanced WHO stage was associated with a lower odds of baseline CD4 testing. On-site CD4 analysis capacity was associated with increased odds of CD4 testing at baseline and in the future.
a11111
OPEN ACCESS
Citation:Dansereau E, Gakidou E, Ng M, Achan J, Burstein R, DeCenso B, et al. (2015) Trends and Determinants of Antiretroviral Therapy Patient Monitoring Practices in Kenya and Uganda. PLoS ONE 10(8): e0135653. doi:10.1371/journal. pone.0135653
Editor:Anil Kumar, University of Missouri-Kansas City, UNITED STATES
Received:June 4, 2015
Accepted:July 23, 2015
Published:August 14, 2015
Copyright:© 2015 Dansereau et al. This is an open access article distributed under the terms of the
Creative Commons Attribution License, which permits unrestricted use, distribution, and reproduction in any medium, provided the original author and source are credited.
Data Availability Statement:All underlying data are publicly available through the Global Health Data Exchange (GHDx):http://ghdx.healthdata.org/record/ uganda-access-bottlenecks-costs-and-equity-project-2012.
Discussion
Substantial gaps were noted in ongoing CD4 monitoring of patients on ART. Although guidelines have since changed, limited laboratory capacity is likely to remain a significant issue in monitoring patients on ART, with important implications for ensuring quality care.
Introduction
Over the past decade there has been a massive scale-up of antiretroviral therapy (ART) in sub-Saharan Africa. Between 2003 and 2012, the number of people receiving ART in the region rose from 100,000 to 7.5 million [1,2]. Kenya and Uganda were among the countries that rap-idly expanded ART services during this time. In Kenya, the number of patients receiving ART more than doubled between 2008 and 2013, rising from 237,881 to 656,359 [3]. In Uganda, the number of people on ART has increased by more than 100,000 per year, from 313,117 in 2011 to 570,486 by late 2013 [4,5]. With more patients on treatment, the need to evaluate patients for ART eligibility, and monitor patients once on treatment, has also increased.
At the time of ART initiation, proper evaluation can identify severely underweight patients, as well as those with very low CD4 counts who are at higher risk of poor outcomes and may require closer clinic and provider follow-up [6,7]. Further, clinical staging and/or CD4 counts are the primary eligibility criteria for ART initiation among non-pregnant adults in most of sub-Saharan Africa [8].
Once initiated, monitoring a patient’s response to therapy allows providers to detect potential adherence problems and treatment failure. It is critical to promptly identify treatment failure, as switching to a second-line regimen for these patients is essential for reducing mortality risk and preventing the spread of drug resistance [9–11]. Until recently, guidelines relied heavily on cal and immunological monitoring, a combination that has been shown to be superior than clini-cal monitoring alone [12–16]. However, the World Health Organization (WHO), Kenya, and Uganda have recently recommended viral load monitoring, given its better sensitivity, specificity, and timeliness in detecting treatment failure [8,17–20]. Nonetheless, clinical and immunological measures are still recommended in the absence of viral load testing.
Despite the need for risk stratification and ongoing monitoring while on ART, relatively lit-tle is known about how these guidelines are followed in practice. Laboratory testing in sub-Saharan Africa has largely been hindered by inadequate infrastructure, equipment, and reagent shortages, and low availability of skilled laboratory professionals [21,22]. Additionally, moni-toring requires regular care-seeking by patients with HIV, actions that can be limited by finan-cial, geographical, and psychosocial factors [23–26].
As Kenya and Uganda pursue new monitoring guidelines that include regular viral load test-ing, it is important to understand how well prior guidelines were followed and to consider why they may have fallen short in practice. In this paper, we assess recent CD4 and weight monitor-ing practices and examine facility- and patient-level characteristics associated with meetmonitor-ing national monitoring guidelines.
Methods
Study sample
This study used data from a subset of facilities from a larger, multi-country facility-based project that took place in Kenya and Uganda (Access, Bottlenecks, Costs, and Equity [ABCE]
at the time of the study. No commercial entities had any role in any component of this study or its funding.
project) [27]. Nationally representative facility samples were constructed for Kenya and Uganda using a two-step, stratified random sampling process detailed elsewhere [28,29]. In sum, subnational units (districts or counties) were stratified by country-specific characteristics (e.g., socioeconomic features, access to health care, etc.), and districts or counties were ran-domly selected from each stratum; urban epicenters (Kampala for Uganda; Nairobi and Mom-basa for Kenya) were purposely included in addition to randomly selected districts or counties. Within each randomly selected district or county, facilities were stratified by their govern-ment-determined level of complexity and then randomly selected until a pre-determined quota was met for each facility type.
Health facilities that declined study participation or where access to the facility was limited due to safety, travel distance, or time constraints were replaced with other similar facilities within the same district by the country team when a suitable replacement facility was identi-fied. Data collection took place from April to November 2012 in both countries.
At all selected facilities that provided ART services, we conducted a retrospective chart review of adult patients (18 years and older) who initiated ART 6 to 60 months prior to the sur-vey date. In addition to patients actively in care, we sought to include the charts of all trans-ferred, defaulted, and deceased patients. We received electronic medical records for all patients meeting inclusion criteria at four facilities in Kenya. At the remaining facilities in both coun-tries, the facility administrator reported the total number of eligible charts, and we sampled up to 250 charts using an equal-probability procedure. At facilities with less than 250 charts, we included all charts in our study. Two facilities in Uganda provided electronic records for the sampled patients, while all other information was extracted from paper charts.
Data collection
Trained research associates interviewed facility administrators to collect information about facility management, resources, practices, and patient volumes. They then extracted informa-tion related to patient demographics, initiainforma-tion characteristics, treatment regimen, outcomes, full visit history, and all test results (CD4 count, weight, and viral load) from the sampled ART charts. Research associates also searched each patient’s folder for documentation of weight, CD4 count, or viral load tests that were not recorded in the standard chart and extracted the relevant information.
We applied sample weights based on the reported number of adult patients in each facility’s ART program, such that our reported values are representative of all patients at the sampled facilities. Analyzes related to initiation were weighted based on the annual number of new initi-ates, while analyzes for ongoing monitoring used the annual number of enrolled patients. We linearly extrapolated patient numbers for the 9% of facility-years where these data were not reported. We also extrapolated patient numbers for all facilities in 2012 as the facility survey only collected information through 2011.
Describing monitoring practices in relation to minimum guidelines
We examined whether each patient met existing national guidelines for minimum monitoring at baseline and once they were established on therapy. These guidelines were consistent across countries and years for our study period (2007–2012) [15,16,30].
After the initiation period (typically defined as the first six months) monitoring guidelines called for a weight measurement every three months and CD4 measurement every six months, at minimum [15,16,30]. For each calendar month from 2009 to 2012, we restricted our denom-inator to patients who were (a)established, meaning they initiated ART at least six months before the given month, and (b)retained, meaning they were alive and on treatment during the given month, and not transferred, dead, or defaulted (i.e., no visit for six months and never returning). A patient met CD4 testing guidelines for a given month if a CD4 test was recorded at any point in the prior six months. Likewise, they met weight guidelines if a weight measure was recorded in the prior three months. If a patient did not have a test recorded during a speci-fied time period, we determined whether the patient visited the facility during that period with-out receiving a test. Results for a given facility type-country-month are only shown if at least 50 charts were included in the calculation.
Determinants of baseline and routine monitoring
We used a series of mixed-effects logistic regressions to assess factors associated with meeting minimum guidelines. For each country, models were run at the patient level using facility ran-dom effects.
Two separate analyzes were performed. The first examined determinants of having a base-line CD4 test and weight measurement, run as separate models, among patients who initiated therapy between 2011 and 2012. This group, the mostly recently initiating patients in our sam-ple, was selected because determinants of testing may have changed over time and more recently measured factors are most relevant to policy and practice.
The second set of analyzes examined the extent to which established patients were meeting monitoring guidelines at the time of the survey. Patients were included in this analysis if (1) they were alive and in care at the time of the survey rather than transferred, dead, or defaulted; and (2) they had initiated at least 12 months prior to the survey, to ensure results were not influenced by elevated testing in the period immediately following initiation. Separate models examined two binary dependent variables: (1) CD4 test recorded during the six months prior to record extraction; and (2) weight recorded in the three months prior to record extraction.
Independent variables were selecteda prioribased on potential theoretical relationships with monitoring practices. All models included patient-level characteristics (age and sex), as well facility-level indicators including facility type (hospital or health center); ownership (pub-lic or private); age of ART program; on-site CD4 analysis capacity; receipt of HIV-specific staff training during the past year; and whether nurses led patient treatment.
Models assessing baseline CD4 and weight measurements included an indicator of baseline disease severity as categorized by four WHO stages.
Models examining recent measurements for established patients included duration on ART and binary indicators capturing whether the patient showed signs of WHO-defined immuno-logical or clinical failure in the six months preceding the testing window of interest. Per WHO definitions [8], potential immunological failure was defined as having a CD4 count lower than 100 or experiencing a CD4 count falling to baselines levels. Potential clinical failure was defined as experiencing weight loss exceeding 10% from the patient’s highest weight. Other clinical cri-teria could not be included due to inconsistent recordkeeping.
All analyzes were conducted in Stata 13.1 (Stata Corp., College Station, Texas, USA).
Ethical considerations
Ethics Review Committee) and Uganda (Makerere University School of Medicine Research Ethics Committee). Patient consent for review of clinical charts was not obtained, as all infor-mation extracted from clinical charts was anonymized and de-identified prior to analysis.
Results
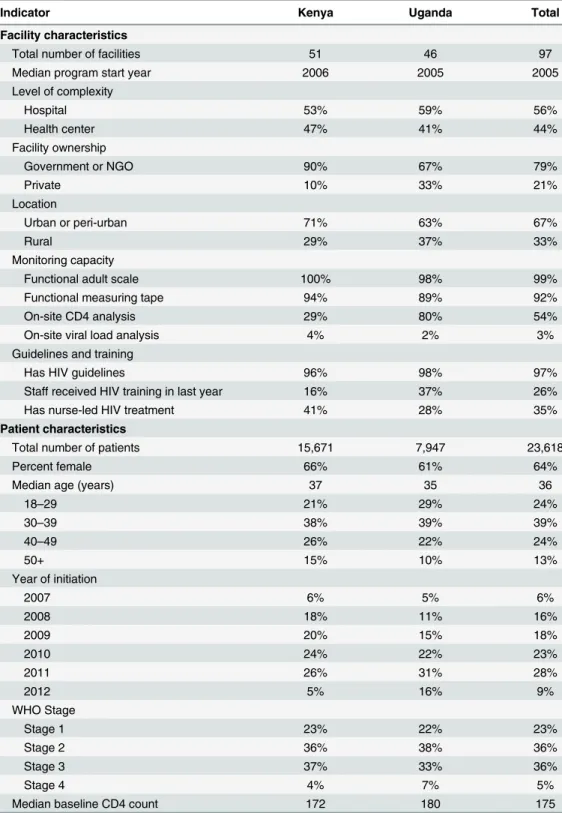
Data from 23,618 patient charts were extracted from 97 facilities offering ART (15,671 charts from 51 facilities in Kenya and 7,947 charts from 46 facilities in Uganda).Table 1provides an overview of sampled facility and patient characteristics.
Facility characteristics
The sampled facilities were largely publicly-owned (79%) and urban (67%). Most facilities had HIV guidelines available (97%), but only 26% had staff with HIV-specific training during the previous year. Ugandan facilities in our sample (80%) were more likely to have on-site CD4 analysis capacity than those in Kenya (29%). Most facilities without CD4 analysis capacity took samples on-site and shipped them elsewhere for analysis; only 3% did not offer any CD4 test-ing. One hospital each in Uganda and Kenya reported capacity to run viral load assays. Func-tional adult weight measurement scales (99%) and measuring tapes (92%) were nearly universally available.
Patient characteristics
The majority of patients were female (64%) with a median age of 36 at initiation. When recorded, the median baseline CD4 count was 175 and 41% of patients were classified as WHO stage 3 or 4. Over half of patients initiated in 2010 or 2011.
Baseline monitoring
Between 2007 and 2012, at least 88% of patients had a WHO stage recorded at initiation across country-years (Fig 1). Weight was recorded for over 94% of patients from all initiating cohorts in Uganda, while the percentage of Kenyan patients with a baseline weight measurement increased from 69% in 2007 to 90% in 2012. Baseline CD4 testing rates also increased between 2007 and 2012, rising from 69% to 80% in Uganda and from 69% to 81% in Kenya. Less than 1% of patients received a baseline viral load measure.
Monitoring of established patients
In 2012, 83% and 86% of established patients met the recommended quarterly weight monitor-ing in Kenya and Uganda, respectively (Fig 2). This was an improvement from 2009, when 76% of Kenyan and 72% of Ugandan patients met weight-monitoring guidelines. Trends in weight monitoring were either stable or showed improvement across facility types in both countries. In particular, 85% of patients at rural health centers in Uganda met weight monitor-ing guidelines in 2012, compared to 49% in 2009. By 2012, all types of facilities in both coun-tries had at least 80% of established ART patients receiving the recommended weight
measures. These gains occurred in parallel with increases in ART visit frequency, with the pro-portion of patients with a facility visit every three months increasing from 81% in 2009 to 90% in 2012.
Table 1. Characteristics of sampled facilities and patients at initiation.
Indicator Kenya Uganda Total
Facility characteristics
Total number of facilities 51 46 97
Median program start year 2006 2005 2005
Level of complexity
Hospital 53% 59% 56%
Health center 47% 41% 44%
Facility ownership
Government or NGO 90% 67% 79%
Private 10% 33% 21%
Location
Urban or peri-urban 71% 63% 67%
Rural 29% 37% 33%
Monitoring capacity
Functional adult scale 100% 98% 99%
Functional measuring tape 94% 89% 92%
On-site CD4 analysis 29% 80% 54%
On-site viral load analysis 4% 2% 3%
Guidelines and training
Has HIV guidelines 96% 98% 97%
Staff received HIV training in last year 16% 37% 26%
Has nurse-led HIV treatment 41% 28% 35%
Patient characteristics
Total number of patients 15,671 7,947 23,618
Percent female 66% 61% 64%
Median age (years) 37 35 36
18–29 21% 29% 24%
30–39 38% 39% 39%
40–49 26% 22% 24%
50+ 15% 10% 13%
Year of initiation
2007 6% 5% 6%
2008 18% 11% 16%
2009 20% 15% 18%
2010 24% 22% 23%
2011 26% 31% 28%
2012 5% 16% 9%
WHO Stage
Stage 1 23% 22% 23%
Stage 2 36% 38% 36%
Stage 3 37% 33% 36%
Stage 4 4% 7% 5%
Median baseline CD4 count 172 180 175
time (22% in 2012). Kenyan hospitals showed the greatest improvement in CD4 testing rates, rising from 42% in 2009 to 49% in 2012. In contrast, urban health centers in Uganda experi-enced declines in CD4 testing during this time, falling from 50% to 35%. Notably, 97% of estab-lished ART patients had a clinical visit every six months in 2012, yet fewer than 50% of patients received a CD4 test every six months.
Predictors of baseline testing
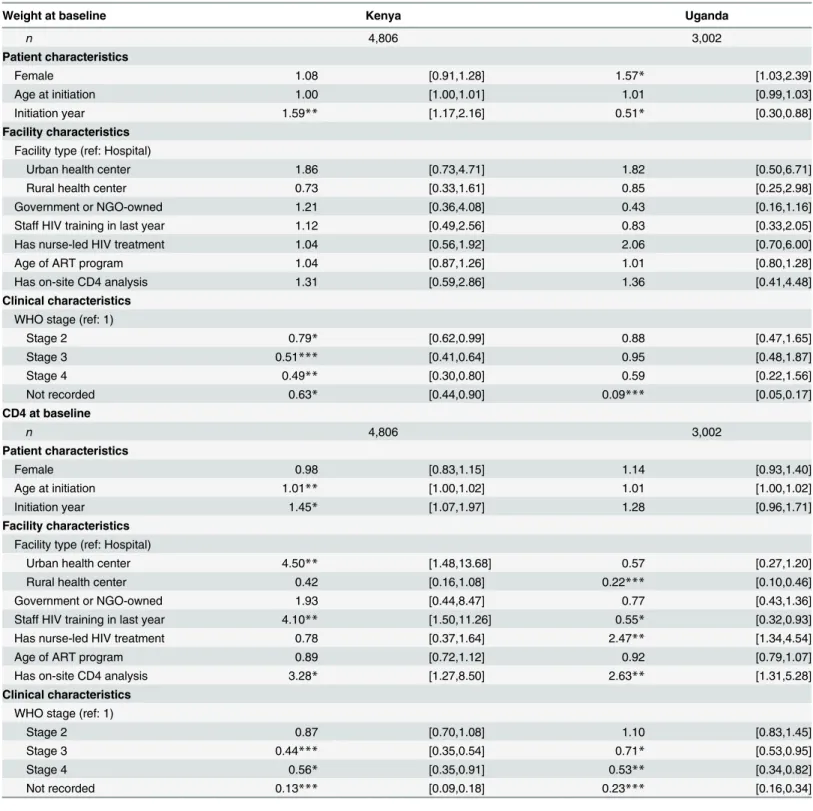
Controlling for patient and facility characteristics, a more advanced baseline WHO stage was associated with lower odds of baseline weight testing in Kenya (odds ratio [OR] = 0.49, 95% confidence interval [CI] = 0.30–0.80 for WHO stage 4 with respect to WHO stage 1) and lower odds of baseline CD4 testing in both countries (Kenya: OR = 0.56, 95% CI = 0.35–0.91; Uganda: OR = 0.53, 95% CI = 0.34–0.82) (Table 2).
Having on-site CD4 analysis capacity was associated with increased odds of baseline CD4 testing in Kenya (OR = 3.28, 95% CI = 1.27–8.50) and Uganda (OR = 2.63, 95% CI = 1.31–
5.28). Compared to patients receiving care at hospitals, patients at urban health centers had increased odds of receiving a baseline CD4 test in Kenya (OR = 4.50, 95% CI = 01.48–13.68) and those at rural health centers had reduced odds in Uganda (OR = 0.22, 95% CI = 0.10–
0.46). Kenyan patients at facilities with staff who received HIV training in the past year had an increased odds of a baseline CD4 test (OR = 4.10, 95% CI = 1.50–11.26); by contrast, receipt of HIV-specific training in Uganda was associated with a lower odds (OR = 0.55, 95% CI = 0.32–
0.93). Ugandan patients at nurse-led programs had an increased odds for the receipt of baseline CD4 testing (OR = 2.47, 95% CI = 1.34–4.54).
Fig 1. Percent of patients receiving baseline measurements by initiation year, 2007–2012.
Predictors of established patients receiving recommended
measurements during follow-up
In comparison with patients receiving ART at hospitals, Ugandan patients at urban health cen-ters had an increased odds of meeting weight guidelines (OR = 3.42, 95% CI = 1.65–7.08) and those at rural health centers had a reduced odds of meeting CD4 guidelines (OR = 0.21, 95% CI = 0.08–0.53). Patients at urban health centers had increased odds of meeting CD4 testing guidelines in Kenya (OR = 2.15, 95% CI = 1.13–4.09).
Kenyan patients had an increased odds of receiving a CD4 test in the past six months if they received care at a facility with staff who received HIV-specific training during the last year (OR = 2.74, 95% CI = 1.50–5.02). In Uganda, such training was associated with an increased odds for patients meeting weight guidelines (OR = 1.74, CI = 1.05–2.89), but a reduced odds for meeting CD4 testing guidelines (OR = 0.49, 95% CI = 0.24–0.98). In Uganda, patients who received care at a HIV program with nurse-led care also had increased odds of meeting CD4 testing guidelines (OR = 2.49, 95% CI = 1.17–5.30).
For established patients in Uganda, prior indications of immunological failure were associated with an increased odds of meeting weight monitoring guidelines (OR = 2.60, 95%
Fig 2. Percent of established patients meeting weight monitoring guidelines, 2009–2012.
CI = 1.27–5.29), while a previous indication of clinical failure was associated with an increased odds of meeting the semi-annual CD4 testing guidelines (OR = 1.34, 95% CI = 1.00–1.80) (Table 3).
Discussion
Kenya and Uganda have both made tremendous gains in enrolling patients on ART. However, in the setting of increased financial constraints and attention towards quality of care, a careful examination of monitoring practices is essential. As monitoring guidelines for ART patients transition to include viral load testing, our findings raise relevant questions about clinic visit frequency, laboratory capacity, and adherence to international and national norms.
We found that patients were visiting the clinic quite frequently, and on average 90% of established patients had a visit every three months in 2012. Since most of these patients were likely to be stable and required little or no intervention, it is important to consider whether quarterly clinic visits for this established stable population on ART is necessary, as a reduction in visit frequency could have a significant impact on facility costs and efficiency [31]. Reducing ART visit frequency could also lessen the burden on patients, as exit interviews conducted as
Fig 3. Percent of established patients meeting CD4 monitoring guidelines, 2009–2012.
Table 2. Predictors of receiving baseline measurements: mixed effects logistic regression results for patients initiating in 2011–12.
Weight at baseline Kenya Uganda
n 4,806 3,002
Patient characteristics
Female 1.08 [0.91,1.28] 1.57* [1.03,2.39]
Age at initiation 1.00 [1.00,1.01] 1.01 [0.99,1.03]
Initiation year 1.59** [1.17,2.16] 0.51* [0.30,0.88]
Facility characteristics
Facility type (ref: Hospital)
Urban health center 1.86 [0.73,4.71] 1.82 [0.50,6.71]
Rural health center 0.73 [0.33,1.61] 0.85 [0.25,2.98]
Government or NGO-owned 1.21 [0.36,4.08] 0.43 [0.16,1.16]
Staff HIV training in last year 1.12 [0.49,2.56] 0.83 [0.33,2.05]
Has nurse-led HIV treatment 1.04 [0.56,1.92] 2.06 [0.70,6.00]
Age of ART program 1.04 [0.87,1.26] 1.01 [0.80,1.28]
Has on-site CD4 analysis 1.31 [0.59,2.86] 1.36 [0.41,4.48]
Clinical characteristics
WHO stage (ref: 1)
Stage 2 0.79* [0.62,0.99] 0.88 [0.47,1.65]
Stage 3 0.51*** [0.41,0.64] 0.95 [0.48,1.87]
Stage 4 0.49** [0.30,0.80] 0.59 [0.22,1.56]
Not recorded 0.63* [0.44,0.90] 0.09*** [0.05,0.17]
CD4 at baseline
n 4,806 3,002
Patient characteristics
Female 0.98 [0.83,1.15] 1.14 [0.93,1.40]
Age at initiation 1.01** [1.00,1.02] 1.01 [1.00,1.02]
Initiation year 1.45* [1.07,1.97] 1.28 [0.96,1.71]
Facility characteristics
Facility type (ref: Hospital)
Urban health center 4.50** [1.48,13.68] 0.57 [0.27,1.20]
Rural health center 0.42 [0.16,1.08] 0.22*** [0.10,0.46]
Government or NGO-owned 1.93 [0.44,8.47] 0.77 [0.43,1.36]
Staff HIV training in last year 4.10** [1.50,11.26] 0.55* [0.32,0.93]
Has nurse-led HIV treatment 0.78 [0.37,1.64] 2.47** [1.34,4.54]
Age of ART program 0.89 [0.72,1.12] 0.92 [0.79,1.07]
Has on-site CD4 analysis 3.28* [1.27,8.50] 2.63** [1.31,5.28]
Clinical characteristics
WHO stage (ref: 1)
Stage 2 0.87 [0.70,1.08] 1.10 [0.83,1.45]
Stage 3 0.44*** [0.35,0.54] 0.71* [0.53,0.95]
Stage 4 0.56* [0.35,0.91] 0.53** [0.34,0.82]
Not recorded 0.13*** [0.09,0.18] 0.23*** [0.16,0.34]
*p<0.05
**p<0.01 ***p<0.001
part of the larger ABCE project found that patients waited and traveled longer for ART services than other types of care [28,29]. A recent analysis from Kenya demonstrated the cost-effective-ness of a model that shifts care from health facilities to the community, thereby reducing the frequency of ART visits [32]. Another study showed that among virally suppressed patients, there was no difference in the probability of continued suppression among patients who returned for care at different frequencies (i.e., three, four, or six months later) [33]. Further
Table 3. Predictors of meeting CD4 and weight monitoring guidelines: mixed effects logistic regression results for established patients in care at the time of the survey.
Weight at time of survey Kenya Uganda
n 5162 3867
Patient characteristics
Female 1.05 [0.87,1.27] 1.07 [0.89,1.28]
Age at time of survey 1.01** [1.00,1.02] 1.00 [0.99,1.01]
Years on ART 1.15*** [1.07,1.24] 0.94 [0.87,1.02]
Facility characteristics
Facility type (ref: Hospital)
Urban health center 1.16 [0.44,3.03] 3.42*** [1.65,7.08]
Rural health center 0.60 [0.26,1.41] 0.73 [0.37,1.42]
Government/NGO owned 1.14 [0.32,3.97] 0.83 [0.49,1.41]
Staff HIV training in last year 1.57 [0.67,3.70] 1.74* [1.05,2.89]
Has nurse-led HIV treatment 0.71 [0.37,1.35] 1.03 [0.58,1.81]
Age of ART program 1.00 [0.83,1.21] 1.01 [0.88,1.15]
Has on-site CD4 analysis 0.68 [0.30,1.54] 0.69 [0.36,1.32]
Indications of failure in prior 6 months
Immunological criteria 0.90 [0.65,1.26] 2.60** [1.27,5.29]
Clinical criteria 0.77 [0.57,1.04] 1.28 [0.90,1.83]
CD4 at time of survey
n 5,162 3,867
Patient characteristics
Female 1.14* [1.00,1.30] 1.15 [0.97,1.36]
Age at time of survey 1.01* [1.00,1.01] 1.01* [1.00,1.02]
Years on ART 1.04 [0.99,1.10] 0.93 [0.87,1.00]
Facility characteristics
Facility type (ref: Hospital)
Urban health center 2.15* [1.13,4.09] 0.86 [0.35,2.13]
Rural health center 0.74 [0.40,1.36] 0.21** [0.08,0.53]
Government/NGO owned 1.23 [0.51,2.96] 0.93 [0.46,1.90]
Staff HIV training in last year 2.42** [1.35,4.33] 0.49* [0.24,0.98]
Has nurse-led HIV treatment 0.78 [0.49,1.22] 2.49* [1.17,5.30]
Age of ART program 0.92 [0.80,1.05] 1.06 [0.88,1.26]
Has on-site CD4 analysis 1.86* [1.05,3.31] 1.30 [0.54,3.14]
Indications of failure in prior 6 months
Immunological criteria 1.00 [0.79,1.27] 1.25 [0.83,1.87]
Clinical criteria 0.93 [0.74,1.17] 1.34* [1.00,1.80]
*p<0.05 **p<0.01 ***p<0.001
research is needed to establish whether refining the frequency of clinic visits yields similar results across ART program settings.
Our study found that most ART patients in our sample regularly visited facilities, suggesting that patient monitoring may be primarily limited by facility resources and actions rather than care-seeking behaviours. While low-tech, point-of-care weight monitoring was feasible and performed according to guidelines at most facilities, less than 50% of patients in care received a CD4 test during the previous six months in both Kenya and Uganda. Given that ART patient volumes dramatically increased during the study period, the overall number of CD4 tests has undoubtedly grown; at the same time, facilities barely kept pace or fell behind in the proportion of their patients receiving CD4 tests for continuous monitoring. In Uganda, we found that facilities where staff HIV training was performed within the prior year the odds of having a CD4 at baseline or afterwards was lower than in facilities where there was no such training. This could potentially be explained by an even more dramatic increase in patient volumes in facilities with additional training/expertise leading to demand for testing outstripping testing capacity. Alternatively, facilities where HIV training was performed may have noted less bene-fit in recurrent CD4 counts, and reserved testing for patients who appeared clinically ill or had another indication for CD4 testing. We also found that CD4 testing was strongly related to having on-site analysis capacity. As CD4 testing remains one of the primary means for deter-mining ART initiation, our results support equipping facilities to analyze CD4 tests, or at a minimum improving systems through which off-site CD4 test analysis can occur efficiently and at low cost. Our findings complement previous research on the benefits of point-of-care CD4 testing to reduce attrition between testing and initiation [34,35].
Experiences with off-site CD4 analysis are also highly relevant as countries begin scaling up viral load monitoring. While viral load testing offers benefits over immunological and clinical monitoring [8], this guideline shift does not expressly address the underlying issue of access to monitoring. For instance, Uganda plans to use its existing sample transport referral network to deliver and analyze viral load samples at a centralized location in Kampala; while this approach may help with the initial roll-out of viral load testing, it does not improve point-of-care needs and may remain limited by the same infrastructure challenges underlying CD4 testing [36]. New guidelines call for immunological testing in instances where viral load is unavailable [8,20], but our findings demonstrate that such alternatives (i.e., CD4 testing) may remain inac-cessible for many patients, particularly in rural areas. Greater policy attention is needed to address these limitations to laboratory capacity in sub-Saharan Africa, especially as the need for more ART services in rural areas is likely to grow. To this end, the development of effective point-of-care viral load testing could be an important innovation [37].
Despite these limitations, our study identifies a clear gap between prior immunological monitoring guidelines and clinical practice. These findings are particularly relevant as the number of patients eligible for ART continues to increase due to changing initiation guide-lines.5Future research will need to address the frequency of routine clinic visits and testing, while national HIV treatment programs will also need to look toward improving current labo-ratory capacity. Striking this balance in terms of patient visit quantity and quality is critical to ensuring that patients receive the maximum benefits of ART.
Acknowledgments
The authors would like to acknowledge all individuals who contributed to this study, including facility staff who gave their time for to complete all survey components; research associates and ABCE field team members who conducted data collection; the Kenyan and Ugandan Ministries of Health for their support and feedback; country collaborators in Uganda (Infectious Disease Research Collaboration) and Kenya (Action Africa Help-International); and IHME staff Nancy Fullman, Kelsey Moore, Annie Haakenstad, and Aubrey Levine for project management and editing.
Author Contributions
Conceived and designed the experiments: ED EG HCD. Performed the experiments: ED JA AG GI CK SHM PN. Analyzed the data: ED EG MN RB BD AG SHM TAO EAO DAR HCD. Wrote the paper: ED EG MN JA RB BD AG GI CK SHM PN TAO EAO DAR HCD.
References
1. UNAIDS. Access to Antiretroviral Therapy in Africa: Status report on progress towards the 2015 targets [Internet]. Available:http://www.unaids.org/en/media/unaids/contentassets/documents/
unaidspublication/2013/20131219_AccessARTAfricaStatusReportProgresstowards2015Targets_en. pdf
2. WHO. Antiretroviral therapy coverage in sub-Saharan Africa. In: WHO [Internet]. [cited 7 Aug 2014]. Available:http://www.who.int/hiv/data/art_coverage/en/
3. National AIDS Control Council. Kenya AIDS Response Progress Report [Internet]. 2014. Available: http://www.unaids.org/sites/default/files/country/documents/KEN_narrative_report_2014.pdf 4. Uganda AIDS Commission. HIV and AIDS Uganda Country Progress Report [Internet]. 2014.
Avail-able:http://www.unaids.org/sites/default/files/country/documents/UGA_narrative_report_2014.pdf 5. WHO. Global Update on HIV Treatment 2013 [Internet]. 2013. Available:http://www.unaids.org/sites/
default/files/media_asset/20130630_treatment_report_en_0.pdf
6. Liu E, Spiegelman D, Semu H, Hawkins C, Chalamilla G, Aveika A, et al. Nutritional Status and Mortality Among HIV-Infected Patients Receiving Antiretroviral Therapy in Tanzania. J Infect Dis. 2011; 204: 282–290. doi:10.1093/infdis/jir246PMID:21673040
7. Yiannoutsos CT, Johnson LF, Boulle A, Musick BS, Gsponer T, Balestre E, et al. Estimated mortality of adult HIV-infected patients starting treatment with combination antiretroviral therapy. Sex Transm Infect. 2012; 88 Suppl 2: i33–43. doi:10.1136/sextrans-2012-050658PMID:23172344
8. WHO. Consolidated guidelines on the use of antiretroviral drugs for treating and preventing HIV infec-tion: Recommendations for a public health approach. 2013.
9. Petersen ML, Tran L, Geng EH, Reynolds SJ, Kambugu A, Wood R, et al. Delayed switch of antiretrovi-ral therapy after virologic failure associated with elevated mortality among HIV-infected adults in Africa. AIDS Lond Engl. 2014; doi:10.1097/QAD.0000000000000349
10. Hamers RL, Sigaloff KCE, Kityo C, Mugyenyi P, de Wit TFR. Emerging HIV-1 drug resistance after roll-out of antiretroviral therapy in sub-Saharan Africa. Curr Opin HIV AIDS. 2013; 8: 19–26. doi:10.1097/ COH.0b013e32835b7f94PMID:23143140
12. UNAIDS, Médecins Sans Frontières. Speed up scale-up: strategies, tools and policies to get the best
HIV treatment to more people sooner. Geneva; 2012. pp. 1–23.
13. Mugyenyi P, Walker S, Hakim J, Munderi P, Gibb D, Kityo C, et al. Impact of routine laboratory monitor-ing over 5 years after antiretroviral therapy (ART) initiation on clinical disease progression of HIV-infected African adults: the DART Trial final results. 2009. Available:http://r4d.dfid.gov.uk/Output/ 181172/Default.aspx
14. Mermin J, Ekwaru JP, Were W, Degerman R, Bunnell R, Kaharuza F, et al. Utility of routine viral load, CD4 cell count, and clinical monitoring among adults with HIV receiving antiretroviral therapy in Uganda: randomised trial. BMJ. 2011;343. doi:10.1136/bmj.d6792
15. Ministry of Health, Uganda. National Antiretroviral Treatment and Care Guidelines for Adults, Adoles-cents, and Children. 2008.
16. Ministry of Health, Government of Kenya. Guidelines for antiretroviral therapy in Kenya, 4th edition. 2011.
17. Lynen L, Van Griensven J, Elliott J. Monitoring for treatment failure in patients on first-line antiretroviral treatment in resource-constrained settings. Curr Opin HIV AIDS. 2010; 5: 1–5. doi:10.1097/COH. 0b013e3283333762PMID:20046141
18. Sigaloff KCE, Hamers RL, Wallis CL, Kityo C, Siwale M, Ive P, et al. Unnecessary antiretroviral treat-ment switches and accumulation of HIV resistance mutations; two argutreat-ments for viral load monitoring in Africa. J Acquir Immune Defic Syndr 1999. 2011; 58: 23–31. doi:10.1097/QAI.0b013e318227fc34 19. Kenya Ministry of Health (MOH), National AIDS and STI Control Program (NASCOP). Guidelines on
use of antiretroviral drugs for treating and preventing HIV infection: A rapid advice. Nairobi, Kenya: MOH, NASCOP; 2014.
20. Uganda Ministry of Health (MOH). Addendum to the National Antiretroviral Treatment Guidelines. Kampala, Uganda: MOH; 2013.
21. Bélec L, Bonn J-P. Challenges in implementing HIV laboratory monitoring in resource-constrained set-tings: how to do more with less. Future Microbiol. 2011; 6: 1251–1260. doi:10.2217/fmb.11.121PMID: 22082287
22. Olmsted SS, Moore M, Meili RC, Duber HC, Wasserman J, Sama P, et al. Strengthening Laboratory Systems in Resource-Limited Settings. Am J Clin Pathol. 2010; 134: 374–380. doi:10.1309/ AJCPDQOSB7QR5GLRPMID:20716792
23. Hardon AP, Akurut D, Comoro C, Ekezie C, Irunde HF, Gerrits T, et al. Hunger, waiting time and trans-port costs: time to confront challenges to ART adherence in Africa. AIDS Care. 2007; 19: 658–665. doi: 10.1080/09540120701244943PMID:17505927
24. Duff P, Kipp W, Wild TC, Rubaale T, Okech-Ojony J. Barriers to accessing highly active antiretroviral therapy by HIV-positive women attending an antenatal clinic in a regional hospital in western Uganda. J Int AIDS Soc. 2010; 13: 37. doi:10.1186/1758-2652-13-37PMID:20863399
25. Tuller DM, Bangsberg DR, Senkungu J, Ware NC, Emenyonu N, Weiser SD. Transportation costs impede sustained adherence and access to HAART in a clinic population in southwestern Uganda: a qualitative study. AIDS Behav. 2010; 14: 778–784. doi:10.1007/s10461-009-9533-2PMID:19283464
26. Siedner MJ, Lankowski A, Tsai AC, Muzoora C, Martin JN, Hunt PW, et al. GPS-measured distance to clinic, but not self-reported transportation factors, are associated with missed HIV clinic visits in rural Uganda. AIDS Lond Engl. 2013; 27: 1503–1508. doi:10.1097/QAD.0b013e32835fd873
27. Institute for Health Metrics and Evaluation (IHME). Access, Bottlenecks, Costs, and Equity: ABCE Proj-ect Cross-Country Protocol. Seattle, WA: IHME; 2015.
28. Institute for Health Metrics and Evaluation (IHME). Health Service Provision in Kenya: Assessing Facil-ity CapacFacil-ity, Costs of Care, and Patient Perspectives. Seattle, WA: IHME; 2014.
29. Institute for Health Metrics and Evaluation (IHME). Health Service Provision in Uganda: Assessing Facility Capacity, Costs of Care, and Patient Perspectives. Seattle, WA: IHME; 2014.
30. Ministry of Health, Government of Kenya. Guidelines for antiretroviral therapy in Kenya, 3rd edition. 2005.
31. Siapka M, Remme M, Obure CD, Maier CB, Dehne KL, Vassall A, et al. Is there scope for cost savings and efficiency gains in HIV services? A systematic review of the evidence from low- and middle-income countries. Bull World Health Organ. 2014; 92: 499–511AD. doi:10.2471/BLT.13.127639PMID: 25110375
33. Buscher A, Mugavero M, Westfall AO, Keruly J, Moore R, Drainoni M-L, et al. The association of clinical follow-up intervals in HIV-infected persons with viral suppression on subsequent viral suppression. AIDS Patient Care STDs. 2013; 27: 459–466. doi:10.1089/apc.2013.0105PMID:23886048
34. Wynberg E, Cooke G, Shroufi A, Reid SD, Ford N. Impact of point-of-care CD4 testing on linkage to HIV care: a systematic review. J Int AIDS Soc. 2014; 17: 18809. doi:10.7448/IAS.17.1.18809PMID: 24447595
35. Hyle EP, Jani IV, Lehe J, Su AE, Wood R, Quevedo J, et al. The Clinical and Economic Impact of Point-of-Care CD4 Testing in Mozambique and Other Resource-Limited Settings: A Cost-Effectiveness Anal-ysis. PLoS Med. 2014; 11: e1001725. doi:10.1371/journal.pmed.1001725PMID:25225800
36. Riolexus AA. Viral Load Monitoring. 2014; Kampala, Uganda.