THE EFFECTS OF FEDERAL TAXES AND BENEFITS ON HOUSEHOLD
INCOME IN BRAZIL1
Rozane Bezerra de Siqueira* José Ricardo Nogueira**
Horácio Levy***
1. Introduction
Governments affect the standard of living of households through direct income transfers, through the provision of goods and services and by means of taxation. Around 68 per cent of Brazilian households receive some kind of cash transfer from the government, which accounts in average for 30 per cent of their incomes. All households in Brazil pay taxes directly on their income and/or indirectly on their consumption of goods and services, and many benefit from public expenditures on such services as health and education.
Brazil being a country with one of the most unequal income distribution in the world and where a large part of the population faces poverty, it is important to know how the costs and benefits associated with the government budget are distributed among the different socio-economic groups.
This study represents an attempt to identify the types of households which benefit from the federal government expenditures and those which finance them, and the size of gains and losses.
2. Methodology and Definitions
The values of taxes and benefits estimated in this study reflect the methodology adopted. In order to allow a critical interpretation of the results, this section briefly describes the main concepts, assumptions and data sources used.
Unit of analysis
The basic unit of analysis in this study is the household. A household is defined as comprising related or unrelated persons who live in the same dwelling and who usually pool their income. A major reason for using this unit of analysis is that spending on many items, such as housing and electricity, is largely joint spending by the members of the household, so that it would be difficult to apportion indirect taxes between smaller units. Benefits and taxes allocated
1
Preliminary version of a research report on the distributional impact of the Brazilian tax-benefit system. Please do not quote.
*Fundação Getulio Vargas, Rio de Janeiro, Brazil, siqueira@fgv.br
Benefits and taxes included in this study are restricted to those federal taxes and benefits that can reasonably be attributed to households. Therefore some government revenue and expenditure are not allocated, such as revenue form corporate taxes and spending on defense.
Some R$ 121 billion of taxes and R$ 116 billion of benefits have been allocated to households. This is equivalent to 55% and 54% respectively of total taxation revenue of Federal Government, which totaled around R$ 216 billion in 1999. The benefits allocated respond for about 77% of the total social expenditure by the Federal Government in 1999.2 See Boxes 1 and 2 of the Appendix for a description of each cash benefit and tax allocated in this study.
Cash benefits and direct taxes
Cash Benefits and direct taxes account, respectively, for 76% of the total amount of benefits and 27% of all taxes allocated in the present analysis. The allocation of cash benefits and direct taxes to households was carried out using a tax-benefit microsimulation model based on the 1999 household survey Pesquisa Nacional por Amostra de Domicílios – PNAD.3 Table A in the Appendix shows the estimated distribution of direct taxes among household groups.
The model allocates pensions to households as they are reported in the PNAD. The other cash transfers included in this study, as well as the direct taxes, are simulated by applying the rules for benefit eligibility and for tax liability to each individual or family in the PNAD. The simulated amounts are then validated using administrative data. In average, an above 90% matching with the administrative data have been obtained.
For the Bolsa-Escola programs4, we have opted in the present paper to simulate the coverage defined in the 2002 Federal Government budget rather than the 1999 situation. This is because expenditure on these programs have increased drastically since 1999 – yet it still represents only about 2% of the total benefits allocated.
Indirect taxes
In allocating indirect taxes, which amount to 73% of all taxes allocated, it was assumed that their incidence was fully shifted to the final consumer. The amount of indirect taxes paid by households was calculated as follows:
- the effective tax rates on final goods and services were estimated using input-output techniques5;
2
According to Levy et al (2002), social expenditure by the federal government in 1999 totaled R$ 150 billion (including tax expenditures for social purposes).
3
This model is an extended version of Micro-Sim, the static microsimulation model for Brazil described in Siqueira and Nogueira (2001).
4
This term actually refers to three different programs, the Bolsa Escola, the Bolsa Alimentação, and the Bolsa Criança Cidadã, which were lumped together for purpose of presentation in this paper.
5
- the estimated tax rates were applied to the 1995/96 household expenditure survey Pesquisa de Orçamentos Familiares – POF to calculate the amount of indirect taxes paid by POF households as a proportion of their incomes;
- these proportions were then used to estimate the payment of indirect taxes by the PNAD households groups defined in this paper.
It should be noted that, since POF covers only metropolitan areas, this procedure assumes that the tax burden on a household elsewhere in the country is the same as that on a metropolitan household with the same income. In addition, it is assumed that the definitions of income in POF and PNAD are compatible. Table B in the Appendix shows the estimated distribution of indirect taxes among household groups.
Non-cash benefits
Non-cash benefits allocated in the present analysis are health and education related to federal government expenditure. The inputed value of benefits were based on the cost to government of the provision of those services. Although this is a standard procedure in incidence studies (see Lakin, 2001), it involves the unrealistic assumption that the quality of the service received is the same for individuals from all income groups.
Health expenditure was distributed to households from information on the use of each type of health services, provided in the 1998 PNAD. Expenditure on public health and health research was distributed equally to each person, given the difficulty of defining who benefited from these outlays. The benefit allocated to households was the sum of each member’s benefits.
In allocating education benefits, we used the 1996 Pesquisa sobre Padrões de Vida – PPV, which provides information on the utilization of state education services by individuals in the Southeast and Northeast of Brazil. The estimated distribution of utilization of each kind of educational service across PPV households grouped by income was then used to allocate the 1999 Federal Government expenditures on education among the household groups considered in this study. Table C in the Appendix shows the estimated distribution of health and education services among decile groups of households.
Income concepts
3. Results
In the tables (figures) of results presented below, households are classified in decile (quintile) groups according to each household per capita gross income. Table 1 summarizes the estimated impacts of cash benefits and direct taxes on the distribution of income and on poverty in Brazil. It shows that the richest 10 per cent of households (according to per capita gross income) receive 44.8 per cent of all initial income. This compares with only 0.8 per cent for households in the bottom decile.
Table 1 – Percentage shares of household income, ratios of share of the top 20% to share of bottom 20%, Gini coefficients and proportions of poor households
Percentage share of income
Initial Income Gross Income Disposable Income Decile group1
Bottom 0.8 1.0 1.0
2nd 1.7 1.9 2.0
3rd 2.5 2.7 2.8
4th 3.6 3.6 3.7
5th 4.6 4.7 4.8
6th 5.8 6.0 6.2
7th 8.2 8.0 8.2
8th 11.3 10.8 11.1
9th 16.7 16.3 16.6
Top 44.8 45.0 43.6
All households 100 100 100
Ratio of share of top 20%
to bottom 20%
25 21 20
Gini coefficient 0.646 0.583 0.569
Proportion of poor households (%)2
33.5 16.6 17.4
1Households ranked by per capita gross income
2 Estimated using a poverty line of half the per capita 1999 minimum wage (R$ 68)
On the other hand, the incidence of income tax and employee’s social insurance contribution reduces the share of the top decile group to 43.6 percent. This is because direct taxes, particularly income tax, are highly concentrated on the richest 10 per cent of households (see Table A in the Apendix).
The size of the leveling of income distribution through the benefit and tax system can be measured by means of the Gini coefficient. The difference between the Gini coefficient of the distribution of initial incomes and the Gini of the distribution of gross incomes measures the extent of leveling by the cash transfer system, while the difference between the Gini for gross incomes and the Gini of the distribution of disposable incomes measures the amount of leveling by direct taxation.
As shown in Table 1, the Gini coefficient for initial income is 0.646, falling to 0.583 after the payment of cash transfers. This represents a reduction of approximately 10 per cent in inequality (as measured by the Gini). The direct tax system has a less significant effect on inequality, reducing it in only 2 per cent. These effects are illustrated by the Lorenz curves in Figure 1.
Figure 1 – Lorenz Curves
Looking at the proportion of poor households in the total number of households in Table 1, we can see that the system of cash transfers have prevented many households from falling into poverty. However, due its lack of relation to need, cash transfers leave many households – including households recipients of benefits - in poverty.
0,0 0,1 0,2 0,3 0,4 0,5 0,6 0,7 0,8 0,9 1,0
1 2 3 4 5 6 7 8 9 10
Table 2 offers a more detailed picture of the effects on household incomes of each federal tax and benefit included in this study. In interpreting the results presented in this table, one should keep in mind that the amounts do not take into account differences in household size. Specifically there are more people in households in the lower income deciles.
Table 2 – Average household incomes, taxes and benefits by decile groups (R$ per year)
Deciles of households ranked by per capita gross income
Bottom 2nd 3rd 4th 5th 6th 7th 8th 9th Top Initial Income 1,007 2,171 2,772 3,919 4,592 4,945 7,753 9,969 14,619 33,778 Cash Benefits 472 838 970 885 1,144 1,451 1,652 1,936 3,196 8,410
Pensions 109 355 580 617 817 1,294 1,462 1,776 3,020 8,283
Unemployment Benefit 64 71 76 114 101 66 107 89 111 57
PIS/PASEP e Salário-Família 17 83 100 114 101 77 78 67 60 69
Old Age Benefit 25 41 88 15 118 0 0 0 0 0
Bolsa Escola Programs 257 288 127 26 8 0 0 0 0 0
Gross Income 1,479 3,009 3,742 4,804 5,736 6,396 9,405 11,905 17,815 42,188
Direct Taxes 6 42 76 144 203 247 426 565 1,002 4,255
Personal Income Tax 0 0 0 0 0 0 2 8 145 2,946
Employee Social Contribution 6 42 76 144 203 247 424 556 887 1,309 Disposable Income 1,473 2,967 3,666 4,660 5,533 6,149 8,979 11,340 16,813 37,933
Indirect Taxes 331 511 614 668 792 831 1,176 1,452 1,870 3,164
COFINS 131 208 251 274 312 345 489 607 784 1,350
PIS/PASEP 30 45 56 62 75 77 113 143 178 295
IPI 71 105 120 130 149 147 188 226 267 422
Employer Social Contribution 90 141 172 187 229 243 357 440 588 1,012
Salário-Educação 9 12 15 14 17 19 28 36 53 84
After-Taxes Income 1,142 2,456 3,052 3,992 4,741 5,318 7,803 9,888 14,943 34,769
Non-Cash Benefits 888 831 753 643 598 519 545 532 600 733
Health 754 699 620 514 487 406 318 266 222 133 Education 134 132 133 129 111 113 228 267 378 600 Final Income 2,030 3,287 3,805 4,635 5,339 5,837 8,348 10,420 15,543 35,502
from 33.5 (with initial income) to 28.5 (with gross income). The ratio is further reduced to 25.7 after the payment of direct taxes.
According to Table 2, the average amount of indirect taxes paid by households in the lowest decile represents almost 70 per cent of the average total cash transfers received by them, and is higher than the average Bolsa-Escola benefit paid to households in this decile.
Non-cash benefits are particularly important for the bottom two deciles, amounting to at least 30 per cent of their final income. As shown in Figure 3, the proportion of income represented by non-cash benefits declines smoothly as income increases. For the most affluent 10 per cent of Brazilian households, non-cash benefits accounted for only 2 per cent of final income.
F ig ure 2
Cash B enefits as Percentag e o f G ro ss Inco m e
-5 1 0 1 5 2 0 2 5 3 0 3 5
1 2 3 4 5
Q uintiles
%
Figures 4 and 5 illustrate the overall effects on household incomes of the federal tax and benefits allocated in this study. They indicate that, although the federal benefits provides a significant supplement to the income of the lowest two income deciles - which have their initial income increased in average by more than 60 per cent - the highly skewed pattern of the distribution of initial income is to a greater extent reproduced in the distribution of final income.
Figure 3
Non-Cash Benefits as Percentage of Final Income
-5 10 15 20 25 30 35
1 2 3 4 5
Quintiles
%
Non-Cash Benefits as Percentage of Final Income
F ig u re 4
In itia l a n d F in a l In c o m e s b y Q u in tile G ro u p
-5 .0 0 0 1 0 .0 0 0 1 5 .0 0 0 2 0 .0 0 0 2 5 .0 0 0 3 0 .0 0 0
1 2 3 4 5
Q u in tile
R$ p
e
r year
4. Summary and Final Comments
The greatest part of social spending in Brazil bears little relation to need (or the level of household income). This is particularly true for social security pensions, that accounts for around 87 per cent of all cash transfers made to households by the Federal Government, but which incidence is highly concentrated on the most affluent households. Assistance programs like the Bolsa-Escola, on the order hand, are very well focused on the most vulnerable population. However, the budget devoted to these programs is a minuscule share of total social spending.
On the other hand, much of the budget of the social security system is financed by taxes which fall indiscriminately on all households, including those not covered by the system. This study has estimated that the amount of indirect taxes paid by households in the lowest income decile may be equivalent to around 70 per cent of the total cash transfers received by them from the government. It should be observed that most of the federal (as well as state) taxes not included in this analysis is of the indirect type.
This study indicates that access to state health and education services is what makes significantly positive the net effect of federal government expenditure on low income households. For households in the lowest income group, the combined amount of health
F ig u re 5
P e r c e n ta g e V a ria tio n in In itia l
In c o m e
-2 0 4 0 6 0 8 0
1 2 3 4 5
Q u i n t i l e s
%
and education benefits is nearly two times the total cash benefits they receive. It should be recognized, however, that recipients may value non-cash benefits quite differently from cash benefits.
In terms of inequality reduction and poverty alleviation, the performance of the tax and benefit system analyzed in this paper is deceptively modest given the substantial amount of resources involved. In addition, it can be said that the contribution of the tax system is negligible, with all redistributive role being concentrated on the expenditure side of the government budget.
It must be emphasized that the results presented in this paper provide only a rough guide to the effects of federal taxes and benefits on different household groups. Further developments in the scope and framework of the analysis should improve its accuracy and reliability. In particular, the follow steps should be taken in the future:
- Merging of the income and expenditure data and making the income and expenditure measures more closely compatible;
- Extension of the analysis to incorporate other elements of the government budget, including state and local taxes and expenditures;
- Linking of the microsimulation tax-benefit model to an input-output model.
This more fully articulated model would also introduce more flexibility in the simulations, allowing the sensitivity of the results to the model assumptions to be more easily tested. Further, it would enable us to simulate alternative policy reforms by changing tax and benefit rules and parameters.
References
Lakin, C. (2001) “The effects of taxes and benefits on household income, 1999-2000”,
Economic Trends, No. 569, April, Office for National Statistics, United Kingdom.
Levy, J. V. et al (2002) Orçamento Social da União - 2000, Secretaria de Política Econômica, Ministério da Fazenda, Brasília.
Siqueira, R. B. et al (2000) “On simulating Brazil’s tax benefit system using a multi-country microsimulation framework”, available electronically at the following address: http://www.decon.ufpe.br/pmes/areas/setorpublico/multi-country.pdf
Siqueira, R. B. and J. R. Nogueira (2001) “Análise distributiva de políticas públicas: o uso de modelos de microssimulação”, in M. Lisboa and N. Menezes-Filho (eds.)
APPENDIX
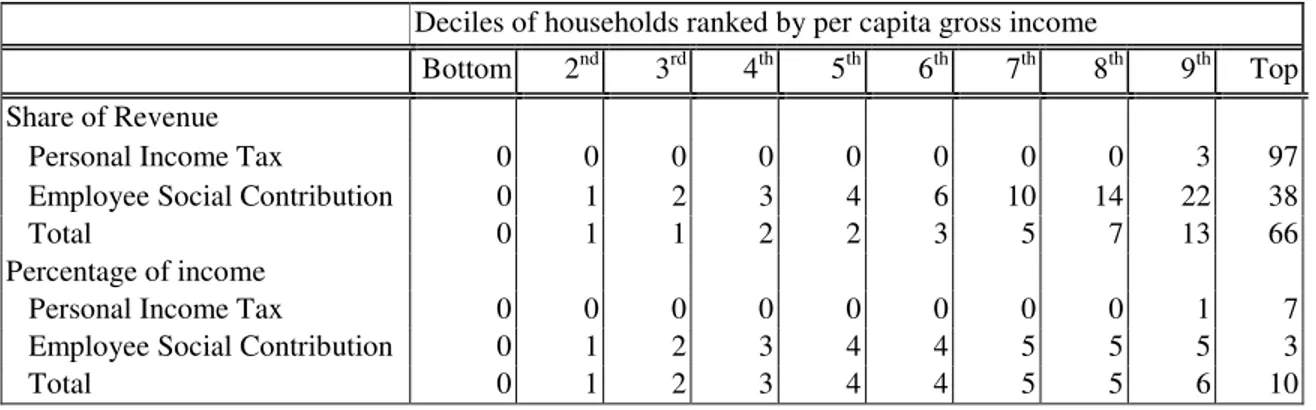
Table A – Incidence of direct taxes by gross income decile (%)
Deciles of households ranked by per capita gross income
Bottom 2nd 3rd 4th 5th 6th 7th 8th 9th Top Share of Revenue
Personal Income Tax 0 0 0 0 0 0 0 0 3 97
Employee Social Contribution 0 1 2 3 4 6 10 14 22 38
Total 0 1 1 2 2 3 5 7 13 66
Percentage of income
Personal Income Tax 0 0 0 0 0 0 0 0 1 7
Employee Social Contribution 0 1 2 3 4 4 5 5 5 3
Total 0 1 2 3 4 4 5 5 6 10
Table B – Incidence of indirect taxes* by gross income decile (%)
Deciles of households ranked by per capita gross income
Bottom 2nd 3rd 4th 5th 6th 7th 8th 9th Top
Share of Revenue 3 4 5 6 7 7 10 13 16 29
Percentage of Income 22 17 16 14 14 13 13 12 11 8
Percentage of Expenditure 15 15 15 15 15 15 15 15 15 15
* Including: IPI, COFINS, PIS/PASEP, Employer Social Contribution and Salário-Educação.
Table C – Percentage Shares of Non-Cash Benefits by Decile Groups
Deciles of households ranked by per capita gross income
Bottom 2nd 3rd 4th 5th 6th 7th 8th 9th Top
Health 17 16 14 12 11 9 7 6 5 3
Education 6 6 6 6 5 5 10 12 17 27
Elementary School1 18 19 13 12 10 9 7 6 4 2
Secondary School2 3 5 10 11 15 13 13 15 11 4
Higher Education3 0 0 1 0 0 1 11 15 26 46
Total Non-Cash Benefits 13 13 11 10 9 8 8 8 9 11
Box 1 – Cash Transfer Programs
Benefit Eligibility Amount and Duration of Benefits
Financing Source
Pensions
Entitlement based on contributions made to the social security system
Earnings-based formula that takes account of years of service or contributions.
Employer and employee social contributions
Unemployment Benefit
Loss of job, other than voluntary quit
Up to 5 months. The amount of the benefit takes account of last wage. The lower benefit threshold is the minimum wage.
Workers Support Fund (Fundo de Amparo ao Trabalhador – FAT)
Family Allowance (salário-família)
Paid for all children less than 14 years old or disabled of any age to employees and temporary workers who earn R$429,00 or less
Monthly payments of R$9.58 child
Employer and employee social contributions
Bonus PIS/PASEP
Paid to employees who earn up to 2 minimum wages from employers contributors to PIS or PASEP programs
Annual payment equal to 1 minimum wage
PIS and PASEP programs
Old Age Benefit
Paid to persons aged 67 years or more with no remunerated activity and to disabled individuals, who have monthly per capita family income less than ¼ the minimum wage and receives no other social benefit
Monthly payments equal to 1 minimum wage
Employer and employee social contributions
Bolsa Escola
Paid to families with children 7 to 14 years old enrolled in school and with monthly per capita family income less than ½ the minimum wage
R$15 per child up to R$45 per family
Poverty Fund from financial transactions contribution
Bolsa Alimentação
Paid for pregnant women and for children aged 6 months to 6 years and 11 months with monthly per capita family income up to R$ 90
R$15 per child up to R$45 per family
Poverty Fund from financial transactions contribution
Bolsa Criança Cidadã
Paid to families with children 7 to 14 years old enrolled in school and monthly per capita family income less than ½ the minimum wage
Rural areas, R$ 25 per child; urban areas, R$ 40 per child
Box 2 – Federal Taxes
Taxes Incidence Rates(%)
Direct Taxes
Personal Income Tax Taxable Income
Zero for monthly incomes up to R$900; 15% for monthly incomes from R$901 up to R$1,800; 27,5% for monthly incomes greater than R$1,800
Employee Social Contribution Salaries 20,0
Employer Social Contribution Payroll and profits 20,0
Indirect Taxes
Tax for Social Security Financing (COFINS)
Gross Revenue 3,0
Excise Tax (IPI) Sales and transfers of goods Manufactured in or imported into
Brazil
Varying rates according to the product’s tax code
PIS/PASEP Gross Revenue 0,65 (PIS)
1,0 (PASEP)
Chart 1 – Income Definitions
↓
↓
↓
↓
↓
↓
↓
↓
ORIGINAL INCOME
before government intervention (income from employment, investment etc)
Plus
CASH BENEFITS
(state retirement pensions, etc)
Equals
GROSS INCOME
Minus
DIRECT TAXES
and
EMPLOYEE SOCIAL CONTRIBUTION
Equals
DISPOSABLE INCOME
Minus
INDIRECT TAXES
(IPI, etc)
Equals
POST-TAX INCOME
Plus
NON-CASH BENEFITS
(education, health)
Equals