Analysis of AOMDV and OLSR Routing
Protocols Under Levy-Walk Mobility Model
and Gauss-Markov Mobility Model for Ad Hoc
Networks
Gowrishankar.S, SubirKumarSarkar Department of Electronics and Telecommunication Engineering, Jadavpur University, Kolkata 700032,
West Bengal, India. [email protected],
T.G.Basavaraju
Department of Computer Science and Engineering, Acharya Institute of Technology, Visvesvaraya
Technological University, Belgaum 590014, Karnataka, India.
Abstract—— In this paper we have compared AOMDV and OLSR routing protocol using Levy-Walk Mobility Model and Gauss-Markov Mobility Model. OLSR is a proactive, table-driven, link state routing protocol while AOMDV is a reactive routing protocol. Besides eyeing the details of comparing a proactive routing protocol with reactive routing protocol we try to address the circumstantial effect of these mobility models on the routing protocols. Mobility models should symbolize the precise movement of nodes. A thorough investigation of these routing protocols over mobility models which reflect real world scenarios are very important as it affects the overall performance of the network. Part of the results obtained in this paper is in conjugation with [20] thus providing a thorough reference for other research works. Various metrics like packet delivery ratio, average network delay, network throughput, routing overhead and average energy consumption have been considered by varying the mobility speed and the traffic load in the network. Under traffic load scenario the results obtained for AOMDV and OLSR routing protocols contradicted each other for Levy-Walk and Gauss-Markov Mobility Models. But the same could not be said for the two routing protocols when compared under varying mobile speed. We also claim that our paper is the first to compare these two routing protocols with Levy-Walk and Gauss-Markov as the underlying Mobility Models.
Keywords- AOMDV, OLSR, Routing Protocols, Mobility Models, Performance, Simulation.
I. INTRODUCTION
Ad hoc networks play a very important role in the adoption of ubiquitous computing en mass. Ad hoc network is a wireless network with no fixed infrastructure. Nodes in the Ad hoc networks are mobile in nature. If any two nodes are out of range then connectivity is established by hopping through various intermediate nodes. If any two nodes are with in the
transmission range of each other then the connectivity is established in a peer to peer manner.
Mobility Models play a very important role in simulating the routing protocols. These mobility models should reverberate with real life scenarios to obtain accurate results.
The topology of an ad hoc network is too sensitive which changes with the every movement of nodes. The change in topology is controlled by the underlying mobility models in a simulated result. It is entirely desirable for these mobility models to consider the real world traces so that as and when these routing protocols are deployed in real life systems they do provide the same effect as they provide when simulated.
The main contribution of this paper is that we have made a solid effort to study the performance of AOMDV and OLSR Routing Protocols over Levy-Walk Mobility Model and Gauss-Markov Mobility Model. To the best of our knowledge, no work has been reported that compares and studies the performance of all these two Routing Protocols with Levy-Walk and Gauss-Markov Mobility Model in a single research paper.
The rest of the paper is organized as follows. Previous related work is discussed in section two. In the Third section a brief description of the Routing protocols, Mobility models and the energy model is given. Various simulation parameters used in this paper is mentioned in section four. Analysis of the result is done in section five and finally we conclude the paper.
II. RELATED WORK
are deployed over an area of 12000 x 6000 m. In such a large scale network it is shown through simulation that the packet delivery ratio of AODV is less than DSR and LAR but AODV has also less delay. DSR is having high packet delivery rate and also high delay. This is attributed to the caching strategy used in DSR. It is shown that the packet delivery rate of AODV decreases with the increase in the number of connections. The authors also compare QualNet and NS2 simulators and come to the conclusion that there is no much difference between these two simulators and they are very much reliable when comparing the routing protocols.
Using Georgia Tech Network Simulator (GTNetS) a very large scale network ranging from 10,000 nodes to 50,000 nodes is evaluated with AODV is the routing protocol in [2]. For this kind of setup the packet delivery rate is around 32 %. This is too less when the same routing yielded more than 90% packet delivery for 50 nodes. Increasing the mobility speed does not seem have much effect on the packet delivery performance of AODV but higher packet delivery was observed with increase in pause time. Increase in mobility increases the end to end delay in the network but increase in pause time results in less delay. Simulation results also show that the AODV routing protocol with thousands of nodes and lower mobility with more pause time results in less overhead in the network.
Simulation results are divided in to two parts. In the first part results are obtained by varying the number of nodes and in the second part the results are obtained by moving the nodes in a directed trajectory so that these nodes move from a out of range zone to communication zone and again back to out of range zone [3]. Parameters considered are end to end delay, Throughput and Media Access Delay. For varying node density the routing protocols compared are AODV, DSR and TORA. AODV and DSR have high end to end delay during the initial stages of simulation but later on it decreases. AODV has the highest throughput. TORA values are linear. In the second scenario TORA routing protocol has high end to end delay and high media access delay while AODV has the highest throughput.
Distributed Bellman Ford (DBF), DSR and Associativity Based Routing (ABR) are compared in [4]. Various parameters like Control Overhead, Throughput, Average End to End delay and Average Hop by Hop delay are considered. DBF routing protocol has highest overhead while DSR has lower routing overhead. DBF has fewer throughputs due to high usage of channels for route update messages. The throughput of ABR is higher than DSR due to the selection of paths that are associatively stable and which have lighter load. The end to end delay of DBF is more or less same as that of ABR and DSR but has high hop by hop delay at increasing mobile speed.
A detailed analysis of DSDV routing protocols is done in [5]. The DSDV protocol is analyzed by varying the size of network, mobile density, pause time and mobility speed. The overhead of the DSDV routing
protocol increases with the increase in network size. By increasing the number of nodes the number of packets lost gets decreased thereby increasing the packet delivery. By increasing the node speed along with the number of connections results in the increase in the amount of packets delivered.
III. DESCRIPTION OF ROUTING PROTOCOLS AND MOBILITY MODELS
In this section we give a description of AOMDV and OLSR routing protocols. Levy-Walk Mobility Model and Gauss-Markov Mobility Models are also discussed along with the Energy Model.
A. Adhoc On Demand Multipath Distance Vector Routing Algorithm (AOMDV)
Adhoc On Demand Multipath Distance Vector Routing Algorithm (AOMDV) is proposed in [6]. AOMDV employs the “Multiple Loop-Free and Link-Disjoint path” technique. In AOMDV only disjoint nodes are considered in all the paths, thereby achieving path disjointness. For route discovery RouteRequest packets are propagated through out the network thereby establishing multiple paths at destination node and at the intermediate nodes. Multiples Loop-Free paths are achieved using the advertised hop count method at each node. This advertised hop count is required to be maintained at each node in the route table entry. The route entry table at each node also contains a list of next hop along with the corresponding hop counts. Every node maintains an advertised hop count for the destination. Advertised hop count can be defined as the “maximum hop count for all the paths”. Route advertisements of the destination are sent using this hop count. An alternate path to the destination is accepted by a node if the hop count is less than the advertised hop count for the destination. We have used the AOMDV implementation for NS-2 provided by [7].
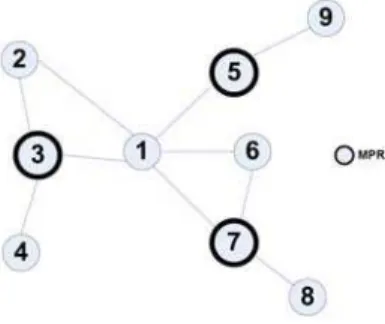
Figure 1. Transmission of Packets Using MPR
In fig 1 node 4 is two hops away from node 1. So node 3 is chosen as an MPR. Any node that is not present in the MPR list does not forward the packets. Every node in the network maintains information regarding the subset neighboring nodes that have been selected as MPR nodes. This subset information is called as MPR Selector List.
Optimization in OLSR is achieved in two ways. First the amount packets broadcasted in the network is reduced as only a selected few nodes called MPR broadcast the packets. Secondly the size of the control packets is reduced as the information regarding its multipoint relay selector set is provided instead of providing an entire list of neighboring nodes [8, 9, 10, 11, 12].
C. Levy Walk Mobility Model
The Levy Walk Mobility Model proposed in [13, 14] more or less imitates the human mobility traits in an out door condition. Real world human mobility traces are generated at various places that include two university campuses, a metropolitan area and a theme park by using GPS devices.
A flight is defined as the movement of an object along a straight line without any change in the direction. Various features like flight length distribution, pause time distribution, mean squared displacement and velocity are analyzed for the real world human mobility traces. To obtain a human walk flight from the traces is difficult as the human seldom walks in a straight line. Also there might not be continuity in a human walk as he may pause for few minutes or he may change the direction or may move in a vehicle and disappear for few minutes and appear in another location or there might be no battery in GPS devices. To reduce errors due to these factors three different methods are proposed for analysis. They are rectangular, angle and pause based methods.
The distance between any two points is considered as a flight in the rectangular model if there is no pause while moving between the two points and if the length between any two points is a perpendicular length to the point from that position. The angle model takes various flights found out from the rectangular model and combines them in to a single flight provided that there is no pause between any of the successive flights and the
relative angle is less than
between any two consecutive flights.
is a model defined parameter. The pause model also combines the flights obtained from the rectangular trajectory. It establishes more trajectories and accordingly represents the more natural human walk.The Levy Walk Model consists of four variables namely flight length (l), direction (), flight time (tf) and pause time (tp). The Levy distribution with and coefficients is represented as follows
w
w et itx
x
x
e
dt
f
2
1
For = 1 it is Cauchy Distribution and for = 2 it is Gaussian Distribution.
D. Gauss Markov Mobility Model
The Gauss Markov Mobility Model [15, 16] makes use of the probability density function. The Gauss Markov Mobility model determines the future location of a node based on its velocity and the previous location of the node. The location of a node is made known to the entire network at any given point of time. When a node moves, it checks the distance it has covered. If the node has covered a minimum acceptable distance or more, then the node updates the network about its current position. To reach a node, the network inspects the previous location of the node. Based on the velocity and the previous location it sends a message in shorter distance order to locate the current position.
The velocity of a node is given by
10 1 2
0
1
1
n
i
i i n n
n
n
v
x
V
Gauss Markov Mobility model can also be used to mimic other mobility models like fluid flow mobility model and Random Walk Mobility model.
E. Energy model
The Energy Consumption model considered in this paper is based on a study done in [17, 18]. The amount of energy spent in transmitting and receiving the packets is calculated by using the following equations:
Energytx = (330*PacketSize)/2*106
Energyrx = (230*PacketSize)/2*106 where packet size is specified in bits.
Average Energy Consumed is defined as
des
NumberofNo
odes
umedbyallN
EnergyCons
Percentage
IV. SIMULATION ENVIRONMENT
interface card are based on the 914MHz Lucent WaveLan direct sequence spread spectrum radio model. This model has a bit rate of 2 Mbps and a radio transmission range of 250m. The IEEE 802.11 distributed coordinated function with CSMA/CA is used as the underlying MAC protocol. Interface Queue (IFQ) value of 70 is used to queue the routing and data packets.
Following metrics have been selected for evaluating the mobility models:
Packet Delivery Ratio: It is defined as
Packets Data Sent of Number Packets Data Received of NumberAverage Network Delay: It is defined as
Pairs Connection of Number Total @source sent packet Time @dest arrive packet Time Throughput of the network: Throughput is defined as
Nodes of Number Total on Transmissi Data of s Throughput Node
Routing Overhead: It is defined as
sim fwdSize pkt sentsize pkt ΔT Control MAC Control MAC
TABLE I. SIMULATION PARAMETERS
Simulator NS2 Routing
Protocols
AOMDV and OLSR
Mobility Model Levy-Walk Mobility Model and Gauss Markov Mobility Model Simulation Time (sec) 900 Pause Time (sec) 10 Simulation Area (m)
1000 x 1000 Number of Nodes 50 Transmission Range 250 m Maximum Speed (m/s)
1, 1.5, 2, 2.5, 3 (Levy-Walk Mobility Model) and 5, 10, 15, 20, 25 (Gauss-Markov Mobility Model)
Traffic Rate (pkts/sec)
5, 10, 15, 20, 25 Data Payload
(Bytes)
512
V. RESULT ANALYSIS
All the simulations scenarios are averaged for 5 different seeds while running independently. We have considered the effect of mobility speed and traffic load on the performance of these routing protocols using Levy-Walk Mobility Model and Gauss Markov Mobility Model.
A. Effect of Mobility Speed
The mobility speed of Levy Model is varied from 1 to 3 m/s in steps of 0.5. This simulated speed corresponds to a human walking in normal mode to a running mode. The mobility speed of Gauss-Markov mobility models is varied from 5 to 25 m/s in steps of 5.
For the Levy-Walk mobility model the packet delivery rates of AOMDV and OLSR is almost the same (fig 2). The difference is insignificant. There is a slight increase and decrease pattern in the packet delivery. The OLSR routing protocol maintains the routing table information for all possible routes by periodically exchanging the HELLO and TC packets thereby ensuring high packet delivery.
The average network delay of AOMDV is higher than OLSR. The delay of AOMDV increases after 1.5 m/s from ~0.3 s to ~0.05 s. The average network delay is constant for OLSR and does not show much difference with the increase in speed. With the increase in speed the broken paths may not be noticed by OLSR immediately. This may result in delay in the network (fig 3).
In AOMDV the duplicate RREQ packets are not discarded altogether. Instead each of the packets is checked for information to establish reverse paths from destination node to the source node. Even though this may lead to construction of multiple paths it also leads to delay as each of the packets are analyzed while establishing multiple routes.
Again as in packet delivery the throughput of AOMDV and OLSR does not show much difference with the increase in speed (fig 4). The routing overhead of AOMDV shows a zigzag pattern while the routing overhead of OLSR is steady indicating that the mobility speed of Levy-Walk mobility model does not have much effect on the performance of OLSR (fig 5).
For Gauss-Markov Mobility model the packet delivery ratio of AOMDV decreases with speed while for OLSR the packet delivery increases with speed. But for both the routing protocols the delivery rate decreases after 20 m/s (fig 7). The OLSR routing protocol under Gauss-Markov mobility model does have the same delay as when applied under Levy-Walk mobility model. The delay remains at ~0.2s as the speed increases (fig 8). Even though multiple paths are established in AOMDV it may not be retained with the increase in speed. This further caused delay in the network. The throughput of AOMDV and OLSR increases with the increase in mobility speed. But the throughput decreases after 20 m/s (fig 9). One surprising aspect that we uncovered is the amount of throughput achieved by these two routing protocols under Levy-Walk and Gauss-Markov mobility models. In the Levy-Walk model the simulation was conducted with less mobile speed as compared to Gauss-Markov mobility model. But there is remarkable difference in the amount of throughput achieved by these two routing protocols. The peak throughput for AOMDV and OLSR is around ~700 bits/sec under Levy-Walk and it is around ~350 bits/sec and ~360 bits/sec for AOMDV and OLSR under Gauss-Markov mobility model.
The overhead of OLSR is higher than AOMDV for Gauss-Markov while AOMDV is having higher overhead than OLSR under Levy-Walk mobility model. Increase in mobility speed leads to increase in broken routes. This results in the generation of HELLO messages for route establishment from source node to destination node which dramatically increases the overhead in the network (fig 10). OLSR is having less overhead at less mobility speed. The energy consumption of AOMDV and OLSR show a straight line behavior consuming approximately the same amount of energy at varying mobile speed (fig 11).
Figure 2. PDR v/s Mobility Speed
Figure 3. Average Network Delay v/s Mobility Speed
Figure 4. Network Throughput v/s Mobility Speed
Figure 5. Routing Overhead v/s Mobility Speed
Figure 6. Energy Consumed v/s Mobility Speed
Figure 7. PDR v/s Mobility Speed
Figure 9. Network Throughput v/s Mobility Speed
Figure 10. Routing Overhead v/s Mobility Speed
Figure 11. Energy Consumed v/s Mobility Speed
B. Effect of Traffic Load
The traffic load is varied from 5 pkts/sec to 25 pkts/sec in steps of 5 pkts/sec. For Levy-Walk mobility model the mobility speed was kept at 1 m/s and for Gauss-Markov mobility model the speed was kept at 5 m/s.
The packet delivery ratio for AOMDV and OLSR is approximately the same. There is a steep fall in packet delivery with the increase in traffic load. This shows that an increase in the number of packets causes congestion in the network leading to the drop in the packets (fig 12). There is an astronomical increase in the delay after 10 pkts/sec for both AOMDV and OLSR routing protocols. The delay in AOMDV routing protocol is more than OLSR routing protocol. There is an increase in the delay from 10 pkts/sec to 15 pkts/sec. After 15 pkts/sec there is a stagnant in the delay. The peak delay for AOMDV is 1.2 s while for OLSR its 0.6 s (fig 13). In AOMDV the packets that are generated are not discarded if a route is not found. Instead they are buffered for a very long time as it waits for RREP
packets after a route is discovered. For OLSR as the traffic load increases the rate at which HELLO and TC messages are sent also increases. This may result in the congestion of the network.
With the increase in traffic there is an increase in throughput. This is quite expected due to the number of packets generated in the network. OLSR has the highest throughput than AOMDV for Levy-Walk mobility model. The highest throughput achieved by AOMDV is around ~1000 bits/sec while it is ~1300 bits/sec for OLSR routing protocol (fig 14). There is a decrease in the routing overhead of OLSR with the increase in the traffic load while the routing overhead of AOMDV is steady. AOMDV is having more routing overhead than OLSR (fig 15).
There is not much difference in the energy consumption of AOMDV and OLSR routing protocols with the increase in the traffic load (fig 16). In the Gauss-Markov mobility model the AOMDV routing protocol has the highest packet delivery. This is in contrast to fig 12 where OLSR has the highest packet delivery. The packet delivery of both AOMDV and OLSR decreases with the increase in traffic load (fig 17). The difference between in the network delay between AOMDV and OLSR is very much less (fig 18). The throughput of AOMDV is higher than OLSR routing protocol (fig 19). The routing overhead of both AOMDV and OLSR decreases after the traffic load is increased to 10 pkts/sec (fig 20). In AOMDV the intermediate nodes of various paths generate RouteReply packets. At higher traffic the source node increases the number of packets for route discovery leading to increase of overhead in the network.
Again there is an increase in the energy consumed with the increase in traffic load (fig 21). While observing the simulation results from fig 17 to 21 it can be deduced that there is no much difference between AOMDV and OLSR regarding any of the parameters. This shows that the varying traffic load does not have significant impact on the performance of AOMDV and OLSR when deployed over Gauss-Markov mobility model.
Figure 13. Average Network Delay v/s Traffic Load
Figure 14. Network Throughput v/s Traffic Load
Figure 15. Routing Overhead v/s Traffic Load
Figure 16. Energy Consumed v/s Traffic Load
Figure 17. PDR v/s Traffic Load
Figure 18. Avereage Network Delay v/s Traffic Load
Figure 19. Network Throughput v/s Traffic Load
Figure 20. Routing Overhead v/s Traffic Load
Figure 21. Energy Consumed v/s Traffic Load
VI. CONCLUSION
routing protocol has higher performance compared to AOMDV routing protocol under Levy-Walk Mobility Model. There is no way to tell that a particular routing protocol is well versed in all types of scenarios. The selection of proactive and reactive routing protocols gives us a loosely based overall view of how other reactive and proactive protocols do perform when deployed over these mobility models.
ACKNOWLEDGEMENT
The first author of this paper would like to acknowledge the help of Injong Rhee, North Carolina State University, USA in this work.
REFERENCES
[1] Ioannis Broustis et al.,”A Comprehensive Comparison of Routing Protocols for Large Scale Wireless MANETs”, 3rd International Workshop on Wireless Ad hoc and Wireless Sensor Networks (in conjuction with SECON 2006), New York, June 28-30, 2006.
[2] Xin Zhang and George R Riley,”Performance of Routing Protocols in Very Large Scale Moble Wireless Ad hoc Networks”, 13th IEEE International Symposium on Modelling, Analysis and Simulation of Computer and Telecommunication Systems, Atlanta, Georgia, September 27-29, 2005.
[3] S R Chaudhry, A A Khwildi et al.,”A Performance Comparison of Multi On Demand Routing in Wireless Ad hoc Networks”, In Proceedings of the IEEE International Conference on Wireless and Mobile Computing, Neworking and Communications (WiMob2005), Montreal, 22-24 August, 2005.
[4] Sung-Ju Lee, C K Toh and Mario Gerla,”Performance Evaluation of Table Driven and On Demand ad hoc Routing Protocols”,Proceedings of the IEEE International Conference on Personal, Indoor and Mobile Radio Communications (PIMRC1999(, OSAKA, Japan, Sep 12-15, 1999.
[5] Vahid Garousi,”Analysis of Network Traffic in Ad Hoc Networks Based on DSDV Protocol with Emphasis on Mobility and Communication Patterns”, In Proceedings of the IEEE International Conference in Central Asia on Internet (ICI 2005), Bishkek, Kygystan, September 2005.
[6] Mahesh K. Marina and Samir R.Das, “ On-Demand Multipath Distance Vector Routing in Ad-hoc Networks”, In proceedings of the IEEE International Conference on Network Protocols, 2001 pp 14-23.
[7] M.Caleffi, G.Ferraiuolo and L.Pauro, “On Reliability of Dynamic Addressing Protocols in Mobile Ad hoc Networks”, Proceedings of WRECOM’07, Wireless Rural and Emergency Communications Conference, Roma, Italy, October 2007. [8] T.Clausen and P.Jacquet,”Optimized Link State Routing
Protocol for Ad hoc Networks”, http://hipercom.inria.fr/olsr/rfc3626.txt
[9] Mounir Frikha and Manel Maamer,” Implementation and Simulation of OLSR protocol with QOS in ad hoc Networks”, Proceedings of the Second International Symposium on Communications, Control and Signal Processing (ISCCSP’06), 13-15 March, Marrakech, Morocco.
[10] John Novatnack and Harpreet Arora,”Evaluating ad hoc Routing Protocols with Restpect to Quality of Service”, IEEE International Conference on Wireless and Mobile Computing, Networking and Communications (WiMob’05), 03 October 2005.
[11] Kenneth Holter,”Comparing AODV and OLSR”, folk.uio.no/kenneho/studies/essay/essay.html
[12] Ying Ge et al,”Quality of Service Routing in ad Hoc Networks Using OLSR”, Proceedings of the 36th IEEE International conference on System Sciences (HICSS’03), 2002.
[13] Injong Rhee, Minsu Shin et al.,”On the Levy-Walk Nature of Human Mobility”, INFOCOM, Arizona, USA, 2008.
[14] Seongik Hong, Injong Rhee et al.,”Routing Performance Analysis fo Human Driven Delay Tolerant Networks Using the Truncated Levy Walk Model”, ACM SIGMOBILE International Workshop on Mobility Models for Networking Research (Colocated with MobiHoc 08), Hong Kong, 2008. [15] Ben Liang and Zygmunt J Haas,”Predictive Distance Based
Mobility Management for PCS Networks”, In Proceedings of IEEE INFOCOM-99, NewYork, NY, March 21-25, 1999. [16] The BonnMotion Software
http://net.cs.uni-bonn.de/wg/cs/applications/bonnmotion/
[17] Juan Carlos Cano and Pietro Manzoni,”A Performance Comparison of Energy Consumption for Mobile Ad Hoc Network Routing Protocols”, In Proceedings of the 8th International Symposium on Modelling, Analysis and Simulation of Computer and Telecommunication Systems, San Francisco, CA, 2000.
[18] Laura Marie Feeney,”Investigating the Energy Consumption of a Wireless Network Interface in an Adhoc Networking Environment”, In Proceedings of the INFOCOM01 Twentieth Annual Joint Conference of the IEEE Computer and Communication Societies, Vol 3, August 2002, pp 1548-1557. [19] Information Sciences Institute, “The Network Simulator Ns-2”,
Http://www.isi.edu/nanam/ns/, University of Southern California.