Radar stratigraphy of the glaciotectonically deformed deposits
in the Isoniemi area, Haukipudas, Finland
Antti Pasanen
Department of Geosciences, P.O. Box 3000, FI-90014 University of Oulu, Finland
Abstract
The study of deposits in the central areas of Weichselian Scandinavian Ice Sheet (SIS) is im-portant for understanding behaviour of the ice sheet. This study provides new information on the deposits in the previously poorly known glaciofluvial Isoniemi complex in Haukipu-das, Finland, located in the central part of SIS. The deposits are studied using ground pen-etrating radar (GPR) to delineate the depositional and glaciotectonic environments and events that have occurred in the area. The results are interpreted using the principles of ra-dar stratigraphy and correlated with an earlier sedimentological study from the area. Bore-hole logs of old boreBore-holes made for ground water and aggregate investigations are used as an aid in the interpretation alongside the previously obtained sedimentological data. GPR data show 10 radar facies separated by seven radar surfaces. The sequence of events inter-preted from GPR data and earlier sedimentological study include: 1) deposition of the gla-ciofluvial sediments, 2) deposition of till and the first stage of deformation by an advancing glacier, 3) retreat of the glacier, and cutting and infilling of the proglacial channels, 4) progla-cial deformation forming the Runteli ridge, 5) glacioisostatic uplift close to the water level, 6) possible forming of the rip current channels and 7) reworking of the earlier sediments by wave and sea-ice action.
Key words: glaciofluvial features, sediments, till, stratigraphy, ground-penetrating radar, glaciotectonics, deformation, Quaternary, Isoniemi, Haukipudas, Finland
* Corresponding author email: antti.pasanen@oulu.fi
1. Introduction
The Oulu region (Fig. 1) was covered by the Weich-selian Scandinavian Ice Sheet (SIS) when it advanced across Finland to the Northwest Russia several times during the Late Pleistocene. The region, located in the middle part of the SIS, is considered impor-tant in understanding the behaviour of the SIS dur-ing the Weichselian Stage. The till stratigraphical in-vestigations suggest that three till beds were depos-ited by three separate ice advances in Finnish
Fin-Fig. 1. Map of Oulu region showing the major glaciofluvial deposits (dotted areas). The shaded box in Isoniemi shows the area covered in Figure 2. Pudasjärvi End Moraine Zone and Pudasjärvi-Hossa line (lower dashed line in small map) are indicated.
land only during the early Middle Weichselian and the Late Weichselian (Lunkka et al., 2004; Salonen et al., 2007). It has been hypothesised that the series of till-covered glaciofluvial ridges in the Pudasjärvi end-moraine zone (Fig. 1), represent the Early Weichse-lian ice limit deposited by a glacier flowing from the northwest (Sutinen, 1992; Nenonen, 1995). It has also been suggested that a number of till-covered gla-ciofluvial complexes in the Oulu region were deposit-ed prior to the Late Weichselian Sub-stage (Bargel et al., 1999; Johansson & Kujansuu, 2005).
The Isoniemi area (N65°09' E25°15') discussed here consists of a glaciofluvial sediment sequence overlain by till. The lower part of the sequence has been intensively deformed by the overriding ice. During the deformation, the area was covered by water. The highest shoreline north of Oulu in the Rovaniemi area is currently 220 m asl, and it was formed in the Baltic Sea’s Anculys Stage (Tikkanen
the glaciofluvial sediments beneath the till unit are not known.
Despite the intensive exploitation of sand and gravel, which have left behind numerous sediment exposures, only two scientific studies have been per-formed in the Isoniemi area (Vehkaperä, 1988; Pas-anen & Lunkka, 2008). Vehkaperä (1988) stud-ied the Quaternary sediments and the underlying bedrock in the Haukipudas-Kiiminki area, includ-ing the Isoniemi area, in his unpublished licenti-ate study. Veh kaperä (1988) interpreted the Runte-li ridge (Fig. 2), which runs north-south along the western side of Isoniemi, as an ice marginal deposit. Vehkaperä (1988) also noted that on the distal side of the Isoniemi area, at least three kilometres from the Runteli ridge, lenses and layers of till at several different depths below the ground surface occur sep-arated by thick units of glaciofluvial sediment. This is thought to have been caused by intensive defor-mation of the sediments. Pasanen & Lunkka (2008) studied sections in currently exploited sand and gravel pits in the Isoniemi area using sedimentolog-ical techniques including clast fabric and structur-al measurements. They described four distinct sedi-mentary facies (from the bottom to the top): 1) de-formed sand and gravel facies, which was
interpret-ed to represent glaciotectonically deforminterpret-ed fan-del-ta sediments; 2) diamicton facies, interpreted to rep-resent deformation till consisting of reworked gla-ciofluvial sediment and glacially transported sedi-ment; 3) cobble gravel facies, which laterally grades into diamicton and is interpreted to represent litto-ral reworking of the deformation till and 4) sand and pebble gravel facies interpreted to represent littoral reworking of the earlier sediments. The structural measurements showed two distinct shear stress di-rections, one from the northwest and the other from the west or the southwest, but a clear time relation-ship between the events could not be determined in the Isoniemi area. Other work from the Oulu re-gion has noted the littoral deposits and till-covered glaciofluvial areas of Hangaskangas and Muhos with a sequence similar to the one in Isoniemi (Helle & Ylinen, 1965; Gibbard, 1979; Eronen et al., 1995; Bargel et al., 1999; Pasanen & Lunkka, 2008).
In this paper, the Isoniemi area was studied us-ing ground penetratus-ing radar (GPR) which is the most prominent high resolution geophysical profil-ing method for coarse grained sediments. The aim of the paper is to establish the radar stratigraphy, cor-relate it with the lithostratigraphy presented in Pa-sanen & Lunkka (2008), show the lateral variability
of the sedimentary facies interpreted from the radar stratigraphy and shed light on the sedimentary envi-ronments in the Isoniemi area.
2. Study area
The Isoniemi area (N65°09' E25°15', Fig. 2) is the northern part of the 25 km2 glaciofluvial
Isoniemi-Virpiniemi complex. It is located on the coast of the Gulf of Bothnia 6 km northwest of the village of Kel-lo in the Haukipudas Commune. The highest geo-morphological feature in the area is the Runteli ridge which reaches over 25 metres above sea level (m asl). The modern ground surface surrounding the Runte-li ridge is at 20–25 m asl, descending to 10 m asl to-wards the east. Vast sand and gravel pits dominate the area. Outside the pits, the area is mainly forested.
3. Methods
The area was studied using 2D GPR sections (loca-tion of the sec(loca-tions in Fig. 2). GPR is a powerful, non-intrusive electromagnetic profiling technique for revealing sedimentary structures in a shallow subsur-face. Using this method, pulses of electromagnetic ergy are transmitted into the subsurface where the en-ergy is reflected back from the electrical boundaries, and the amplitude and the two-way travel time in nanoseconds are recorded. The electrical boundaries are created at the interfaces of the geological materi-als with different dielectrical properties. The veloci-ty of the electromagnetic wave is dependant on the relative dielectric value (εr), and the abrupt chang-es in εr cause the radar reflections. In sediments, the abrupt changes in εr are mainly caused by changes in water content and lithology (van Dam & Schlag-er, 2000). The physical basis for the GPR method is given by Annan & Davis (1976) and Daniels et al. (1988) among others.
The propagation and reflection of the electromag-netic wave is analogous to an acoustic wave, therefore, an approach similar to seismic stratigraphy (Roksan-dic, 1978; Sangree & Widmier, 1979) can be used for GPR interpretation. Radar stratigraphy is based
on the recognition and interpretation of radar surfac-es (bounding surfacsurfac-es), radar facisurfac-es (bed assemblagsurfac-es) and radar packages (geometry of the deposits) (Neal et al., 2002). The principles of radar stratigraphy are given by Gawthorpe et al. (1993) and later reviewed by Neal (2004).
The GPR method has been widely used in sedi-mentological studies (cf. Neal, 2004) and has been successfully applied to glaciofluvial sediments, e.g. by Beres et al. (1995, 1999) and Mäkinen & Räsänen (2003), and to deltaic and glaciodeltaic sediments, e.g. by Jol & Smith (1991), Smith & Jol (1992, 1997), Roberts et al. (2003) and Pelpola & Hick-in (2004). In recently glaciated terraHick-in, the radar re-flections of glaciotectonic structures can provide in-valuable information concerning ice-sheet dynam-ics. Glaciotectonic structures have been studied using GPR by Lønne & Lauritsen (1996), Busby & Mer-ritt (1999), Overgaard & Jakobsen (2001), Jakobsen & Overgaard (2002), Bakker & Van der Meer (2003) and Bakker (2004) among others.
GPR investigation comprises 10 GPR sections with a total length of 12 290 metres. The GPR equip-ment used in this study comprised of the Malå Geo-science 100 MHz shielded antenna and the Malå Ge-oscience X3M controller unit. Raw data were post-processed using GeoDoctor v.2.054 software, and the processing and survey parameters are given in Table 1. The average relative dielectricity value (εr), used for the depth conversion, was estimated by fitting the diffraction hyperbolae and using borehole logs, made for ground water and aggregate investigations. In GPR sections where diffraction hyperbolae and borehole logs could not be applied, εr was estimated from the literature (Davis & Annan, 1989; Hännin-en, 1991; Neal, 2004). The topography of the radar transects was obtained from map altitude contours and enhanced with the calibrated altimeter.
4. Results
ad-Table 1. Collection and post-processing parameters of the GPR survey. The average step size is calculated from the survey time and transect distance.
Transect Isoniemi 2 Isoniemi 8 Isoniemi 7
data collection parameters
Figure Fig. 3 Fig. 4 Fig. 5
Location Isoniemenkangas,
Haukipu-das, Finland
Kellonkangas, Haukipudas, Finland
Kellonkangas, Haukipudas, Finland
GPR Unit Malå Geoscience,
Ram-ac X3M
Malå Geoscience, Ram-ac X3M
Malå Geoscience, Ram-ac X3M
Data logging Panasonic Toughbook
CF-29 with Malå Geo-science GroundVision
soft-ware.
Panasonic Toughbook CF-29 with Malå Geo-science GroundVision
soft-ware.
Panasonic Toughbook CF-29 with Malå Geo-science GroundVision
soft-ware.
Survey type Common offset Common offset Common offset
Antenna centre frequency (MHz)
100 100 100
Antenna Separation (m) 1 1 1
Mode of data collection Continuous, time trigger,
radar was towed by a car.
Continuous, time trigger, radar was towed by a car.
Continuous, time trigger, radar was towed by a car.
Stacking 2 2 2
Time window 531 ns 629 ns 566 ns
Average step size 16.5 cm 23.2 cm 19.6 cm
post-processing steps
1 Data editing x x x
2 Relative dielectricity value
for depth conversion
4 (0.15 m/ns). Taken from literature and borehole logs
in other profiles
14 (0.08 m/ns). Taken from hyperbola fitting.
14 (0.08 m/ns). Taken from hyperbola fitting.
3 Topography correction Contours, altimetre,
markers
Contours, altimetre, markers
Contours, altimetre, markers
4 Set time-zero x x x
5 Amplitude zero-level
cor-rection
x x x
6 Background removal (scans) 400 400 400
7 Vertical low-pass boxcar
fil-ter (MHz)
454.5 381.5 381.5
8 Vertical high-pass boxcar
fil-ter (MHz)
39.5 40.2 40.2
9 Automatic gain control
– calculation windows 12 12 12
– mean amplitude 3000 3000 3000
– window overlap % 50 50 50
dition, separate radar reflections interpreted to rep-resent structures of post-depositional deformation are showed as secondary elements (SE1). The radar surfaces and radar facies are numbered consecutively
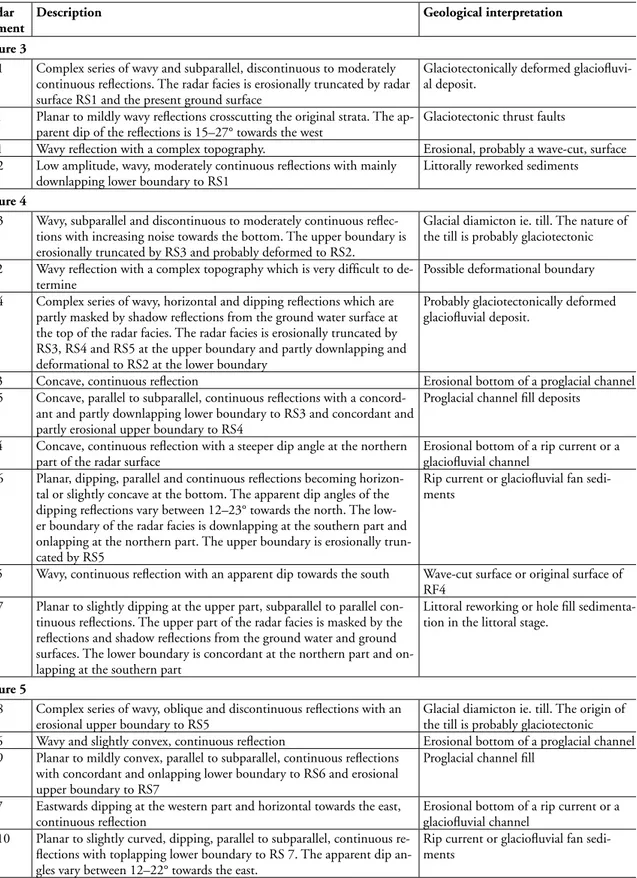
Table 2. Results of the radar stratigraphy interpretation and geological interpretation for each radar facies and ra-dar surface. RF refers to rara-dar facies, RS to rara-dar surface and SE to seconra-dary element in rara-dar element column. The interpretations are discussed in the text.
Radar element
Description Geological interpretation
Figure 3
RF1 Complex series of wavy and subparallel, discontinuous to moderately
continuous reflections. The radar facies is erosionally truncated by radar surface RS1 and the present ground surface
Glaciotectonically deformed glaciofluvi-al deposit.
SE1 Planar to mildly wavy reflections crosscutting the original strata. The
ap-parent dip of the reflections is 15–27° towards the west
Glaciotectonic thrust faults
RS1 Wavy reflection with a complex topography. Erosional, probably a wave-cut, surface
RF2 Low amplitude, wavy, moderately continuous reflections with mainly
downlapping lower boundary to RS1
Littorally reworked sediments
Figure 4
RF3 Wavy, subparallel and discontinuous to moderately continuous
reflec-tions with increasing noise towards the bottom. The upper boundary is erosionally truncated by RS3 and probably deformed to RS2.
Glacial diamicton ie. till. The nature of the till is probably glaciotectonic
RS2 Wavy reflection with a complex topography which is very difficult to
de-termine
Possible deformational boundary
RF4 Complex series of wavy, horizontal and dipping reflections which are
partly masked by shadow reflections from the ground water surface at the top of the radar facies. The radar facies is erosionally truncated by RS3, RS4 and RS5 at the upper boundary and partly downlapping and deformational to RS2 at the lower boundary
Probably glaciotectonically deformed glaciofluvial deposit.
RS3 Concave, continuous reflection Erosional bottom of a proglacial channel
RF5 Concave, parallel to subparallel, continuous reflections with a
concord-ant and partly downlapping lower boundary to RS3 and concordconcord-ant and partly erosional upper boundary to RS4
Proglacial channel fill deposits
RS4 Concave, continuous reflection with a steeper dip angle at the northern
part of the radar surface
Erosional bottom of a rip current or a glaciofluvial channel
RF6 Planar, dipping, parallel and continuous reflections becoming
horizon-tal or slightly concave at the bottom. The apparent dip angles of the dipping reflections vary between 12–23° towards the north. The low-er boundary of the radar facies is downlapping at the southlow-ern part and onlapping at the northern part. The upper boundary is erosionally trun-cated by RS5
Rip current or glaciofluvial fan sedi-ments
RS5 Wavy, continuous reflection with an apparent dip towards the south Wave-cut surface or original surface of
RF4
RF7 Planar to slightly dipping at the upper part, subparallel to parallel
con-tinuous reflections. The upper part of the radar facies is masked by the reflections and shadow reflections from the ground water and ground surfaces. The lower boundary is concordant at the northern part and on-lapping at the southern part
Littoral reworking or hole fill sedimenta-tion in the littoral stage.
Figure 5
RF8 Complex series of wavy, oblique and discontinuous reflections with an
erosional upper boundary to RS5
Glacial diamicton ie. till. The origin of the till is probably glaciotectonic
RS6 Wavy and slightly convex, continuous reflection Erosional bottom of a proglacial channel
RF9 Planar to mildly convex, parallel to subparallel, continuous reflections
with concordant and onlapping lower boundary to RS6 and erosional upper boundary to RS7
Proglacial channel fill
RS7 Eastwards dipping at the western part and horizontal towards the east,
continuous reflection
Erosional bottom of a rip current or a glaciofluvial channel
RF10 Planar to slightly curved, dipping, parallel to subparallel, continuous
re-flections with toplapping lower boundary to RS 7. The apparent dip an-gles vary between 12–22° towards the east.
5. Interpretation
5.1 Glaciotectonic and glacial deposits
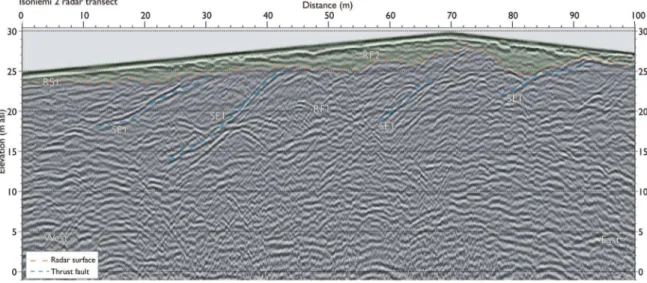
Radar facies RF1 in the Isoniemi 2 section (Fig. 3) show a complex radar reflection pattern with dipping radar reflections (secondary element SE1) cross-cut-ting the original strata. Radar facies RF4 in the Iso-niemi 8 section (Fig. 4) also shows a similar reflec-tion pattern, but no indicareflec-tion of SE1 was observed. RF1 is interpreted to represent glaciotectonically de-formed glaciofluvial deposit, and the secondary ele-ment SE1 is interpreted to represent glaciotectonic thrust faults. The radar reflection patterns are similar to the ones showed by Jakobsen & Overgaard (2002) and Bakker (2004) and the interpretations were con-firmed with section logging in the Isoniemenkangas area (Fig. 2; Pasanen & Lunkka, 2008). RF4 is inter-preted to represent the same sedimentological facies even though its stratigraphical position above till was not seen in the sections in the Isoniemenkangas area. The interpretation is based on the reflection config-uration and complex lower boundary (RS2) which is interpreted as glaciotectonically deformed. The
bore-hole log in Figure 4 penetrating through RF4 is 20m offset from the transect, but it gives an indication of the sediment type of RF4 (medium grained sand) and also RF3 (till).
RF3 in Figure 4 and RF8 in Figure 5 are interpret-ed to represent the same sinterpret-edimentological facies. Ra-dar transects Isoniemi 8 in Figure 4 and Isoniemi 7 in Figure 5 cross each other in almost right angles. When using 2D radar sections, the reflection patterns change with the transect direction and therefore, RF4 and RF8 are showing slightly different reflection pat-terns. RF4 and RF8 are interpreted to represent gla-cial diamicton, i.e., till. The interpretation was con-firmed with several slightly offset borehole logs in the Kellonkangas area. The genesis of the till cannot be confirmed, but the section logs on the proximal side (Pasanen & Lunkka, 2008) and the complex ra-dar surface RS2 suggests a glaciotectonic nature. Also high amplitude, convex reflections at elevation -1 m asl at the distance 275–300 m and at elevation 1 m asl at the distance 340–370 m (Fig. 4) suggests that there are lenses of probably stratified sediments, pos-sibly sand, within the till.
5.2 Glaciofluvial deposits
Radar surfaces RS3 (Fig. 4) and RS6 (Fig. 5) are in-terpreted to show the same radar surface. The con-cave reflection, cutting RF3 and RF4, in Figure 4 and wavy reflection, cutting RF8, in Figure 5 is in-terpreted to represent an erosional bottom of a chan-nel. Concave reflections of RF5 (Fig. 4) and planar to mildly convex reflections of RF9 (Fig. 5) are also interpreted to represent the same sandy channel fill sediments. The grain size of the sediments was con-firmed with borehole data. Radar transect Isoniemi 8
(Fig. 4) is showing a transverse section of the channel, whereas radar transect Isoniemi 7 (Fig. 5) is showing the longitudinal section. The concave reflections of RF5 suggest a fast deposition with waning stream ve-locities suggesting that the channel was getting nar-rower by the deposited sediments. In the longitudinal section (Fig. 5), the reflections are mainly concord-ant to RS6, but at the eastern side of the topographic high of RS6 between 50–95 m, the lower boundary is onlapping. The onlapping is thought to be caused by the obstacle lee side sedimentation of the fast flow-ing water. The vast dimensions of the channel (width
>300 m) and the concave infilling and large scale lee side sedimentation suggests cutting and infilling in proglacial position with high, quickly waning stream velocity. The depth of the water in front of the ice margin (assumed to be more than 200 m) is thought to be the reason for the quick waning in stream ve-locity. The low velocity infilling of the channel can be ruled out because of the concordant reflection end-ing at the lower boundary and concave reflections of RF5. The upper part of RF9 between 0–55 m shows westward dipping reflections, partly masked by re-flections and shadow rere-flections from the ground sur-face and ground water level. The radar sursur-face below these reflections could not be determined. Therefore, it cannot be stated whether these reflections belong to glaciofluvial deposits or if they represent, e.g., littoral or aeolian deposits.
5.3 Littoral deposits
The radar surface RS4 (Fig. 4) shows a concave re-flection which is cutting RF3, RF4 and RF5, where-as RS7 (Fig. 5) is cutting RF9 and they are interpret-ed to represent the same radar surface. The
geolog-ical interpretation for the combined radar surface is an erosional bottom of a channel. RF6 (Fig. 4) shows a reflection pattern with an apparent dip towards the north. RF10 (Fig. 5) also shows a dipping reflection configuration, but the apparent dip direction is to-wards the east. RF6 and RF10 are interpreted to rep-resent the same sedimentological facies, where the ‘true’ dip direction of the clinoforms is estimated to be approximately towards the northeast. The radar sections Isoniemi 8 (Fig. 4) and Isoniemi 7 (Fig. 5) are probably cutting the channel diagonally. RF6 ac-companied by RS4 (Fig. 4) may represent the reacti-vation of the glaciofluvial stream and proglacial fan-delta sedimentation in a channel where dipping re-flections represent foresets. The concordant reflection ending at the lower boundary at the south and onlap-ping reflection ending at the north may also suggest a bend in a channel, and the northward dipping reflec-tions can be interpreted as bedding planes of a later-al bar. RF10 (Fig. 5), however, shows that the radar facies is not laterally continuous towards the west and it ends at the distance of 60 m in Figure 5. The dip-ping reflection pattern in RF6 and RF10 most prob-ably suggests unidirectional water flow towards the
northeast. Therefore, it is thought that radar facies RF5 and RF10 and radar surfaces RS4 and RS7 prob-ably represent erosion and subsequent deltaic deposi-tion possibly by rip currents (e.g.MacMahan et al., 2006). The depth of the observed modern rip chan-nels are usually low (< 2 m, MacMahan et al., 2006), whereas the depth of the channel in Figure 5 is at least 5 m. Therefore, glaciofluvial erosion and depo-sition and subsequent erosion of the top of the facies, causing the end of the channel, can not be ruled out. However, no evidence of erosion at the top of the RF 6 and RF10 can be seen.
Radar surface RS1 (Fig. 3) erosionally truncates re-flections at the upper boundary of RF1. RF2 shows planar reflections which are onlapping at the lower boundary. They are interpreted to represent littoral reworking of the earlier sediments above the wave-cut surface (RS1). The interpretation is confirmed with section logging (Pasanen & Lunkka, 2008). RF7 (Fig. 4) also shows a slightly similar reflection pattern. The borehole data, however, show that the sediment consists of fine-grained sand. This suggests that the sediment was removed from a higher elevation when the area was emerging from the Baltic Sea because of the glacioisostatic uplift, and the mass movements in-filled the hollows at the lower elevation. Therefore, RS5 probably represents the original surface of RF4 rather than a wave-cut surface.
In the upper part of each radar transect (Figs. 3–5), a dipping reflection configuration can be seen. The reflections are partly masked by reflections and shad-ow reflections from the ground surface and ground water level, and no radar surfaces below them could be identified. It is thought that they may represent lit-toral or aeolian redeposition.
5.4 Lateral distribution of the radar facies and
surfaces
The radar facies and radar surfaces are not distrib-uted evenly in the study area. The glaciotectonic ra-dar facies (RF1 and RF4) can be seen throughout the study area. The deformed glaciofluvial sediment is the thickest at the proximal side in the
Isoniemenkan-gas area (Fig. 2) and it becomes thinner towards the distal side.
The till radar facies (RF3 and RF8) could not be identified in the Isoniemenkangas area. However, de-formation till was seen in section logs (Pasanen & Lunkka, 2008) on the proximal side of the area. The GPR survey shows that the till bed is continuous at the distal side of the area, whereas at the proximal side only patches of till can be seen in the sections. The top 5–10 m of the sediment were removed in the central part of the study area between Isoniemenkan-gas and AnnankanIsoniemenkan-gas (Fig. 2) and no transition from patchy till to continuous till bed could be identified.
The proglacial channels and channel fills (RS3, RS6, RF5 and RF9) were identified on the distal side of the area in Kellonkangas (Fig. 2). Another chan-nel was identified 1.1 km to the south of the chanchan-nel in Kellonkangas (Figs. 4 and 5) in the Soidinkangas area. Also another separate possible rip current chan-nel and chanchan-nel fill was identified 650 m south of the channel in Kellonkangas area in the Annanmäki area. The littoral radar facies (RF2 and RF4) was identified throughout the area.
6. Discussion
also suggested that the deformation was caused by one glacier advance–retreat cycle, where the first de-formation event occurred during the advance and lat-ter one occurred during the retreat of the glacier. This suggests that the till bed was laid down by the advanc-ing glacier causadvanc-ing also the deformation of the sedi-ments below.
The glaciotectonic radar facies (RF1 and RF4) can be correlated with the deformed sand and grav-el facies of Pasanen & Lunkka (2008). The radar re-flection pattern and section logs at the Runteli Ridge show a brittle to plastic glaciotectonic deformation. The ‘true’ dip angles of the secondary elements SE1, interpreted to represent glaciotectonic thrust faults, can not be determined and correlated with the shear stress directions presented in Pasanen & Lunkka (2008). However, the deformation structures show-ing a northwest orientation becomes more abun-dant towards the proximal side of the area and it is thought to be the latest shear stress direction (Pas-anen & Lunkka, 2008). The thrust faults were most probably formed in this stage of the glaciotectonic de-formation during the initial deglaciation ca. 10 000 years ago. Also this latter stage of the deformation is thought to have caused the till bed to break into the small patches at the proximal side of the area.
The geomorphology of the Runteli Ridge is thought to have formed during the last deformation stage by shear stress applied from the northwest. The ridge shows a steep proximal slope which may repre-sent an ice-contact slope, whereas the distal slope is gentle. The internal structures of the sediment and the geomorphology suggest that the genesis and the form of the Runteli Ridge owes to ice push, which is thought to have occurred at the same time the ice-contact slope and the thrust faults were formed. An-yhow, no evidence of concurrent glaciofluvial sedi-mentation was observed. However, the initial dep-osition of the glaciofluvial sediment is most proba-bly prior to the deformation events and the deposi-tion of the till. The large scale proglacial channels and channel fills (RF5 and RF9) on the distal side of the study area back up this interpretation. The channels are thought to have formed during the retreat of the
glacier prior to the formation of the Runteli Ridge. The proglacial channels are not seen in the radar sec-tions or in the section logs on the proximal side of the area, which suggests that the area was still cov-ered with ice at the time the proglacial channels were formed. The channels are cutting the till radar facies (RF3 and RF8) which implies that the till was depos-ited prior to the proglacial sedimentation and the last stage of the deformation.
The interpretation of the radar facies RF6 and RF10 (including radar surfaces RS4 and RS6) is problematic. The facies was not identified in the sec-tion logs (Pasanen & Lunkka, 2008). The dipping radar reflections may owe their genesis to the pro-glacial glaciofluvial or rip current erosion and sedi-mentation. In the case of the proglacial glaciofluvi-al erosion and sedimentation, the relative age of the event is thought to be right after the deposition of the proglacial channel and channel fill radar facies (RF5 and RF9). In the case of the rip currents, the event is thought to have happened in the littoral po-sition when the area was emerging from the sea be-cause of the glacioisostatic uplift. The deep channel (< 5m, Figs. 4 and 5) backs up the glaciofluvial inter-pretation, but the laterally discontinuous radar facies in Figure 5 suggests a rip current interpretation. Also the position of the radar transect Isoniemi 7 (Figs. 2 and 4) at the southern edge of the proglacial chan-nel makes the interpretation difficult, and the deposi-tional environment of the radar facies can not be stat-ed unequivocally. Anyhow, erosion and deposition by rip currents are thought to be the most probable in-terpretation. It is thought that the open sea continued towards the east at least for a few kilometres when the area emerged from the sea.
RF7) was not seen in the section logs, but the fine sand sediment seen in the boreholes and onlapping lower boundary of the radar facies supports the in-terpretation.
7. Conclusions
GPR data interpreted with the radar stratigraphy technique can yield a substantial enhancement in the interpretation of the depositional environments in the coarse grained sediments compared to section logging and borehole data. This study expands the earlier sedimentological study in the area by Pasanen & Lunkka (2008). GPR provided the possibility to study the lateral continuity of the deposits, and new facies were found that were not previously observed in the sedimentological study by Pasanen & Lunk-ka (2008). The sequence of events, presented below, is based on the results of the sedimentological and GPR studies.
1. The deposition of the glaciofluvial fan-delta sedi-ments occurred.
2. The advancement of the ice-sheet to the area prob-ably from the west or the southwest occurred, and there was a deposition of the till and the defor-mation of the earlier glaciofluvial fan-delta sedi-ments.
3. The retreat of the ice-sheet from the area occurred and was followed by the cutting and infilling of the proglacial glaciofluvial channels in the deep water (> 200 m).
4. The formation of the Runteli ridge occurred by pushing of the readvancing or fluctuating ice-sheet from the northwest. The proglacial glaciotecton-ic deformation caused the breaking of the till bed into till patches and the formation of the thrust faults in the proximal side of the study area. This event is thought to have occurred during the ini-tial deglaciation ca. 10000 years ago.
5. Glacioisostatic uplift raised the area to the littoral position causing the rip current erosion and sedi-mentation in the distal side of the study area. The wave and sea-ice action reworked the earlier sed-iments causing horizontally deposited sedsed-iments
above the wave-cut surface. Mass movements also occurred dispersing the sediments to the lower lev-el, where they infilled the hollows in the sea floor.
Acknowledgements
This study was funded by the Finnish Academy Re-search Grant 210909, University of Oulu Thule In-stitute’s PACE -project and the National Research-er School in Geology. Professor Juha Pekka Lunkka is thanked for discussion and comments on the ma-nuscript, M.Sc. Tiina Eskola for assisting in the field, and Phil.Lic. Hannu Vehkaperä for providing the bo-rehole data. The author would like to thank Professor James S. Aber, Dr. Marcel A.J. Bakker and Dr. Pertti Sarala for their constructive reviews of this article.
References
Annan, A.P. & Davis, J.L., 1976. Impulse radar sounding in permafrost. Radio Science 11, 383 –394.
Bakker, M.A.J., 2004. The internal structure of Pleistocene push moraines. A multidisciplinary approach with em-phasis on ground-penetrating radar. Unpublished PhD-thesis. TNO Built Environment and Geosciences, Geo-logical Survey of Netherlands, 180 p.
Bakker, M.A.J. & Van der Meer, J.J.M., 2003. Structure of a Pleistocene push moraine revealed by GPR: the east-ern Veluwe Ridge, The Netherlands. Geological Society, London, Special Publications 211, 143–151.
Bargel, T., Huhta, P., Johansson, P., Lagerbäck, R., Mäki-nen, K., NenoMäki-nen, K., Olsen, L., Rokoengen, K., Sved-lund, J.O., Väänänen, T. & Wahlroos, J.E., 1999. Maps of Quaternary geology in central Fennoscandia, sheet 3: ice-flow indicators, scale 1 : 1 000 000, and Quaternary stratigraphy, scale 1 : 2 000 000.
Beres, M., Green, A., Huggenberger, P. & Horstmeyer, H., 1995. Mapping the Architecture of Glaciofluvial Sedi-ments with 3-Dimensional Georadar. Geology 23, 1087– 1090.
Beres, M., Huggenberger, P., Green, A.G. & Horstmeyer, H., 1999. Using two- and three-dimensional georadar methods to characterize glaciofluvial architecture. Sedi-mentary Geology 129, 1–24.
Busby, J.P. & Merritt, J.W., 1999. Quaternary deformation mapping with ground penetrating radar. Journal of Ap-plied Geophysics 41, 75–91.
Daniels, D.J., Gunton, D.J. & Scott, H.F., 1988. Introduc-tion to subsurface radar. IEE Proceedings 135, 128–320. Davis, J.L. & Annan, A.P., 1989. Ground-Penetrating Radar
Eronen, M., Forsström, L., Holappa, K., Jungner, H. & Ro-man, S., 1995. Radiohiiliajoitus Oulun Hangaskankaan sinisimpukkaesiintymästä. Geologi 47, 47–52. Gawthorpe, R.L., Collier, R.E.L., Alexander, J., Bridge, J.S.
& Leeder, M.R., 1993. Ground penetrating radar: ap-plication to sandbody geometry and heterogeneity stud-ies. Geological Society, London, Special Publications 73, 421–432.
Gibbard, P.L., 1979. Late Pleistocene Stratigraphy of the Area around Muhos, North Finland. Annales Academi-ae Scientiarum FennicAcademi-ae AIII 129, 1–38.
Helle, R. & Ylinen, M., 1965. Hangaskankaasta Kajaanin-Rokuan harjujaksossa. Yritys siitepölyanalyysin ja radio-hiiliajoituksen avulla selvittää harjun rakennetta. Ter-ra 77, 104–111.
Helmens, K.F., Johansson, P.W., Räsänen, M.E., Alexander-son, H. & Eskola, K.O., 2007. Ice-free intervals continu-ing into marine isotope stage 3 at Sokli in the central ar-ea of the Fennoscandian glaciations. Bulletin of the Ge-ological Society of Finland 79, 17–39.
Hirvas, H., 1991. Pleistocene stratigraphy of Finnish Lapland. Geological Survey of Finland, Bulletin 354, 1–123. Hirvas, H. & Nenonen, K., 1987. The till stratigraphy of
Finland. Inqua till symposium, Finland 1985. Geologi-cal survey of Finland, Special paper 3, 49–63.
Hänninen, P., 1991. Maatutkaluotaus maaperägeologisissa tutkimuksissa. Geologian tutkimuskeskus, Tutkimusra-portti 103, 1–37.
Jakobsen, P.R. & Overgaard, T., 2002. Georadar facies and glaciotectonic structures in ice marginal deposits, north-west Zealand, Denmark. Quaternary Science Reviews 21, 917–927.
Johansson, P. & Kujansuu, R. (eds.), 2005. Pohjois-Suomen maaperä: maaperäkarttojen 1:400 000 selitys. Summa-ry: Quaternary deposits of Northern Finland – explana-tion to the maps of Quaternary deposits 1:400 000. Es-poo. Geological Survey of Finland, 236 p.
Jol, H.M. & Smith, D.G., 1991. Ground Penetrating Ra-dar of Northern Lacustrine Deltas. Canadian Journal of Earth Sciences 28, 1939–1947.
Lønne, I. & Lauritsen, T., 1996. The architecture of a mod-ern push-moraine at Svalbard as inferred from ground-penetrating radar measurements. Arctic and Alpine Re-search 28, 488–495.
Lunkka, J.P., Johansson, P., Saarnisto, M. & Sallasmaa, O., 2004. Glaciation of Finland. In: Ehlers, J. & Gibbard, P.L. (eds.) Quaternary Glaciations – Extent and Chro-nology. Elsevier, Amsterdam, pp. 93–100.
MacMahan, J.H., Thornton, E.B. & Reniers, J.H.M., 2006. Rip current review. Coastal Engineering 53, 191–208. Mäkinen, J. & Räsänen, M., 2003. Early Holocene
regres-sive spit-platform and nearshore sedimentation on a gla-ciofluvial complex during the Yoldia Sea and the Ancy-lus Lake phases of the Baltic Basin, SW Finland. Sedi-mentary Geology 158, 25–56.
Neal, A., 2004. Ground-penetrating radar and its use in
sed-imentology: principles, problems and progress. Earth-Science Reviews 66, 261–330.
Neal, A., Richards, J. & Pye, K., 2002. Sedimentology of coarse-clastic beach-ridge deposits, Essex, southeast Eng-land. Sedimentary Geology 162, 167–198.
Nenonen, K., 1995. Pleistocene stratigraphy and reference sections in southern and western Finland. Geological Survey of Finland, Kuopio. 205 p.
Overgaard, T. & Jakobsen, P.R., 2001. Mapping of glaci-otectonic deformation in an ice marginal environment with ground penetrating radar. Journal of Applied Geo-physics 47, 191–197.
Pasanen, A. & Lunkka, J.P., 2008. Glaciotectonic defor-mation of till-covered glaciofluvial deposits in Oulu re-gion, Finland. Bulletin of the Geological Society of Fin-land 80, 89–103.
Pelpola, C.P. & Hickin, E.J., 2004. Long-term bed load transport rate based on aerial-photo and ground pene-trating radar surveys of fan-delta growth, Coast Moun-tains, British Columbia. Geomorphology 57, 169–181. Roberts, M.C., Niller, H.-P. & Helmstetter, N., 2003. Sedimentary architecture and radar facies of a fan del-ta, Cypress Creek, West Vancouver, British Columbia. Geological Society, London, Special Publications 211, 111–126.
Roksandic, M.M., 1978. Seismic facies analysis concepts. Geophysical Prospecting 26, 383–398.
Salonen, V., Kaakinen, A., Kultti, S., Miettinen, A., Eskola, K.O. & Lunkka, J.P., 2007. Middle Weichselian glacial event in the central part of the Scandinavian Ice Sheet recorded in the Hitura pit, Ostrobothnia, Finland. Bore-as 37, 38–54.
Sangree, J.B. & Widmier, J.M., 1979. Interpretation of depositional facies from seismic data. Geophysics 44, 131–160.
Smith, D.G. & Jol, H.M., 1992. Ground-Penetrating Ra-dar Investigation of a Lake Bonneville Delta, Provo Lev-el, Brigham-City, Utah. Geology 20, 1083–1086. Smith, D.G. & Jol, H.M., 1997. Radar structure of a
Gil-bert-type delta, Peyto Lake, Banff National Park, Cana-da. Sedimentary Geology 113, 195–209.
Sutinen, R., 1992. Glacial Deposits, their electrical proper-ties and surveying by image interpretation and ground penetrating radar. Geological Survey of Finland, Bulle-tin 392, 1–123.
Tikkanen, M. & Oksanen, J., 2002. Late Weichselian and Holocene shore displacement history of the Baltic Sea in Finland. Fennia 180.
van Dam, R.L. & Schlager, W., 2000. Identifying causes of ground-penetrating radar refections using time-domain refectometry and sedimentological analyses. Sedimento-logy 47, 435–449.