www.atmos-chem-phys.net/12/941/2012/ doi:10.5194/acp-12-941-2012
© Author(s) 2012. CC Attribution 3.0 License.
Chemistry
and Physics
Determination of the biogenic secondary organic aerosol fraction in
the boreal forest by NMR spectroscopy
E. Finessi1,*, S. Decesari1, M. Paglione1, L. Giulianelli1, C. Carbone1, S. Gilardoni1, S. Fuzzi1, S. Saarikoski2, T. Raatikainen2,8, R. Hillamo2, J. Allan3, Th. F. Mentel4, P. Tiitta5,9, A. Laaksonen2,5, T. Pet¨aj¨a6, M. Kulmala6, D. R. Worsnop2,6,7, and M. C. Facchini1
1Institute for Atmospheric Sciences and Climate (ISAC), National Research Council (CNR), Bologna, Italy 2Finnish Meteorological Institute (FMI), Helsinki, Finland
3National Centre for Atmospheric Science & School of Earth, Atmospheric & Environmental Sciences,
The University of Manchester, Manchester, UK
4Institut f¨ur Chemie und Dynamik der Geosph¨are, Forschungszentrum J¨ulich GmbH (FZJ-ICG-2), J¨ulich, Germany 5Department of Applied Physics, University of Eastern Finland (UEF), Kuopio, Finland
6Department of Physics, University of Helsinki, Finland 7Aerodyne Research, Inc. Billerica, MA, USA
8School of Earth and Atmospheric Sciences, Georgia Institute of Technology, Atlanta, GA, USA 9Atmospheric Chemistry Research Group, North-West University, Potchefstroom, South Africa *now at: Department of Chemistry, University of York, Heslington, York, YO10 5DD, UK
Correspondence to:E. Finessi (e.finessi@isac.cnr.it)
Received: 7 July 2011 – Published in Atmos. Chem. Phys. Discuss.: 10 August 2011 Revised: 15 December 2011 – Accepted: 19 December 2011 – Published: 19 January 2012
Abstract. The study investigates the sources of fine organic aerosol (OA) in the boreal forest, based on measurements in-cluding both filter sampling (PM1)and online methods and
carried out during a one-month campaign held in Hyyti¨al¨a, Finland, in spring 2007. Two aerosol mass spectrometers (Q-AMS, ToF-AMS) were employed to measure on-line con-centrations of major non-refractory aerosol species, while the water extracts of the filter samples were analyzed by nuclear magnetic resonance (NMR) spectroscopy for organic func-tional group characterization of the polar organic fraction of the aerosol. AMS and NMR spectra were processed sepa-rately by non-negative factorization algorithms, in order to apportion the main components underlying the submicrome-ter organic aerosol composition and depict them in submicrome-terms of both mass fragmentation patterns and functional group com-positions.
The NMR results supported the AMS speciation of oxi-dized organic aerosol (OOA) into two main fractions, which could be generally labelled as more and less oxidized organ-ics. The more oxidized component was characterized by a mass spectrum dominated by them/z44 peak, and in parallel by a NMR spectrum showing aromatic and aliphatic back-bones highly substituted with oxygenated functional groups (carbonyls/carboxyls and hydroxyls). Such component, con-tributing on average 50 % of the OA mass throughout the
observing period, was associated with pollution outbreaks from the Central Europe. The less oxidized component was enhanced in concomitance with air masses originating from the North-to-West sector, in agreement with previous investi-gations conducted at this site. NMR factor analysis was able to separate two distinct components under the less oxidized fraction of OA. One of these NMR-factors was associated with the formation of terrestrial biogenic secondary organic aerosol (BSOA), based on the comparison with spectral pro-files obtained from laboratory experiments of terpenes photo-oxidation. The second NMR factor associated with western air masses was linked to biogenic marine sources, and was enriched in low-molecular weight aliphatic amines. Such findings provide evidence of at least two independent sources originating biogenic organic aerosols in Hyyti¨al¨a by oxida-tion and condensaoxida-tion mechanisms: reactive terpenes emit-ted by the boreal forest and compounds of marine origin, with the latter relatively more important when predominantly polar air masses reach the site.
1 Introduction
Atmospheric aerosol particles directly impact air quality, vis-ibility and the radiation balance of the Earth, which in turn contributes to regulating the climate system on both regional and global scales (Ravishankara, 2005; IPCC, 2007). Since organic compounds constitute a large fraction of submicrom-eter particles mass on the global scale, up to 90 % (Kanaki-dou et al., 2005; Zhang et al., 2007), their accurate quan-tification and source apportionment are necessary in order to determine their role in the above environmental issues and define efficient abatement strategies.
Secondary organic aerosols (SOA), formed by gas-to-particle conversion of oxidized vapors, and other oxygenated organic aerosols formed by chemical ageing of existing par-ticles (Fuzzi et al., 2006), are expected to contribute to a large fraction of total organic particulate mass outside ur-ban areas (Baltensperger et al., 2005; Lanz et al., 2007). Nevertheless, current estimates of global SOA production remain inaccurate. They vary by over 2 orders of magni-tude, because they are not well constrained by organic source apportionment studies (Simpson et al., 2007). The impor-tance of biogenic sources is thought to be significant, given that global emissions of biogenic volatile organic compounds (BVOCs) are up to ten times greater than those from anthro-pogenic sources (Calvert, 2002; Atkinson and Arey, 2003; Guenther et al., 1995). It is estimated that biogenic volatile organic compound (BVOC) oxidation represents the largest SOA global source, ranging from 12 to 70 Tg yr−1(Hallquist
et al., 2009).
Combined experimental and modelling studies have inves-tigated the formation of SOA from the photo-oxidation of several simple VOCs, such as alkyl-benzenes and terpenoids, obtaining a considerable amount of data for controlled (lab-oratory) conditions (Paulot et al., 2009; Rickard et al., 2009; Cao et al., 2008; Ng et al., 2007; Song et al., 2007; Johnson et al., 2004). The evaluation of SOA formation mechanisms in the field remains challenging because of multiple contribut-ing sources, variable oxidant concentrations and composi-tion, and the contribution of background gases and aerosols (De Gouw and Jimenez, 2009).
The elucidation of SOA chemical composition in ambi-ent air, believed to encompass several thousands of indi-vidual compounds (Goldstein and Galbally, 2007), repre-sents a major challenge for state-of-the-art analytical tech-niques. The recovery of gas-chromatographic/mass spec-trometric (GC/MS) techniques with respect to total aerosol organic carbon (OC) is normally below 15 % (Cahill et al., 2006). Hence, organic source apportionment methods based on GC/MS techniques rely on the existence of source-specific molecular markers that are stable under atmospheric conditions (Schauer et al., 1996; Claeys et al., 2004). How-ever, the actual stability of important molecular markers, such as levoglucosan, has been questioned by recent obser-vations (Capes et al., 2008).
An alternative approach is based on the integral chemi-cal features of OC (e.g. mass fragments, functional groups, elemental ratios, isotopic ratios, ions, etc.) rather than on individual species. Such a bulk approach has been pro-posed by using Fourier transform infrared (FTIR) (Russell et al., 2011) and proton nuclear magnetic resonance (1
H-NMR) spectroscopies (Decesari et al., 2007, 2011). Most widespread applications exploit aerosol mass spectrometry (AMS) coupled with multivariate statistical analysis meth-ods for the decomposition of the mass spectra timeline into contributions of “factors”, which are considered as proxies for chemical classes of organic compounds sharing common formation processes. Several multivariate statistical analy-sis methods have been applied to deconvolve AMS spectra of ambient organic particles into a few major components, e.g. multi component analysis (MCA) (Zhang et al., 2005, 2007), and positive matrix factorization (PMF) (Lanz et al., 2007; Ulbrich et al., 2009; Paatero et al., 1994). The most commonly identified PMF-AMS factors have been named hydrocarbon-like organic aerosol (HOA) and oxygenated or-ganic aerosol (OOA), and are thought to be strongly linked to primary and secondary organic aerosol (POA and SOA), re-spectively. In some environments, OOA are further split into different types, including a more oxidized type, or OOA1, and a less oxidized one, OOA2, also called low-volatility and semivolatile oxidized organic aerosols, LV-OOA and SV-OOA, on the basis of parallel measurements of particle volatility and chemical composition (Jimenez et al., 2009).
Even if important insights on OA composition have been obtained so far, they are often method-dependent, i.e. af-fected by the sensitivity of the employed methodology to spe-cific chemical features of aerosol OC. Since each technique has its own strengths and weaknesses, a complementary ap-proach is highly recommended.
The present manuscript explores the variability of organic aerosol composition during an intensive EUCAARI (Kul-mala et al., 2009; Kerminen et al., 2010) field study held in spring 2007 in Hyyti¨al¨a (Finland), employing1H-NMR and AMS characterization methods. The NMR analysis comple-ments the AMS characterization by providing information on the functionalities, which are not well speciated by the AMS. On the other hand, AMS permits OA to be analysed at a higher time resolution. For the attribution of spectral fingerprints to natural and anthropogenic sources, use was made of data acquired during reaction chamber experiments performed in the SAPHIR facility, J¨ulich.
2 Experimental
24◦17′E, 181 m a.s.l.). This forestry station is located in the
middle of a more than 40-yr old Scots pine stand (Pinus
SylvestrisL.), which homogeneously surrounds the site for
several hundreds meters. Tampere is the largest neighbour-ing city and is situated about 60 km S–SW. Measurements were carried out from 27 March to 17 May 2007. However, the present work focuses on the collection period of PM1
fil-ter samples analyzed by1H-NMR spectroscopy, i.e. the days from 29 March to 19 April.
2.1 Aerosol measurements
Atmospheric particles were sampled by a suite of co-located online instruments throughout the campaign. A twin Dif-ferential Mobility Particle Sizer (DMPS) continuously mon-itored the size distribution of submicrometer aerosol parti-cles and its evolution with a 10 min time resolution (Aalto et al., 2001). Real-time measurements of the concentra-tions of non-refractory PM1aerosol organic matter and
inor-ganic ions including sulphate, nitrate, ammonium and chlo-ride were performed by two aerosol mass spectrometers run-ning in parallel: (a) an Aerodyne Quadrupole Aerosol Mass Spectrometer (Q-AMS), and (b) a High Resolution Time-of-Flight Aerosol Mass Spectrometer (ToF-AMS). A thor-ough description of the instruments and associated calibra-tion and operacalibra-tion procedures is provided elsewhere (Jayne et al., 2000; Allan et al., 2003; Jimenez et al., 2003; Alfarra et al., 2006; De Carlo et al., 2006; Canagaratna et al., 2007). A collection efficiency of 0.5 was used, based on the compar-ison with DMPS data and on previous experience with the AMS ambient and laboratory works (Matthew et al., 2008).
Since at the beginning of the campaign, the ToF-AMS suf-fered from some technical problems only the Q-AMS data are used here for the absolute concentrations. However, be-cause of the higher spectral resolution, the ToF-AMS pro-vided useful data for the interpretation of the presented data set.
The Q-AMS was operated by alternating between mass spectrum (MS) and particle time of flight (pTOF) modes (Jimenez et al., 2003) until the 4 April, and then it was en-abled to performed also particle flux measurements (Nemitz et al., 2008). In practice this meant that 30 min of every hour was spent on flux measurements, and during the remaining 30 min it was alternating between MS, pTOF and jump mass spectrum (JMS) modes (Crosier et al., 2007). The Q-AMS data are presented here as 30 min averages.
The so-obtained Q-AMS total mass concentrations were converted to volume concentrations using the densities re-ported by Cross et al. (2007). These values compare fairly well with the volume concentrations derived from the DMPS data assuming spherical particles. However, it seems that the AMS/DMPS ratio changed when the AMS was prepared for flux measurements, being about 0.4 and 0.8 before and after the 4 April, respectively. The most likely explanation for this is a bending of the particle inlet, which may have led to the
loss of particles. Ionization efficiency changes are unlikely, because the air beam signal did not change during this period. The concentrations of major ionic species in submicrom-eter particles were also dsubmicrom-etermined by a Particle-into-Liquid Sampler (PILS; Metrohm Peak Inc) coupled with two ion chromatographs (IC; Dionex ICS-2000) and using a virtual impactor (VI; Loo and Cork, 1988) with a cut-off size of 1.3 µm prior to the PILS-ICs system (Orsini et al., 2003).
A high volume sampler (HiVol) working at 850 l min−1
and configured to remove particles with aerodynamic diame-ter larger than 1 µm was employed from 29 March to 19 April to collect fine particles on quartz-fiber filters (12 cm diame-ter, QMA grade). The quartz-fiber filters were washed with Milli-Q water and heated for 1 h at 800◦C before sampling
to reduce blank values. After sampling, lasting on average 10 h, the collected PM1filters were stored in a fridge at 4◦C
until analysis.
Total Carbon (TC) content was measured directly from small sub-samples of the HiVol filters (about 2 % of sam-pled area) by evolved gas analysis. Measurements were per-formed by a Multi N/C 2100 analyser (Analytik Jena, Ger-many) equipped with a module for solid samples, which are exposed to increasing temperature (up to 950◦C) in a
pure oxygen carrier gas. Under these conditions all car-bonaceous matter (organic, carbonate and elemental carbon) is converted into CO2 (Gelencser et al., 2000) and TC is
measured as total evolved CO2by a non-dispersive infrared
(NDIR) analyser. The remaining portion of each HiVol fil-ter was extracted with deionized ultra-pure wafil-ter (Milli-Q) in a sonication bath for 1 h and the water extract was filtered on PTFE membranes (pore size: 0.45 µm) in order to remove suspended particles. Aliquots of the water extracts were used to determine the water-soluble organic carbon (WSOC) con-tent by a Multi N/C 2100 total organic carbon analyser (Ana-lytik Jena, Germany) equipped with a module for liquid sam-ples. For each sample, parallel measurements of carbonate carbon and total organic carbon were carried out: the dif-ference between total soluble carbon and carbonate carbon results in WSOC (Rinaldi et al., 2007). The difference be-tween TC and WSOC and carbonate carbon resulted in the water-insoluble carbon (WINC).
The remaining aliquots of the water extracts were dried un-der vacuum and re-dissolved in deuterium oxide (D2O) for
functional group characterization by proton-Nuclear Mag-netic Resonance (1H-NMR) spectroscopy (Decesari et al., 2000). The1H-NMR spectra were acquired at 400 MHz with a Varian Mercury 400 spectrometer in 5 mm probes. Sodium 3-trimethylsilyl-(2,2,3,3-d4)propionate (TSP-d4)was
preva-lently used as referred internal standard, adding 50 µl of a TSP-d4 0.05 % (by weight) solution in D2O (1.5 µmol H
belonging to the standard in the probe). In some cases, methanol (MeOH) was used as internal standard (0.5 µmol H) instead of TSP-d4.1H-NMR spectroscopy in protic solvents
chemical shift, ppm) in which the signals occur, they can be attributed to different H-C-containing functional groups. Detection limits for an average sampling volume of 500 m3 were of the order of 3 nmol m−3for each functional groups.
2.2 Factor analysis of AMS and NMR spectral data sets
The time-dependent organic mass spectra from the Q-AMS measurements were selected for Positive Matrix Factoriza-tion (PMF). The analysis was performed applying the PMF Evaluation Tool (Ulbrich et al., 2009) based on version 4.2 of PMF2 algorithm (Paatero and Tapper, 1994; Paatero, 1997). Standard data pre-treatment, applying minimum error crite-ria and down weighting weak vacrite-riables and m/z44 related peaks, was performed as described in Ulbrich et al. (2009). The PMF analysis was quite difficult due to noisy data se-ries, a leak of air signal (m/z28) to organicm/z29, an elec-tronic interference problem manifested as a transient series of peaks with 10m/zdifference, and relatively low variations in organic oxidation state, at least compared with the 2005 data series (Raatikainen et al., 2010). Zero-averaged noise was not in itself a problem, merely decreasing the relative er-ror (Q/Qexp) to a value much lower than one. An additional explanation for the low Q/Qexp is that original single ion noise may have been overestimated. To avoid finding a noise factor, them/z29 peak was down weighted by a factor of five. In order to try to remove the periodic electronic interfer-ence explicitly, test calculations were performed where one factor was allowed to vary without the non-negativity con-straint. This interference was found to vary around zero. To investigate numerical stability, the PMF solution space was explored by varying seeds, numbers of factors (1–5), and ro-tational parameter FPEAK. After this processing, it was very clear that a good solution could not be found for more than two factors. Indeed, a two-component PMF analysis, where the factors were identified as OOA1 and OOA2 provided rea-sonable solutions having fairly identical concentration time series and Q/Qexp values for FPEAK values from−0.4 to 0.4. The main difference between these solutions is the frac-tion ofm/z44 peak (f44) of OOA2 ranging from 0.00 to 0.08, for FPEAK greater than−0.08 and lower than−0.16, respectively. Given that zero values forf44 are not expected, the solution having OOA2f44 = 0.04 and FPEAK =−0.12 was finally selected as the best.
Like the Q-AMS, the ToF-AMS was able to resolve two factors reliably: OOA1 and OOA2. The additional variance provided by higher-order solutions did not show any dis-tinctly new features in the profile spectra and were deemed to be more indicative of technical issues with the instrument, such as subtle nonlinearities introduced by thresholding or signal saturation. It should be noted that PMF analysis has been performed successfully on datasets subsequently ob-tained with the same instrument (Allan et al., 2010; Robin-son et al., 2011). Therefore, the lack of additional fac-tors should be taken as indicative of the lack of variation
in total mass terms within the dataset, further supporting the conclusion that OOA1 and OOA2 were the only signif-icant factors present, limited by the short time period (two weeks) of Tof-AMS sampling. In the ToF-AMS case, a so-lution with FPEAK =−0.5 was chosen, as non-negative val-ues resulted in solutions where thef44 value of OOA2 was zero. It should also be borne in mind that many choices of FPEAK would probably produce valid solutions, while nega-tive FPEAK values tend to produce factors whose time series are more distinct but with more similar mass spectra and vice versa for the positive values (Allan et al., 2010). In the light of the findings of Morgan et al. (2010) and Ng et al. (2010), a solution where thef44 value was non-zero was deemed more chemically meaningful. In this instance, the OOA1 fac-tor had anf44 of 0.17 and anf43 of 0.09, while OOA2 had anf44 of 0.09 and anf43 of 0.12.
The NMR spectral dataset was also processed by factor analysis (FA) methodologies, in order to establish contribu-tions and spectral profiles of major components of WSOC. It should be noted that the carbon fraction insoluble in wa-ter (WINC) was not analyzed by NMR in this study. The raw NMR spectra were subjected to several pre-processing steps prior to FA, in order to avoid any misleading source of variability. All the spectra were corrected for the base-line drift using a polynomial fit of the basebase-line in blank sam-ples. After accurate alignment of the spectra using the in-ternal standards as references for the chemical shift scale (Tsp-d4= 0 ppm; methanol = 3.36 ppm), the peaks of
con-taminants identified in blank samples were systematically removed from the dataset. In order to limit the effect of possible small variations in NMR peak position, the origi-nal resolution of the spectra was decreased by binning over 0.03 ppm and 0.01 ppm intervals, that provided matrices of 400 and 200 points, respectively. The resulting spectral dataset was processed using three different factor analysis al-gorithms, namely: (1) the PMF 3.0v software using the mul-tilinear engine algorithm provided by US Environmental Pro-tection Agency; (2) the non-negative matrix factorization (N-NMF) software with projected gradient bound-constrained optimization (Lin et al., 2007) (hereafter “N-NMF-GRA”); and (3) the multivariate curve resolution-alternating least squares (MCR-ALS) software (Tauler et al., 1995).
3 Results and discussion
3.1 Concentrations of main submicrometer aerosol
components
3.1.1 On-line measurements results
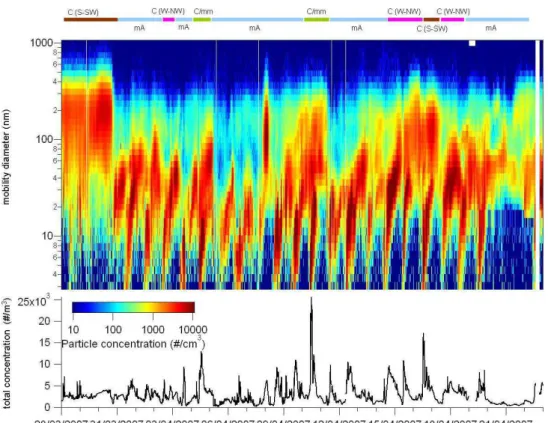
Between 29 March and 19 April, the air concentrations of the major aerosol species experienced large variations (Fig. 1). The highest organics loads were observed at the beginning of the period, from 29 to 30 March, when sulphate, ni-trate and ammonium concentrations also peaked, as regis-tered by the AMS and by the PILS-IC systems. Medium to relatively high concentrations were recorded in two other episodes on 10–11 and 15–17 April. During the remain-ing days, the concentrations of the above aerosol compo-nents were very low: 0.49±0.54 µg m−3 (organic matter), 0.21±0.14 µg m−3 (sulphate), 0.05±0.05 µg m−3 (nitrate)
and 0.06±0.07 µg m−3(ammonium) based on the Q-AMS
measurements. On the same days of background conditions, sodium and chloride ions showed highest concentrations, as measured by the PILS-IC system (Fig. 1b). The good corre-lation observed between sodium and chloride concentrations indicates that they originate mainly from sea salt.
The PM1 potassium ion, often used as stable tracer for
biomass burning plumes (Andreae, 1983; Ma et al., 2003), showed very high levels in the first period, between 28 and 30 March, and occurred in significant concentrations only sporadically in the remaining part of the campaign (Fig. 1c). In order to evaluate whether these concentration time trends coincided with air masses of particular origin, the NOAA HYSPLIT model (Hybrid Single-Particle Lagrangian Integrated Trajectory, http://ready.arl.noaa.gov/HYSPLIT. php) was used to calculate back-trajectories (BTs) every day from 29 March to 19 April. A plot of the 48 h backward BTs at 500 m above ground level and calculated every 4 h, is re-ported in Fig. 2. The analysis of the BTs showed that higher PM1sea salt levels were registered when the site was
influ-enced by air masses originated from the Norwegian Sea and from the Arctic, while the highest aerosol mass concentra-tions of sulphate, nitrate, ammonium and organics occurred in concomitance with continental air masses, which is con-sistent with previous observations at the Hyyti¨al¨a station (Al-lan et al., 2006; Cavalli et al., 2006; Tunved et al., 2006; Raatikainen et al., 2010). Figure 3 summarizes the chemical composition patterns averaged over periods corresponding to the main BTs typologies observed, i.e.: marine/Arctic (m/A), continental/modified marine (C/mm), continental from the West-to-NorthWest sector (C(W–NW)) and continental from the South-to-SouthWest sector (C(S–SW)).
The particle size distributions as measured by the DMPS (Fig. 4) appear as well to fit this preliminary classification of the observation period based on BT typologies. Several new particle formation episodes were detected throughout the ob-servation period, except for the first days when C(S–SW)
prevailed and only accumulation mode particles were ob-served. Freshly formed particles were clearly a significant source of Aitken mode particles during the experiment, even in moderately polluted periods as C/mm and C(W–NW).
3.1.2 Off-line analysis results
The PM1 total carbonaceous (TC) mass concentrations
spanned from less than 1 up to 8.5 µg C m−3, as shown by
filter measurements (Fig. 5, upper panel). The sampled car-bonaceous mass was primarily constituted by polar, oxy-genated compounds, while the water-soluble organics frac-tion (WSOC) being generally high, accounted on average for more than 70 % of the total carbon.
It should be noticed that the constant factor of 1.8 used here to convert WSOC into WSOM has been selected as the most appropriate value for non-urban water-soluble organic aerosol based the results of various previous studies (Aiken et al., 2008; Decesari et al., 2007; Russell et al., 2003) and those extrapolated by the AMSs for this data set. The Q-AMS organics concentrations, averaged over the filter sampling times, are also reported in Fig. 5 for comparison, showing a general good correlation (R= 0.93), although during the first polluted period and the period characterized by maritime air masses the AMS organic aerosol concentrations appear sig-nificantly underestimated compared to carbonaceous aerosol concentrations determined on PM1 filters. A more
quanti-tative comparison will be discussed later in the manuscript, but the reasons for such discrepancies must be attributed to the imperfect coverage of the first period characterized by continental air masses by AMS observations, and to positive artefacts on the filters on background days (see discussion below).
The functional group distributions of the NMR-detected WSOC are also reported in the lower panel of Fig. 5. Since 1H-NMR spectroscopy is mainly sensitive to pro-tons attached to carbon atoms (i.e. H-C bonds), H/C ra-tios based on the stoichiometry expected for each func-tional group (Tagliavini et al., 2006), were used to con-vert the concentrations of organic non-exchangeable hy-drogen atoms into organic carbon concentrations. The main functional groups identified include: (i) “alkyls” (HC-C<), i.e. aliphatic groups bound to saturated carbon atoms, such as methyls/methylenes/methynes; (ii) oxygen-containing aliphatic groups, like “carbonyls/carboxyls” (HC-C = O), i.e. alkyls adjacent to unsaturated carbon atoms, and like “hydroxyls” (HC-O), i.e. alkyls directly attached to oxy-gen atoms such as alcohols, ethers/esters, and (iii) “aromat-ics” (H-Ar). In addition, nitrogen- and sulfur-containing groups, such as “amines” N), and sulfonic groups (HC-SO3, such as methane sulfonic acid, “MSA”, were detected.
0 1 2 3 4 5 6 7 8 28/3/07 0.00 30/3/07 0.00 1/4/07 0.00 3/4/07 0.00 5/4/07 0.00 7/4/07 0.00 9/4/07 0.00 11/4/07 0.00 13/4/07 0.00 15/4/07 0.00 17/4/07 0.00 19/4/07 0.00 21/4/07 0.00 0 0.1 0.2 0.3 0.4 0.5 0.6 28/3/07 0.00 30/3/07 0.00 1/4/07 0.00 3/4/07 0.00 5/4/07 0.00 7/4/07 0.00 9/4/07 0.00 11/4/07 0.00 13/4/07 0.00 15/4/07 0.00 17/4/07 0.00 19/4/07 0.00 21/4/07 0.00 0 0.1 0.2 0.3 0.4 0.5 0.6 0.7 28/3/07 0.00 30/3/07 0.00 1/4/07 0.00 3/4/07 0.00 5/4/07 0.00 7/4/07 0.00 9/4/07 0.00 11/4/07 0.00 13/4/07 0.00 15/4/07 0.00 17/4/07 0.00 19/4/07 0.00 21/4/07 0.00 a) b) c) µ g m -3 µ g m -3 µ g m -3 Sulfate Ammonium Nitrate Organics Sodium Chloride Potassium Oxalate
Fig. 1. Time-series (µg m−3) of the non-refractory PM1species measured by Q-AMS(a). Chloride, sodium, potassium and oxalate ions
particle air mass concentrations as detected by the PILS-IC system(b, c).
chains or fully substituted aryls (Moretti et al., 2008), and (b) a fraction of WSOC constituted by semi-volatile organics and VOCs adsorbed on quartz-fiber filters that may be lost during the evaporation step prior to the NMR measurement. WSOC concentrations were measured both in the extracts as well as in the concentrated solutions in order to obtain esti-mates of possible losses due to evaporation. The replicated WSOC measurements prior and after the evaporation step, showed that the carbon fraction lost by the evaporation ac-counted in average for less than 30 % of the WSOC mass. Thus it means that overall the detected functional groups rep-resent the major WSOC composition. On the other hand for the samples collected in the background regime the evapo-rative losses resulted particularly increased, reaching up to
Fig. 2.Back-trajectory plots (48 h backward, 500 m AGL height) obtained by running the HYSPLIT model every four hours from 28 March to 21 April. Colours are used for distinct air masses typologies: marine/Arctic (mA), Continental/modified marine (C/mm), Continental from the W–NW sector and Continental from the S–SW sector.
compound (SVOC) standards indicates that more volatile compounds (VOC) were responsible for the observed evap-orative losses. Such compounds were not likely partitioned on ambient aerosol particles, but became rather adsorbed on the filter matrix. These observations were also confirmed by OC measurements performed on a series of back up filters of PM1samples collected during the same campaign but at
lower time resolution than those used for this manuscript. In-deed, the ratio of the back up OC up to the front OC resulted dramatically increased for samples collected when marine air masses prevailed. During this period, despite the reduced aerosol mass loadings, the frequent nucleation events (Fig. 4) witness a constant supply of condensable vapours probably from local sources in the forest.
3.2 Oxygenated organic aerosol composition
3.2.1 AMS factors
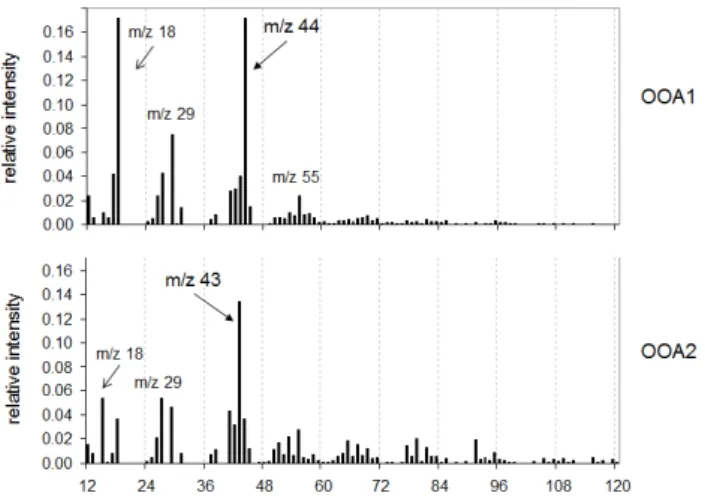
The time-dependent organic mass spectra recorded by the two AMSs (Q-AMS and ToF-AMS) were separately pro-cessed by the PMF methods as described in the experimental section. Two types of oxygenated organic aerosol (OOA) groups, namely OOA1 and OOA2, were particularly stable within all tested solutions and accounted for most of the or-ganic mass signal in both datasets. Concerning results from Q-AMS data, the final OOA1 and OOA2 mass spectra are shown in Fig. 6 and time series in Fig. 7.
The mass spectra of these two OOA components, with the ions atm/z44 (CO+2)dominating the OOA type 1 andm/z43 (mostly C2H3O+) dominating the OOA type 2, closely
match those most commonly isolated in previous studies (Zhang et al., 2007; Lanz et al., 2007). Overall, they strongly resemble those found at Hyyti¨al¨a in spring 2005 (Raatikainen
0.0 0.5 1.0 1.5 2.0 2.5 3.0 3.5 4.0
mA C/mm C (W-NW) C (S-SW) marine/Arctic regime Continental/modified
marine regime
Continental regime ammonium
nitrate sulfate organics
µ
g
m
-3
Fig. 3. PM1chemical composition (Q-AMS) averaged within the
four distinct periods of Fig. 2.
et al., 2010) and in other works performed in mid-latitude forests (Slowik et al., 2010; Allan et al., 2006) where the OOA1 represented the more oxidized, aged organic fraction, and the OOA2 represented the less oxidized, fresher sec-ondary organics.
Other commonly found organic groups, such as hydrocarbon-like (HOA) and biomass burning organic aerosol (BBOA), were not isolated here. On average, the
m/z57 peak, which is often related to HOA (e.g. Lanz et al., 2007) and also BBOA (Aiken et al., 2008), is less than 1 % of the total organic signal when that form/z44 peak is 11 %. There are a few time periods with higherm/z57 mass fractions, however it seem to be too low to be detected by the PMF method.
Fig. 4. Aerosol number size distribution measured by DMPS. Colours coded labels for the BTs distinct periods shown in Fig. 2 are also reported on the top.
Fig. 6.OOA1 and OOA2 mass spectra (Q-AMS).
(Aiken et al., 2008). The estimated O:C ratios for the OOA1 and OOA2 isolated from the Q-AMS dataset were, respec-tively, 0.73 and 0.23. These values turned out to be very close to those obtained by Raatikainen (i.e. 0.77±0.10 and 0.23±0.08), and were also similar to 0.73 and 0.17 averages from several observations (Ng et al., 2010).
Unfortunately the ToF-AMS data covered mainly the sec-ond half of the campaign, overlapping with the Q-AMS and NMR data for a limited time interval, with C(W–NW) and partially m/A prevailing. Nevertheless the analysis of the high-resolution ToF-AMS spectra enabled the direct deter-mination of the molecular ratios within this time interval. El-emental analysis was performed on the W mode high resolu-tion data according to Aiken et al. (2007, 2008). On average, the H:C ratio was estimated to be 1.36, the O:C ratio 0.64 and the OM:OC ratio 1.97. No statistically significant variation was found within the measurement period.
3.2.2 NMR factors
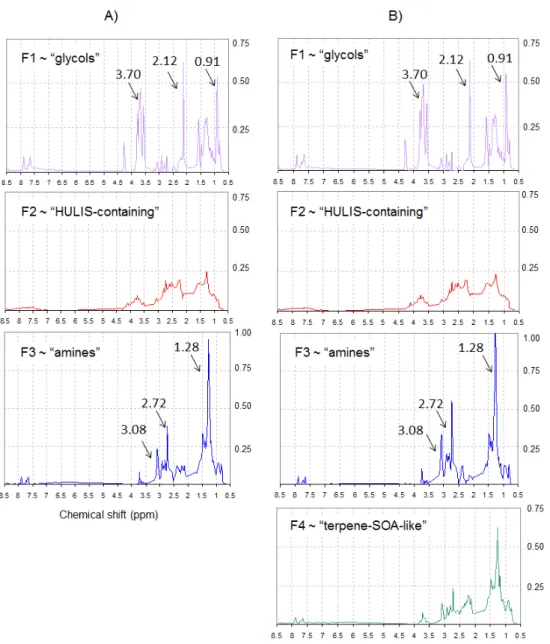
A total of seventeen1H-NMR spectra at 200 points resolu-tion were subjected to the factorizaresolu-tion models menresolu-tioned in the experimental section (PMF, N-NMF-GRA and MCR-ALS) and the solutions resulting from factors 2 up to 8 were explored. Within all the models, most of the variance turned out to be explained by a limited number of factors, the resid-ual of the order of the baseline noise being for more than 3 factors. The largest drop in the Q/Qexp ratios was registered between two and three factors, but additional factors contin-ued to reduce Q/Qexp toward 1 until no strong change in slope was observable for more than five factors. Beyond five factors, two or more factors were found to be strongly cor-related, suggesting that the measurements were not adequate to differentiate additional independent factors. In the follow-ing discussion, the analysis is limited to the most simple and conservative solutions with three and four factors.
0 1 2 3 4 5 6
28/3 30/3 1/4 3/4 5/4 7/4 9/4 11/4 13/4 15/4 17/4 19/4 21/4
OOA1 OOA2
C mA C/mA mA C mA
µ
g
m
-3
Fig. 7.Q-AMS-factors time series. Labels for the observed distinct BTs regimes are reported under the time x-axis.
Profiles and loadings resulting for 3- and 4-factor solu-tions are shown in Figs. 8 and 9. Only profiles from a single model (MCR-ALS) are reported for sake of clarity. Con-cerning the factor loadings, the values obtained by the three models were generally convergent, particularly in the three factor case (Fig. 9a). Conversely, the 4-factor case appears more affected by a certain degree of rotational ambiguity of the models in splitting the F3 and F4 factors, especially for samples collected on 15 and 16 April (Fig. 9b), with bet-ter results obtained with higher resolution, 400 points (not shown).
The isolated NMR factors are described as follows.
– F1: the first factor (hereinafter referred to as “glycols” factor) is characterized by compounds with hydroxyl (or ether) linkages and n-butyl chains, showing a spectrum similar to commercial butyl-glycols. Indeed, the ob-served signals show a good fit with the H-NMR spec-tra of ethylene glycol butyl ether and of 2-butoxyethyl acetate (Sigma-Aldrich online NMR library). Such fac-tor contributed randomly to the set of samples (Fig. 9) but was completely absent in blank samples, thus ex-cluding any filter contaminations prior/post sampling. Nonetheless positive artefacts or accidental contamina-tions during the sampling cannot be definitely ruled out. In fact, glycol ethers are chemicals commonly used in paints and ethylene glycol butyl ether (butoxy ethanol) was identified among other VOCs of toxicological inter-est in urban areas (Gallego et al., 2009). If not labora-tory contaminants, they may have originated from a lo-cal source at the sampling site or nearby. Their volatility is high (>10−1Torr), being in the VOC regime, hence
if they were atmospheric costituents in Hyyti¨al¨a, they were most probably sampled as adsorption artefacts on the quartz-fiber filters.
Fig. 8. NMR-factor profiles isolated by applying the MCR-ALS model with a 3-factor solution(a), and a 4-factor solution(b). All factor profiles are vertically normalized to 1 and are plotted versus the NMR chemical shifts.
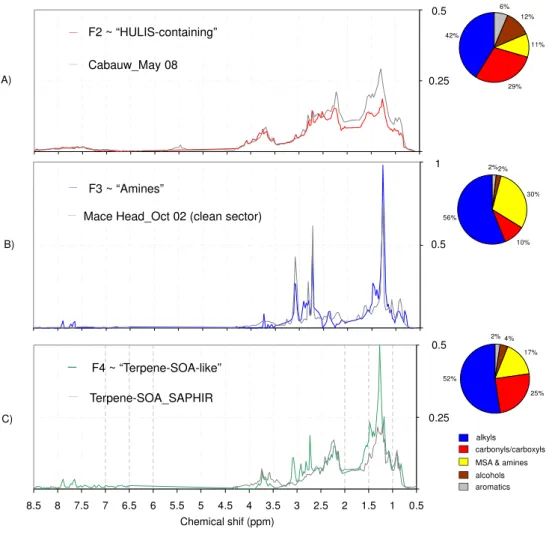
impacted by anthropogenic emissions (Fig. 10a), and al-ready reported in literature (Decesari et al., 2000, 2007). In terms of functional group distribution, polluted sam-ples typically show a more pronounced band of aromat-ics (visible in the range between 6.5–8.5 ppm) with re-spect to samples collected in remote locations. Besides this feature, the HULIS-containing factor’s profile re-tains signals of levoglucosan (visible in the spectral in-terval between 3.5–4.5 ppm), a well known atmospheric tracer for biomass combustion emissions. As shown in Fig. 9, the “HULIS-containing” factor accounted for most of the signal in the 30 March sample, C(S–SW) regime, and to a much lesser extent, it contributed to the
0 10 20 30 40 50 60 EPA GRA MCR-ALS mean models 0 50 100 150 200 250 300 350 0 10 20 30 40 50 60 3 0 /3 _ d 3 0 /3 _ n 3 1 /3 _ d 1 /4 _ d 2 /4 _ d 5 /4 _ d 7 /4 _ d 8 /4 _ d 1 1 /4 _ d 1 2 /4 _ d 1 4 /4 _ d 1 5 /4 _ m 1 5 /4 _ a 1 5 /4 _ n 1 6 /4 _ m 1 6 /4 _ a 1 7 /4 _ n
C m/A C/mm m/A C m/A
0 10 20 30 40 50 60 0 50 100 150 200 250 300 350 0 10 20 30 40 50 60 0 20 40 60 80 100 120 3 0 /3 _ d 3 0 /3 _ n 3 1 /3 _ d 1 /4 _ d 2 /4 _ d 5 /4 _ d 7 /4 _ d 8 /4 _ d 1 1 /4 _ d 1 2 /4 _ d 1 4 /4 _ d 1 5 /4 _ m 1 5 /4 _ a 1 5 /4 _ n 1 6 /4 _ m 1 6 /4 _ a 1 7 /4 _ n
C m/A C/mm m/A C m/A
A) B)
“Glycols” “Glycols”
“HULIS-containing” “HULIS-containing”
“Amines” “Amines”
“Terpene-SOA-like”
Fig. 9.NMR-factor loadings generated by the models applied to the low-resolution matrix with 3-factor solution(a)and 4-factor solution(b). Within each factor, distinctive coloured symbols are used for different models while the black squared symbols represent mean values with vertical bar as standard deviations. Loadings are expressed as absolute values in nmol H m−3.
biomass smoke to OC obtained by multiplying the lev-oglucosan concentrations by 7.35 as recommended by Fine et al. (2002) were 1.64 and 0.11 µg m−3 for the
Hyyti¨al¨a samples of 30/3 day and 15/4 night. Such con-centrations are relevant in absolute terms (Puxbaum et al., 2007), but they accounted for about 20 % and only <10 % of OM concentrations estimated for the two days of the experiment (Fig. 11). They were also lower than the WSOM fractions apportioned to an-thropogenic combustion sources by NMR (“HULIS-containing” compounds). In summary, levoglucosan data show that biomass burning was significant source of particulate organic matter in Hyyti¨al¨a during the pe-riods characterized by continental air masses, although such products did not account for the total WSOC
fraction which was put in relation to anthropogenic sources by the NMR analysis. The anthropogenically-influenced WSOC, or “HULIS-containing” factor, must be considered rather a mix of long-range transported pollution and wood burning products.
0.5 1 1.5 2 2.5 3 3.5 4 4.5 5 5.5 6 6.5 7 7.5 8 8.5
0.5 1 1.5 2 2.5 3 3.5 4 4.5 5 5.5 6 6.5 7 7.5 8 8.5
0.5 1 1.5 2 2.5 3 3.5 4 4.5 5 5.5 6 6.5 7 7.5 8 8.5
1
0.5
0.5 0.5
0.25
0.25
Chemical shif (ppm) A)
B)
C)
F2 ~ “HULIS-containing”
Cabauw_May 08
F3 ~ “Amines”
Mace Head_Oct 02 (clean sector)
F4 ~ “Terpene-SOA-like”
Terpene-SOA_SAPHIR
6% 12%
11%
29% 42%
2%
30%
10% 56%
2%
4% 17%
52%
25% 2%
alkyls carbonyls/carboxyls MSA & amines alcohols aromatics
Fig. 10. NMR-factors profiles (MCR-ALS) emerging from the Hyyti¨al¨a dataset (coloured lines) overlapped with reference spectra (grey lines). The comparison includes spectral signatures obtained in other field(a), (b)and chamber(c)campaigns. The functional groups patterns (%) corresponding to each factor are reported on the left.
accounted mainly for the OA composition when con-centrations reached very low levels during the back-ground regime (m/A), but it also contributed to the rise of concentrations during the last days of the sampling period, C(W–NW). The air mass origin from the At-lantic during the first two weeks of April, together with the presence of MSA and di-alkyl amines, suggest that the “amines” factor can be impacted by biogenic marine sources.
– F4: the fourth factor (hereinafter referred to as “terpene-SOA-like” factor) is found prevalently in the samples collected between 15 and 17 April, C(W–NW) and also, to a lesser extent, in the 30 March sample (Fig. 9). Unlike the “HULIS-containing” factor profile, aromatic protons (H-Ar) are scarcely visible in the “terpene-SOA-like” factor, except for two weak peaks, also present in the “glycols” and “amines” profiles, which may be due to defective splitting. Besides this, main distinguishing features of this factor is the presence
N
M
R
(
µ
g
m
-3)
A
M
S
(
µ
g
m
-3)
Fig. 11. OM apportionment by factorization of AMS- and NMR-data. Upper panel: Q-AMS-factor contributions averaged upon fil-ter sampling times. Lower panel: unaccounted wafil-ter-soluble and insoluble OM classes have been included. No data have been re-ported for NMR samples below detection limits.
The employ of available libraries of H-NMR spectra of reference compounds and materials (SOA) allows therefore a precise attribution of the NMR factors to WSOC source contributions. It should be noted, however, that, contrary to the “terpene-SOA” factor for which we can compare with spectra obtained in controlled laboratory conditions, our in-terpretation of the “HULIS-containing” factor is based on the similarities with ambient samples collected in polluted ar-eas, however we do not know how much these fingerprints are specific for the anthropogenic sources, which certainly contributed but we do not know the extent. The same pol-luted conditions may have lead to the accumulation of more, and more oxidized biogenic SOA. Therefore the HULIS-containing factor should be considered a “maximum anthro-pogenic WSOC fraction”, i.e. an upper limit, rather than ex-clusively anthropogenic.
Finally, it is worth mention that in another forest envi-ronment, in the British Columbia, Shwartz et al. (2010) em-ploying FTIR spectroscopic data provided strikingly similar
results about main factors contributing to OM concentra-tions to those emerging from the present study in the Finnish boreal forest. Shwartz and coauthors identify one anthro-pogenic component (“combustion”) and three probable bio-genic factors, including (a) alcohols, (b) amines and (c) car-bonylic compounds similar to terpene SOA, providing more or less the same speciation shown in Fig. 8 of our paper. The functional group distributions of the American samples are somewhat different from ours, with a more aliphatic (C-H) content in the combustion factor compared to the carbonyl-rich biogenic SOA factor, whereas according to the NMR analysis of the Finnish samples it is the other way around (Fig. 10). Such differences can be attributed to the different recovery of the two techniques (water-insoluble species are not accounted for by the H-NMR analysis). For this reason, in absence of collocated measurements, the comparison be-tween FTIR and NMR organic functional group speciation methods has to be kept to a qualitative level.
3.2.3 Comparison between AMS and NMR factors for
OA source attribution
Major components underlying the oxygenated organic aerosol fraction isolated from NMR data were compared to those apportioned by AMS and averaged upon filter sampling times (Fig. 11). It should be noted that no filter samples were collected at night-time during the background period, and therefore the off-line NMR analyses did not account for the nocturnal peaks of OOA2 observed by the AMSs in such conditions.
In order to compare NMR and AMS factor loadings, the concentration metrics used by the two techniques need to be homogenized, in an attempt to retrieve equivalent organic mass concentrations from the organic non-exchangeable hy-drogen concentrations provided by1H-NMR analysis. As a
first step, water-soluble organic carbon concentrations com-prising the NMR factors were derived from hydrogen con-centrations by using factor-specific H/WSOC ratios. The latter were extrapolated from WSOC and 1H-NMR mea-surements for spectral datasets representative for source types of the OA of interest to the present study. In par-ticular, H/C molar ratios values of 0.8, 0.9 and 1 were used for the “terpene-SOA-like”, “amines” and “HULIS-containing” NMR-factors, respectively, on the basis of the analysis of laboratory terpene SOA samples, marine aerosols in clean air masses sampled at the Irish station of Mace Head (Decesari et al., 2011), and of samples of biomass burn-ing aerosols (Tagliavini et al., 2006). The WSOC concen-trations estimated using such H/WSOC factors account for fully-substituted carbon atoms, which cannot be directly de-tected by1H-NMR analysis. However, the sum of WSOC
µ
g
m
-3
Fig. 12. Percentage and absolute concentrations (µg m−3) of the Q-AMS OOAs and filters organic components averaged upon the entire sampling period and each distinct sub-periods.
conversion factor of 1.8 was used to convert WSOC loadings into water-soluble organic mass concentrations (µg m−3).
Along with the NMR-detected WSOC components, both the unaccounted-WSOM and the water-insoluble organic matter (WIOM) fractions are included in Fig. 11 to facilitate com-parison with AMS-detected OM. WIOM was derived from WIOC = 0.9·TC (assuming an EC fraction of 10 % of TC). The conversion coefficients 1.8 and 1.4 were used to derive organic mass concentrations of the unaccounted-WSOM and WIOM, respectively.
In spite of the evident impact of sampling artefacts on WSOM concentrations during the background period and of the imperfect match between AMS observations and fil-ter collection during the first days of the campaign, the OA mass concentrations reconstructed by the two independent techniques were in overall agreement.
Even if the very few time-integrated filter samples cannot account for the great variability of OA composition observed by the online methods, when averaging the AMS factors over the filter sampling times, the OA composition patterns were comparable to those obtained by off-line measurements. The comparison between the patterns obtained by the AMS and NMR techniques is facilitated when looking at the averaged data over each distinct regime and the entire observing period (Fig. 12).
Two types of oxygenated organic components attributable to more and less oxidized organics, respectively, appeared particularly stable in all tested solutions used for factor anal-ysis. They accounted for most of the detected mass in both methodologies and are attributable to a more and a less ox-idized organic fraction. The more oxox-idized, aged organic fraction, represented by the AMS OOA1 and by the NMR
“HULIS-containing” factors, accounted for about 50 % of the detected organic mass in both cases, when consider-ing the entire period. This more oxidized fraction shows a mass spectrum dominated by them/z44 (CO+2)peak, and in parallel a NMR spectrum enriched in oxidized functional groups, such as carbonyls/carboxyls and hydroxyls. Addi-tionally, it shows high correlation coefficients with sulphate, ammonium, nitrate and potassium ions, and particularly con-tributed to the organic mass during the continental regime from the South-to-SouthWest sector. Thus, for all the above reasons, it has been linked to transported pollution, includ-ing wood burninclud-ing products. By contrast, the second ma-jor component, is represented by the AMS OOA2 and by the NMR factors related to biogenic OA, and greatly con-tributed to enhancing the OA mass during the marine/Arctic and C(W–NW) regimes. The fact that only NMR analysis and not AMS highlighted a biomass burning contribution in the first, more oxygenated component can be explained by considering that the Q-AMS operated discontinuously at the beginning of the campaign when continental air masses were most clearly seen, resulting in reduced sampling time cov-erage (less than 50 % for the 30/3 day sample, Fig. 5, upper panel). It is likely that the Q-AMS did not sample enough biomass burning products to resolve a biomass burning or-ganic aerosol (BBOA) factor.
based on similarities with spectral signatures of aerosol col-lected in clean marine environments, including MSA and alkyl amines signals and, therefore could be linked to a bio-genic OA source of marine origin. By contrast, the “terpene-SOA-like” factor is related to terrestrial secondary prod-ucts originating from the gas-to-particle conversion of VOCs emitted by conifer forests, on the basis of similarities with BSOA formed in chamber experiments with monoterpenes plus sesquiterpenes. Overall, a significant fraction of WSOC can be assigned to the terrestrial biogenic factor throughout the whole period (about 30 %), indicating a persistent source active in the area around the sampling site. It was also partic-ularly enriched during the C(W–NW) regime, reaching up to 50 % of the detected WSOC. The back-trajectories analysis showed that air masses influencing the site during the C(W– NW) period originated mainly from North West, undergo-ing a marine to continental transition over the Scandinavian forest area. Thus the BSOA enrichment in concomitance to prevailing C(W–NW) is reasonably connected to the longer time spent by the clean air masses over the Boreal forest with respect to that spent by the air masses arriving from North. This is consistent with previous investigations at Hyyti¨al¨a ob-serving aerosol properties during the marine-to-continental transition (Allan et al., 2006; Cavalli et al., 2006; Tunved et al., 2006; Raatikainen et al., 2010). Since a few short pollu-tion episodes were still detected during this period, a higher particle concentration may be also considered as a possible explanation for the BSOA enhancement with respect to low concentration periods, e.g. by acting as condensation sink for locally emitted gaseous precursors. However, the same com-position patterns are not observed during the C(S–SW) pe-riod, when still high particle concentrations were registered but the air masses originated from Central Europe. In sum-mary, the longer time spent over the Boreal forest by the air masses reaching the site within C(W–NW) remains the most plausible explanation of the observed BSOA enrichment.
4 Conclusions
Submicrometer organic aerosol observations employing AMS and NMR spectroscopy were performed in the Finnish forest environment at Hyyti¨al¨a during three weeks of April 2007 characterized by variable atmospheric conditions and transport patterns, from very clean background to fairly polluted regimes. Results from factor analysis applied sepa-rately on AMS and NMR spectral datasets showed that air mass origin had a strong impact on organic composition, in agreement with findings of previous investigations at this site. Polluted continental air masses were associated with more oxidized organic aerosols (AMS type “OOA1”) and NMR-detected water-soluble organic compounds rich of aro-matic and polysubstituted aliphatic compounds (similar to HULIS). Such OM component, clearly impacted by com-bustion sources, but including also more aged compounds
of probable secondary origin, can be considered as the max-imum anthropogenic fraction of OA. A second component, shown to be less oxygenated according to AMS analysis, was strongly enhanced in concomitance with air masses orig-inating from the North to West sector, i.e. from the Atlantic Ocean crossing Scandinavia. In such less polluted condi-tions, NMR analyses found prevalently biogenic contribu-tions and specifically two distinct factors that were linked to terrestrial and marine biogenic sources on the basis of sim-ilarities with spectral fingerprints and back-trajectory analy-sis. Overall, such terrestrial and marine biogenic components contributed equally to OA mass (about 30 % each) when av-eraging over the whole observing period, but showed rel-ative abundances strongly depending on the North-to-West air-mass transition. In summary, the findings trace and quan-tify at least two independent sources originating biogenic secondary organic aerosols in Hyyti¨al¨a through oxidation and condensation phenomena: a first source involving prod-ucts of marine origin, which is more important during low aerosol concentration regimes with predominantly polar air masses, and a second source involving reactions of locally emitted terpenes, which becomes more important with in-creasing time spent by air masses over the Boreal forest.
In this study, we have attempted to illustrate the changes in chemical composition of particulate organic matter between air mass types making explicit links to the estimated biogenic and anthropogenic fractions, as provided by both NMR and AMS. Although there are clear overlaps between NMR and AMS chemical classes, the OA mass budget indicates that a non-negligible fraction of OOA was actually water-insoluble and eluded NMR characterization. The nature of such “oxy-genated WIOC” deserves further investigations.
The complementary approach exploited here between in-dependent source apportionment methods has proven to give a more complete and accurate picture of organic aerosol vari-ability, and has provided the opportunity to trace biogenic SOA in the environment.
Acknowledgements. Main part of the work in this paper has
been funded with FP6 project EUCAARI (Contract 34684) and by ACCENT (Atmospheric Composition Change the European Network of Excellence). This research has received also funding from the Finnish Cultural Foundation and the Academy of Finland Centre of Excellence program (project no. 1118615). FMI and University of Helsinki are gratefully acknowledged for the research support at the Hyyti¨al¨a station.
Edited by: Y. Rudich
References
Aiken, A. C., DeCarlo, P. F., and Jimenez, J. L.: Elemental analysis of organic species with electron ionization high-resolution mass spectrometry, Anal. Chem., 79, 8350–8358, 2007.
Aiken, A. C., DeCarlo, P. F., Kroll, J. H., Worsnop, D. R., Huff-man, J. A., Docherty, K. S., Ulbrich, I. M., Mohr, C., Kimmel, J. R., Sueper, D., Sun, Y., Zhang, Q., Trimborn, A., Northway, M., Ziemann, P. J., Canagaratna, M. R., Onasch, T. B., Alfarra, M. R., Pr´evˆot, A. S. H., Dommen, J., Duplissy, J., Metzger, A., Baltensperger, U., and Jimenez, J. L.: O/C and OM/OC ra-tios of primary, secondary, and ambient organic aerosols with high-resolution time-of-flight aerosol mass spectrometry, Envi-ron. Sci. Technol., 42, 4478–4485, 2008.
Alfarra, M. R., Paulsen, D., Gysel, M., Garforth, A. A., Dommen, J., Pr´evˆot, A. S. H., Worsnop, D. R., Baltensperger, U., and Coe, H.: A mass spectrometric study of secondary organic aerosols formed from the photooxidation of anthropogenic and biogenic precursors in a reaction chamber, Atmos. Chem. Phys., 6, 5279– 5293, doi:10.5194/acp-6-5279-2006, 2006.
Allan, J. D., Jimenez, J., Williams, P., Alfarra, M., Bower, K., Jayne, J., Coe, H., and Worsnop, D.: Quantitative sampling us-ing an aerodyne aerosol mass spectrometer 1. Techniques of data interpretation and error analysis, J. Geophys. Res., 108, 4090, doi:10.1029/2002JD002358, 2003.
Allan, J. D., Alfarra, M. R., Bower, K. N., Coe, H., Jayne, J. T., Worsnop, D. R., Aalto, P. P., Kulmala, M., Hy¨otyl¨ainen, T., Cav-alli, F., and Laaksonen, A.: Size and composition measurements of background aerosol and new particle growth in a Finnish forest during QUEST 2 using an Aerodyne Aerosol Mass Spectrometer, Atmos. Chem. Phys., 6, 315–327, doi:10.5194/acp-6-315-2006, 2006.
Allan, J. D., Williams, P. I., Morgan, W. T., Martin, C. L., Flynn, M. J., Lee, J., Nemitz, E., Phillips, G. J., Gallagher, M. W., and Coe, H.: Contributions from transport, solid fuel burning and cooking to primary organic aerosols in two UK cities, Atmos. Chem. Phys., 10, 647–668, doi:10.5194/acp-10-647-2010, 2010. Andreae, M. O.: Soot carbon and excess fine potassium: Long range transport of combustion-derived aerosols, Science, 220, 1148–1151, 1983.
Atkinson, R. and Arey, J.: Gas-phase tropospheric chemistry of bio-genic volatile organic compounds: a review, Atmos. Environ., 37, Supplement, 2, S197–S219, 2003.
Baltensperger, U., Kalberer, M., Dommen, J., Paulsen, D., Alfarra, M. R., Coe, H., Fisseha, R., Gascho, A., Gysel, M., Nyeki, S., Sax, M., Steinbacher, M., Prevot, A. S. H., Sj¨ogren, S., Wein-gartner, E., and Zenobi, R.: Secondary organic aerosols from anthropogenic and biogenic precursors, Faraday Discuss., 130, 265–278, 2005.
Barnaba, F., Angelini, F., Curci, G., and Gobbi, G. P.: An im-portant fingerprint of wildfires on the European aerosol load, Atmos. Chem. Phys., 11, 10487–10501, doi:10.5194/acp-11-10487-2011, 2011.
Cahill, T. M., Seaman, V. Y., Charles, M. J., Holzinger, R., and Goldstein, A. H.: Secondary organic aerosols formed from ox-idation of biogenic volatile organic compounds in the Sierra Nevada Mountains of California, J. Geophys. Res., 111, D16312, doi:10.1029/2006JD007178, 2006.
Calvert, J. G., Atkinson, R., Becker, K. H., Kamens, R. M., Sein-feld, J. H., Wallington, T. J., and Yarwood, G.: The Mechanisms of Atmospheric Oxidation of Aromatic Hydrocarbons, Oxford
University Press, New York, 2002.
Canagaratna, M., Jayne, J., Jimenez, J., Allan, J., Alfarra, M., Zhang, Q., Onasch, T., Drewnick, F., Coe, H., Middlebrook, A., Delia, A., Williams, L., Trimborn, A., Northway, M., De-Carlo, P., Kolb, C., Davidovits, P., and Worsnop, D.: Chemical and microphysical characterization of ambient aerosols with the Aerodyne aerosol mass spectrometer, Mass Spectrom. Rev., 26, 185–222, doi:10.1002/mas.20115, 2007.
Cao, G. and Jang, M.: Secondary organic aerosol formation from toluene photooxidation under various NOxconditions and
par-ticle acidity, Atmos. Chem. Phys. Discuss., 8, 14467–14495, doi:10.5194/acpd-8-14467-2008, 2008.
Capes, G., Johnson, B., McFiggans, G., Williams, P. I., Haywood, J., and Coe, H.: Aging of biomass burning aerosols over West Africa: Aircraft measurements of chemical composition, micro-physical properties, and emission ratios, J. Geophys. Res., 113, D00C15, doi:10.1029/2008JD009845, 2008.
Cavalli, F., Facchini, M. C., Decesari, S., Emblico, L., Mircea, M., Jensen, N. R., and Fuzzi, S.: Size-segregated aerosol chemical composition at a boreal site in southern Finland, dur-ing the QUEST project, Atmos. Chem. Phys., 6, 993–1002, doi:10.5194/acp-6-993-2006, 2006.
Cheng, Y., He, K. B., Duan, F. K., Zheng, M., Ma, Y. L., and Tan, J. H.: Positive sampling artifact of carbonaceous aerosols and its influence on the thermal-optical split of OC/EC, Atmos. Chem. Phys., 9, 7243–7256, doi:10.5194/acp-9-7243-2009, 2009. Claeys, M., Graham, B., Vas, G., Wang, W., Vermeylen, R.,
Pashynska, V., Cafmeyer, J., Guyon, P., Andreae, M. O., Ar-taxo, P., and Maenhaut, W.: Formation of Secondary Organic Aerosols Through Photooxidation of Isoprene, Science, 303, 1173, doi:10.1126/science.1092805, 2004.
Crosier, J., Jimenez, J. L., Allan, J. D., Bower, K. N, Williams, P. I., Alfarra, M. R., Canagaratna, M. R, Jayne, J. T., Worsnop, D. R, and Coe, H.: Technical Note: Description and Use of the New Jump Mass Spectrum Mode of Operation for the Aerodyne Quadrupole Aerosol Mass Spectrometers (Q-AMS), Aerosol Sci. Tech., 41, 865–872, 2007.
Cross, E. S., Slowik, J. G., Davidovits, P., Allan, J. D., Worsnop, D. R., Jayne, J. T., Lewis, D. K., Canagaratna, M., and Onasch, T. B.: Laboratory and ambient particle density determinations using light scattering in conjunction with aerosol mass spectrometry, Aerosol Sci. Tech., 41, 343–359, 2007
De Gouw, J. and Jimenez, J. L.: Organic Aerosols in the Earth’s Atmosphere, Environ. Sci. Technol., 43, 7614–7618, 2009. DeCarlo, P. F., Kimmel, J. R., Trimborn, A., Northway, M. J., Jayne,
J. T., Aiken, A. C., Gonin, M., Fuhrer, K., Horvath, T., Docherty, K. S., Worsnop, D. R., and Jimenez, J. L.: Field-deployable, high-resolution, time-of-flight aerosol mass spectrometer, Anal. Chem., 78, 8281–8289, 2006.
Decesari, S., Facchini, M. C., and Fuzzi, S.: Characterization of water-soluble organic compounds in atmospheric aerosols: a new approach, J. Geophys. Res., 105, 1481–1489, 2000.
Decesari, S., Mircea, M., Cavalli, F., Fuzzi, S., Moretti, F., Tagli-avini, E., and Facchini, M. C.: Source attribution of water-soluble organic aerosol by nuclear magnetic resonance spec-troscopy, Environ. Sci. Technol., 41, 2479–2484, 2007. Decesari, S., Finessi, E., Rinaldi, M., Paglione, M., Fuzzi, S.,
M. C.: Primary and secondary marine organic aerosols over the North Atlantic Ocean during the MAP experiment, J. Geophys. Res., 116, D22210, doi:10.1029/2011JD016204, 2011.
Facchini, M. C., Decesari, S., Rinaldi, M., Carbone, C., Finessi, E., Mircea, M., Fuzzi, S., Moretti, F., Tagliavini, E., Ceburnis, D., and O’Dowd, C. D.: An important source of marine secondary organic aerosol from biogenic amines, Environ. Sci. Technol., 42, 9116–9121, 2008.
Fine, P., Cass, G., and Simoneit, B. R. T.: Chemical characterization of fine particle emissions from the fireplace combustion of woods grown in the southern United States, Environ. Sci. Technol., 36, 1442–1451, 2002.
Fuzzi, S., Andreae, M. O., Huebert, B. J., Kulmala, M., Bond, T. C., Boy, M., Doherty, S. J., Guenther, A., Kanakidou, M., Kawamura, K., Kerminen, V.-M., Lohmann, U., Russell, L. M., and P¨oschl, U.: Critical assessment of the current state of scien-tific knowledge, terminology, and research needs concerning the role of organic aerosols in the atmosphere, climate, and global change, Atmos. Chem. Phys., 6, 2017–2038, doi:10.5194/acp-6-2017-2006, 2006.
Gallego, E., Roca, X., Perales, J. F., and Guardino, X.: Determining indoor air quality and identifying the origin of odour episodes in indoor environments, J. Environ. Sci., 21, 333–339, 2009. Gelencser, A., Hoffer, A., Molnar, A., Krivacsy, Z., Kiss, G.,
and Meszaros, E.: Thermal behaviour of carbonaceous aerosol from continental background site, Atmos. Environ., 34, 823–831, 2000.
Goldstein, A. H. and Galbally, I. E.: Known and unexplored organic constituents in the earth’s atmosphere, Environ. Sci. Technol., 41, 1514–1521, 2007.
Guenther, A., Hewitt, C. N., Erickson, D., Fall, R., Geron, C., Gredel, T., Harley, P., Klinger, L., Lerdau, M., Mckay, W. A., Pierce, T., Scholes, B., Steinbrecher, R., Tallamraju, R., Taylor, J., and Zimmerman, P.: A global model of natural volatile or-ganic compound emissions, J. Geophys. Res., 100, 8873–8892, doi:10.1029/94JD02950, 1995.
Hallquist, M., Wenger, J. C., Baltensperger, U., Rudich, Y., Simp-son, D., Claeys, M., Dommen, J., Donahue, N. M., George, C., Goldstein, A. H., Hamilton, J. F., Herrmann, H., Hoff-mann, T., Iinuma, Y., Jang, M., Jenkin, M. E., Jimenez, J. L., Kiendler-Scharr, A., Maenhaut, W., McFiggans, G., Mentel, Th. F., Monod, A., Pr´evˆot, A. S. H., Seinfeld, J. H., Surratt, J. D., Szmigielski, R., and Wildt, J.: The formation, properties and impact of secondary organic aerosol: current and emerging is-sues, Atmos. Chem. Phys., 9, 5155–5236, doi:10.5194/acp-9-5155-2009, 2009.
Hari, P. and Kulmala, M.: Station for Measuring Ecosystem– Atmosphere Relations (SMEAR II), Boreal Environ. Res., 10, 315–322, 2005.
IPCC, Climate Change 2007: The Physical Science Basis, Cam-bridge University Press, CamCam-bridge, 2007.
Jayne, J., Leard, D., Zhang, X., Davidovits, P., Smith, K., Kolb, C., and Worsnop, D.: Development of an aerosol mass spectrometer for size and composition analysis of submicron particles, Aerosol Sci. Tech., 33, 49–70, 2000.
Jimenez, J., Jayne, J., Shi, Q., Kolb, C., Worsnop, D., Yourshaw, I., Seinfeld, J., Flagan, R., Zhang, X., Smith, K., Morris, J., and Davidovits, P.: Ambient aerosol sampling using the Aero-dyne Aerosol Mass Spectrometer, J. Geophys. Res., 108, 8425,
doi:10.1029/2001JD001213, 2003.
Jimenez, J. L., Canagaratna, M. R., Donahue, N. M., Pr´evˆot, A. S. H., Zhang, Q., Kroll, J. H., DeCarlo, P. F., Allan, J. D., Coe, H., Ng, N. L., Aiken, A. C., Docherty, K. S., Ulbrich, I. M., Grieshop, A. P., Robinson, A. L., Duplissy, J., Smith, J. D., Wil-son, K. R., Lanz, V. A., Hueglin, C., Sun, Y. L., Tian, J., Laak-sonen, A., Raatikainen, T., Rautiainen, J., Vaattovaara, P., Ehn, M., Kulmala, M., Tomlinson, J. M., Collins, D. R., Cubison, M. J., Dunlea, E. J., Huffman, J. A., Onasch, T. B., Alfarra, M. R., Williams, P. I., Bower, K., Kondo, Y., Schneider, J., Drewnick, F., Borrmann, S., Weimer, S., Demerjian, K., Salcedo, D., Cot-trell, L., Griffin, R., Takami, A., Miyoshi, T., Hatakeyama, S., Shimono, A., Sun, J. Y., Zhang, Y. M., Dzepina, K., Kimmel, J. R., Sueper, D., Jayne, J. T., Herndon, S. C., Trimborn, A. M., Williams, L. R., Wood, E. C., Middlebrook, A. M., Kolb, C. E., Baltensperger, U., and Worsnop, D. R.: Evolution of organic aerosols in the atmosphere, Science, 326, 1525–1529, 2009. Johnson, D., Jenkin, M. E., Wirtz, K., and Martin-Reviejo, M.:
Sim-ulating the formation of secondary organic aerosol from the pho-tooxidation of aromatic hydrocarbons, Environ. Chem., 2, 35– 48, 2005.
Kanakidou, M., Seinfeld, J. H., Pandis, S. N., Barnes, I., Dentener, F. J., Facchini, M. C., Van Dingenen, R., Ervens, B., Nenes, A., Nielsen, C. J., Swietlicki, E., Putaud, J. P., Balkanski, Y., Fuzzi, S., Horth, J., Moortgat, G. K., Winterhalter, R., Myhre, C. E. L., Tsigaridis, K., Vignati, E., Stephanou, E. G., and Wilson, J.: Organic aerosol and global climate modelling: a review, At-mos. Chem. Phys., 5, 1053–1123, doi:10.5194/acp-5-1053-2005, 2005.
Kerminen, V.-M., Pet¨aj¨a, T., Manninen, H. E., Paasonen, P., Niem-inen, T., Sipil¨a, M., JunnNiem-inen, H., Ehn, M., Gagn´e, S., Laakso, L., Riipinen, I., Vehkam¨aki, H., Kurten, T., Ortega, I. K., Dal Maso, M., Brus, D., Hyv¨arinen, A., Lihavainen, H., Lepp¨a, J., Lehtinen, K. E. J., Mirme, A., Mirme, S., H˜orrak, U., Berndt, T., Stratmann, F., Birmili, W., Wiedensohler, A., Metzger, A., Dom-men, J., Baltensperger, U., Kiendler-Scharr, A., Mentel, T. F., Wildt, J., Winkler, P. M., Wagner, P. E., Petzold, A., Minikin, A., Plass-D¨ulmer, C., P¨oschl, U., Laaksonen, A., and Kulmala, M.: Atmospheric nucleation: highlights of the EUCAARI project and future directions, Atmos. Chem. Phys., 10, 10829–10848, doi:10.5194/acp-10-10829-2010, 2010.
Kulmala, M., Asmi, A., Lappalainen, H. K., Carslaw, K. S., P¨oschl, U., Baltensperger, U., Hov, Ø., Brenquier, J.-L., Pandis, S. N., Facchini, M. C., Hansson, H.-C., Wiedensohler, A., and O’Dowd, C. D.: Introduction: European Integrated Project on Aerosol Cloud Climate and Air Quality interactions (EUCAARI) – integrating aerosol research from nano to global scales, At-mos. Chem. Phys., 9, 2825–2841, doi:10.5194/acp-9-2825-2009, 2009.
Lanz, V. A., Alfarra, M. R., Baltensperger, U., Buchmann, B., Hueglin, C., and Pr´evˆot, A. S. H.: Source apportionment of submicron organic aerosols at an urban site by factor analyti-cal modelling of aerosol mass spectra, Atmos. Chem. Phys., 7, 1503–1522, doi:10.5194/acp-7-1503-2007, 2007.
Lin, C.-J.: Projected Gradient methods for Non-negative matrix fac-torization, Neural Comput., 19, 2756–2779, 2007.
Loo, B. W. and Cork, C. P.: Development of high efficiency virtual impactor, Aerosol Sci. Tech., 9, 167–170, 1988.
K., Thornton, D. C., Bandy, A. R., Clarke, A. D., Blake, D. R., Sachse, G. W., Fuelberg, H. E., Kiley, C. M., Woo, J.-H., Streets, D. G., and Carmichael, G. R.: Characteristics and in-fluence of biosmoke on the fine-particle ionic composition mea-sured in Asian outflow during the Transport and Chemical Evolu-tion Over the Pacific (TRACE-P) experiment, J. Geophys. Res., 108, 8816, doi:10.1029/2002JD003128, 2003.
Matthew, B. M., Middlebrook, A. M., and Onasch, T. B.: Collection efficiencies in an aerodyne aerosol mass spectrometer as a func-tion of particle phase for laboratory generated aerosols, Aerosol Sci. Tech., 42, 884–898, 2008.
Moretti, F., Tagliavini, E., Decesari, S., Facchini, M. C., Rinaldi, M., and Fuzzi, S.: NMR determination of total carbonyls and carboxyls: A tool for tracing the evolution of atmospheric oxi-dized organic aerosols, Environ. Sci. Technol., 42, 4844–4849, 2008.
Morgan, W. T., Allan, J. D., Bower, K. N., Highwood, E. J., Liu, D., McMeeking, G. R., Northway, M. J., Williams, P. I., Krejci, R., and Coe, H.: Airborne measurements of the spatial distribu-tion of aerosol chemical composidistribu-tion across Europe and evolu-tion of the organic fracevolu-tion, Atmos. Chem. Phys., 10, 4065–4083, doi:10.5194/acp-10-4065-2010, 2010.
Nemitz, E., Jimenez, J. L., Huffman, J. A., Ulbrich, I. M., Cana-garatna, M. R., Worsnop, D. R., and Guenther, A. B.: An Eddy-covariance System for the Measurement of Surface/Atmosphere Exchange Fluxes of Submicron Aerosol Chemical Species – First Application Above an Urban Area, Aerosol Sci. Tech., 42, 636– 657, 2008.
Ng, N. L., Chhabra, P. S., Chan, A. W. H., Surratt, J. D., Kroll, J. H., Kwan, A. J., McCabe, D. C., Wennberg, P. O., Sorooshian, A., Murphy, S. M., Dalleska, N. F., Flagan, R. C., and Seinfeld, J. H.: Effect of NOxlevel on secondary organic aerosol (SOA)
formation from the photooxidation of terpenes, Atmos. Chem. Phys., 7, 5159–5174, doi:10.5194/acp-7-5159-2007, 2007. Ng, N. L., Canagaratna, M. R., Zhang, Q., Jimenez, J. L., Tian,
J., Ulbrich, I. M., Kroll, J. H., Docherty, K. S., Chhabra, P. S., Bahreini, R., Murphy, S. M., Seinfeld, J. H., Hildebrandt, L., Donahue, N. M., DeCarlo, P. F., Lanz, V. A., Pr´ev˜ot, A. S. H., Dinar, E., Rudich, Y., and Worsnop, D. R.: Organic aerosol components observed in Northern Hemispheric datasets from Aerosol Mass Spectrometry, Atmos. Chem. Phys., 10, 4625– 4641, doi:10.5194/acp-10-4625-2010, 2010.
Orsini, D. A., Ma, Y., Sullivan, A., Sierau, B., Baumann, K., and Weber, R. J.: Refinements to the particle-into-liquid sampler (PILS) for ground and airborne measurements of water soluble aerosol composition, Atmos. Environ., 37, 1243–1259, 2003. Paatero, P.: Least squares formulation of robust non-negative factor
analysis, Chemometr. Intell. Lab., 37, 23–35, 1997.
Paatero, P.: The multilinear engine – A table-driven, least squares program for solving multilinear problems, including the n-way parallel factor analysis model, J. Comput. Graph. Stat., 8, 854– 888, 1999.
Paatero, P. and Tapper, U.: Positive matrix factorization: A non-negative factor model with optimal utilization of er-ror estimates of data values, Environmetrics, 5, 111–126, doi:10.1002/env.3170050203, 1994.
Paulot, F., Crounse, J. D., Kjaergaard, H. G., K¨urten, A., Clair, J. M. St., Seinfeld, J. H., and Wennberg, P. O.: Unexpected Epoxide Formation in the Gas-Phase Photooxidation of Isoprene, Science,
325, 5941, doi:10.1126/science.1172910, 2009.
Puxbaum, H., Caseiro, A., Sanchez-Ochoa, A., Kasper-Giebl, A., Claeys, M., Gelencser, A., Legrand, M., Preunkert, S., and Pio, C.: Levoglucosan levels at background sites in Europe for assessing the impact of biomass combustion on the Eu-ropean aerosol background, J. Geophys. Res., 112, D23S05, doi:10.1029/2006JD008114, 2007.
Raatikainen, T., Vaattovaara, P., Tiitta, P., Miettinen, P., Rauti-ainen, J., Ehn, M., Kulmala, M., Laaksonen, A., and Worsnop, D. R.: Physicochemical properties and origin of organic groups detected in boreal forest using an aerosol mass spectrometer, Atmos. Chem. Phys., 10, 2063–2077, doi:10.5194/acp-10-2063-2010, 2010.
Ravishankara, A. R.: Chemistry-climate coupling: the importance of chemistry in climate issues, Faraday Discuss., 130, 9–26, 2005.
Rickard, A. R., Wyche, K. P., Metzger, A., Monks, P. S., Ellis, A. M., Dommen, J., Baltensperger, U., Jenkin, M. E., and Pilling, M. J.: Gas phase precursors to anthro-pogenic secondary organic aerosol: Using the Master Chem-ical Mechanism to probe detailed observations of 1, 3, 5-trimethylbenzene photo-oxidation, Atmos. Environ., 44, 5423– 5433, doi:10.1016/j.atmosenv.2009.09.043, 2009.
Rinaldi, M., Emblico, L., Decesari, S., Fuzzi, S., Facchini, M. C., and Librando, V.: Chemical characterization and source appor-tionment of size-segregated aerosol collected at an urban site in Sicily, Water Air Soil Poll., 185, 311–321, doi:10.1007/s11270-007-9455-4, 2007.
Robinson, N. H., Hamilton, J. F., Allan, J. D., Langford, B., Oram, D. E., Chen, Q., Docherty, K., Farmer, D. K., Jimenez, J. L., Ward, M. W., Hewitt, C. N., Barley, M. H., Jenkin, M. E., Rickard, A. R., Martin, S. T., McFiggans, G., and Coe, H.: Evi-dence for a significant proportion of Secondary Organic Aerosol from isoprene above a maritime tropical forest, Atmos. Chem. Phys., 11, 1039–1050, doi:10.5194/acp-11-1039-2011, 2011. Russell, L.: Aerosol Organic-Mass-to-Organic-Carbon Ratio
Mea-surements, Environ. Sci. Technol., 37, 2982–2987, 2003. Russell, L., Bahadur, R., and Ziemann, P.: Identifying organic
aerosol sources by comparing functional group composition in chamber and atmospheric particles, P. Natl. Acad. Sci., 108, 3516–3521, 2011.
Schauer, J. J., Rogge, W. F., Hildemann, L. M., Mazurek, M. A., and Cass, G. R.: Source apportionment of airborne particulate matter using organic compounds as tracers, Atmos. Environ., 30, 3837–3855, 1996.
Schwartz, R. E., Russell, L. M., Sjostedt, S. J., Vlasenko, A., Slowik, J. G., Abbatt, J. P. D., Macdonald, A. M., Li, S. M., Lig-gio, J., Toom-Sauntry, D., and Leaitch, W. R.: Biogenic oxidized organic functional groups in aerosol particles from a mountain forest site and their similarities to laboratory chamber products, Atmos. Chem. Phys., 10, 5075–5088, doi:10.5194/acp-10-5075-2010, 2010.
Simpson, D., Yttri, K. E., Klimont, Z., Kupiainen, K., Caseiro, A., Gelencs´er, A., Pio, C., Puxbaum, H., and Legrand, M.: Modeling carbonaceous aerosol over Europe: Analysis of the CARBOSOL and EMEP EC/OC campaigns, J. Geophys. Res., 112, D23S14, doi:10.1029/2006JD008158, 2007.