Strategies for Tobacco Control in India: A
Systematic Review
Ailsa J. McKay1*, Raju K. K. Patel2, Azeem Majeed1
1Department of Primary Care and Public Health, Imperial College London, London, United Kingdom,
2London North West Healthcare NHS Trust, London, United Kingdom
Abstract
Background
Tobacco control needs in India are large and complex. Evaluation of outcomes to date has been limited.
Aim
To review the extent of tobacco control measures, and the outcomes of associated trialled interventions, in India.
Methods
Information was identified via database searches, journal hand-searches, reference and ci-tation searching, and contact with experts. Studies of any population resident in India were included. Studies where outcomes were not yet available, not directly related to tobacco use, or not specific to India, were excluded. Pre-tested proformas were used for data extrac-tion and quality assessment. Studies with reliability concerns were excluded from some as-pects of analysis. The Framework Convention on Tobacco Control (FCTC) was use as a framework for synthesis. Heterogeneity limited meta-analysis options. Synthesis was there-fore predominantly narrative.
Results
Additional to the Global Tobacco Surveillance System data, 80 studies were identified, 45 without reliability concerns. Most related to education (FCTC Article 12) and tobacco-use cessation (Article 14). They indicated widespread understanding of tobacco-related harm, but less knowledge about specific consequences of use. Healthcare professionals reported low confidence in cessation assistance, in keeping with low levels of training. Training for schoolteachers also appeared suboptimal. Educational and cessation assistance interven-tions demonstrated positive impact on tobacco use. Studies relating to smoke-free policies (Article 8), tobacco advertisements and availability (Articles 13 and 16) indicated increas-ingly widespread smoke-free policies, but persistence of high levels of SHS exposure, to-bacco promotions and availability—including to minors. Data relating to taxation/pricing and
OPEN ACCESS
Citation:McKay AJ, Patel RKK, Majeed A (2015) Strategies for Tobacco Control in India: A Systematic Review. PLoS ONE 10(4): e0122610. doi:10.1371/ journal.pone.0122610
Academic Editor:Lion Shahab, University College London, UNITED KINGDOM
Received:April 6, 2014
Accepted:February 21, 2015
Published:April 9, 2015
Copyright:© 2015 McKay et al. This is an open access article distributed under the terms of the
Creative Commons Attribution License, which permits unrestricted use, distribution, and reproduction in any medium, provided the original author and source are credited.
Funding:The Department of Primary Care & Public Health at Imperial College London is grateful for support from the NW London NIHR Collaboration for Leadership in Applied Health Research & Care (CLAHRC) and the Imperial NIHR Biomedical Research Centre. The views expressed in this publication are those of the authors. The funders had no role in study design, data collection and analysis, decision to publish, or preparation of the manuscript.
packaging (Articles 6 and 11) were limited. We did not identify any studies of product regula-tion, alternative employment strategies, or illicit trade (Articles 9, 10, 15 and 17).
Conclusions
Tobacco-use outcomes could be improved by school/community-based and adult educa-tion interveneduca-tions, and cessaeduca-tion assistance, facilitated by training for health professionals and schoolteachers. Additional tobacco control measures should be assessed.
Introduction
India is the second largest tobacco consumer, and third largest tobacco producer, in the world [1]. The current cost of tobacco use in India includes 1 million deaths per year (approximately 1/6 of all tobacco-related deaths worldwide), and billions of dollars of direct attributable health costs [2–4]. The problem is worsening, and by current trends, tobacco use will cause 13% of deaths in India by 2020 [4].
The variety of tobacco products used in India is greater than elsewhere, and associated with additional complications including a high burden of oral cancers from smokeless tobacco use [5]. The prevalences of diseases adversely affected by second hand smoke (SHS) exposure—in particular childhood respiratory infections and tuberculosis—are higher than in many parts of the world [6,7]. Various types of tobacco are grown in India; there are thousands of variously sized manufacturers regulated on several levels [8]; and there is a relatively large unregulated market [9]. The varied socio-cultural history and beliefs also has an impact, and there is com-plicated legislation addressing the various types of tobacco use, enforced to different extents at various administrative levels across the country [10].
programme, are not widely available [11]. Various aspects of this programme, and other con-trol measures, have featured in the eleventh (2007–2012) and twelfth (2012–2017) Government of India Five Year Plans [13,14]. In line with the current Five Year Plan, the current Govern-ment has increased taxes on cigarettes, and announced plans for further strengthening of anti-tobacco legislation following a period of review.
Although the extent of any specific programmes designed to monitor and evaluate these re-cent wide-ranging interventions is unclear, standardised collection of both clinical and process outcomes has been achieved via the MPOWER (Monitor tobacco use and prevention policies, Protect people from tobacco smoke, Offer help to quit tobacco use, Warn about the dangers of tobacco, Enforce bans on tobacco advertising, promotion and sponsorship, Raise taxes on to-bacco) and Global Tobacco Surveillance System (GTSS) frameworks, co-ordinated by the WHO and WHO/Centers for Disease Control and Prevention/Canadian Public Health Associ-ations, respectively [12,15]. Both collect data regarding tobacco use prevalence, advertising, mass media campaigns, warnings on tobacco packaging and cessation services. The MPOWER outcomes provide additional information about monitoring of tobacco use prevalence and tax-ation, and the GTSS additional information about SHS exposure, school policies, and health professional training, among other things.
Some relatively idiosyncratic aspects of the Indian tobacco picture limit the ease of interpre-tation of some of these data. For example, there is an emphasis on smoking and cigarettes, with less information relating to other forms of tobacco use. The MPOWER outcomes are also re-ported at the national level, which limits their applicability in a country where there is subna-tional regulation of federal legislation, and where smaller-scale NGO-run anti-tobacco programmes appear to have achieved considerable success in particular districts/states [e.g.
16,17]. This is a particular issue because implementation of federal legislation has been trouble-some—reportedly associated with a lack of awareness of the legislation, insufficient motivation, and workforce capacity challenges [e.g.11,18].
Additional barriers to implementation of India’s national tobacco control strategies have in-cluded legal challenges by the tobacco industry, use of surrogate advertising methods and viola-tions of some advertising regulaviola-tions [11,18]. Thus despite the encouraging ongoing drive to improve tobacco control in India via wide-reaching means, these challenges encountered, and the absence of systematic evaluation of policy changes to date, together with an apparent idio-syncratic responsiveness to interventions applied elsewhere [e.g.19,20], have resulted in ongo-ing uncertainty regardongo-ing the interventions likely to be most effective for India.
To help establish the extent of tobacco control in India, gauge the relative need for input into different aspects of control, and to establish so far as possible the extent to which different interventions in India have been successful, we performed a systematic review that aimed to answer the following questions:
1. To what extent are tobacco control measures evident in India?
2. Which tobacco control approaches implemented or trialled in India have been successful?
Methods
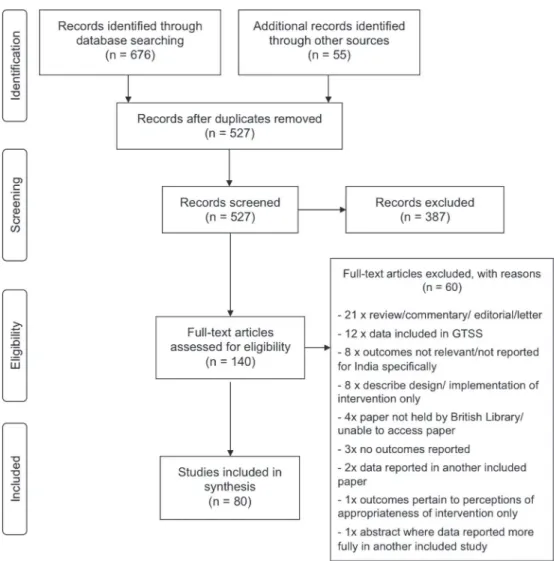
We followed the Preferred Reporting Items for Systematic Reviews and Meta-Analyses (PRISMA) Statement (seeS1 PRISMA ChecklistandFig 1) [21].
Ethical approval
Search
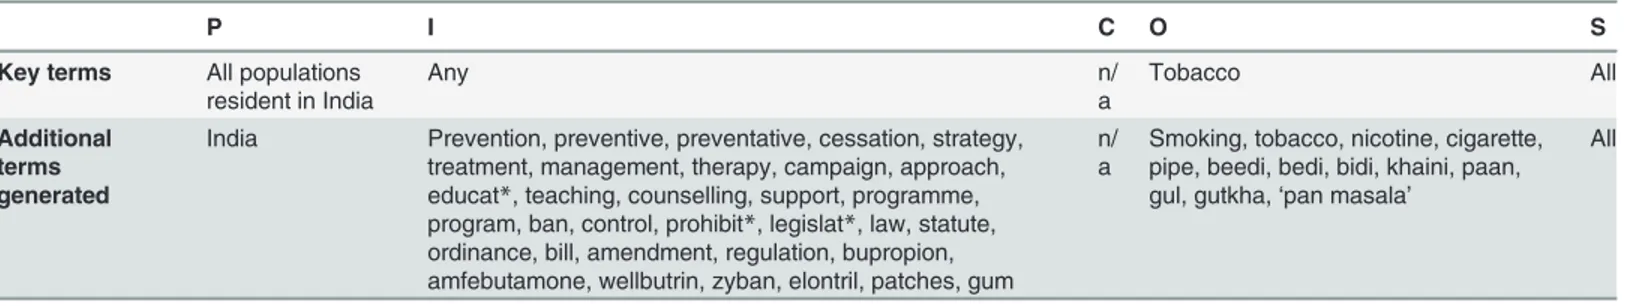
The review questions were used to formulate search terms (Table 1), and the search strategy was trialled to ensure that related well-cited articles and those identified in scoping searches would be returned. Adaptations were made where necessary, before final use. Databases (Med-line, Embase, CENTRAL, PsychINFO, ERIC, Web of Science and CINAHL) were searched, using the terms inTable 1, on 23/9/12 (updated on 28/2/13 and 11/8/13). Lung India, Tobacco Control and the Indian Journal of Public Health were hand-searched on 29/9/12 (searches up-dated 17/3/13 and 11/8/13). No restrictions by date, language of publication, study design, pub-lication type or pubpub-lication status, were made. Reference lists of relevant papers were scanned, and we contacted local experts with the aim of identifying additional/unpublished data. The relevant national level data from the GTSS available on 1/9/13, were also identified. GTSS data are collected via one of four constituent questionnaire-based surveys: the Global Adult Tobacco Survey (GATS), Global Youth Tobacco Survey (GYTS), Global Health Professions Student Sur-vey (GHPSS) or Global School Personnel SurSur-vey (GSPS) [15].
Fig 1. Flow chart demonstrating handling of papers returned by search.Chart adapted from: Moher D, et al21
Selection
We included studies of any population resident in India, any form of tobacco use, any type of intervention and any process or clinical outcome measure. Indeed the outcomes monitored were of interestper se. Studies that were descriptions of interventions not yet implemented or currently in trial, or of methods for intervention development, were excluded. Those where outcomes were not directly related to tobacco use, not specific to India, or limited to perceived appropriateness of interventions, were also excluded. We did not include commentaries, news articles, reviews, letters, or other opinion pieces unless new syntheses were included, and did not include studies where the contained data were reported in entirety in another included study. Studies reporting data collected for the GTSS were only included if the data were not al-ready available as part of the national GTSS results for India, to avoid inclusion of data in replicate.
One reviewer initially assessed study eligibility by screening titles/abstracts. Studies accepted at this point were reviewed more fully, and any further exclusions again made according to the above criteria. All remaining studies progressed to data extraction.
Data extraction
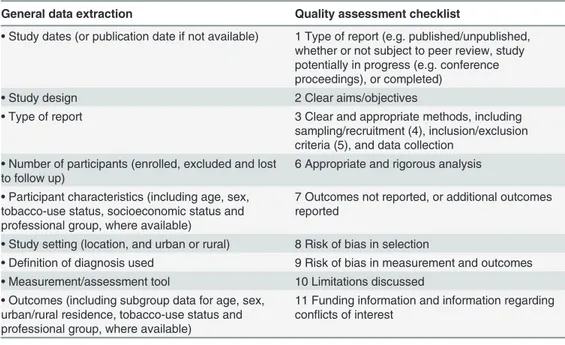
Basic study data were extracted using a proforma based on the checklist recommended by the Centre for Reviews and Dissemination, York [22]. It was pre-tested on a subset of papers, and changes made as necessary before final use. The broad headings under which data were collect-ed are listcollect-ed inTable 2. One reviewer used the proforma for initial data collection. A second re-viewer checked the collected data, and any discrepancies were resolved by re-referral to the study and consensus decision.
Quality assessment
Data for quality assessment were extracted using a second proforma. Our quality checklist in-cludes the‘component ratings’of the Effective Public Health Practice Project Quality Assess-ment Tool [23] and bias assessment recommended by the Cochrane Handbook [24]. Again the proforma was pre-tested before use. Data were independently collected by two reviewers, who then independently rated each quality domain (as listed inTable 2) as‘satisfactory’,‘not satis-factory’, or‘not assessable’. The main reasons for any concern about reliability of results were also noted. Inconsistencies in ratings were resolved by consensus decision (initial kappa agree-ment (standard error) = 0.86 (0.06)). Where the number of‘unsatisfactory’/‘not-assessable’
Table 1. Search terms.
P I C O S
Key terms All populations resident in India
Any n/
a
Tobacco All
Additional terms generated
India Prevention, preventive, preventative, cessation, strategy, treatment, management, therapy, campaign, approach, educat*, teaching, counselling, support, programme, program, ban, control, prohibit*, legislat*, law, statute, ordinance, bill, amendment, regulation, bupropion, amfebutamone, wellbutrin, zyban, elontril, patches, gum
n/ a
Smoking, tobacco, nicotine, cigarette, pipe, beedi, bedi, bidi, khaini, paan, gul, gutkha,‘pan masala’
All
PICOS identifiers from research questions (‘key terms’) and database- and thesaurus- derived alternatives (‘additional terms’) used to generate database searches. Stars indicate where all database terms based on the attached stem were included. Terms within each column were distinguished using the OR function and the terms in differing columns combined using AND.
ratings exceeded eight, the study was omitted from some aspects of analysis (see below) due to concerns about the reliability of reported outcomes. Where the number of‘unsatisfactory’/
‘not-assessable’ratings fell between six and eight the main concerns about the study were con-sidered and independent decisions about inclusion/exclusion made by two reviewers. An inde-pendent decision from a third reviewer was sought in cases of disagreement.
Data synthesis
An initial assessment of the number of studies identified, and time-trends in production and quality, was made. The studies were then divided into two subsets for further analysis:
1. Studies describing the extent of tobacco control measures in India
2. Studies relating to trialled interventions
In view of the heterogeneity in study design and outcomes investigated in both categories, a narrative synthesis was initially undertaken. Summaries of both sets of data were produced—
by subcategories corresponding to the articles of the FCTC. Where the articles pertained to a broad range of studies (articles 12 and 14), studies were grouped by theme: population impli-cated (young people/adults/healthcare professionals) in the case of Article 12; population sur-veyed (healthcare professionals, trainees, and patients) in the case of Article 14.
The nature of study aims and outcomes were examined. Studies with identified reliability concerns were then excluded before assessment of outcomes and an examination of each cate-gory of studies to investigate the possibility of differences by subgroup (age, sex, urban/rural lo-cation, tobacco use status, or professional group, as applicable—all identifieda priori).
Proposals were formed based on general initial analysis outcomes, and inconsistencies examined.
Table 2. Data extraction and quality assessment checklists.
General data extraction Quality assessment checklist
•Study dates (or publication date if not available) 1 Type of report (e.g. published/unpublished, whether or not subject to peer review, study potentially in progress (e.g. conference proceedings), or completed)
•Study design 2 Clear aims/objectives
•Type of report 3 Clear and appropriate methods, including sampling/recruitment (4), inclusion/exclusion criteria (5), and data collection
•Number of participants (enrolled, excluded and lost to follow up)
6 Appropriate and rigorous analysis
•Participant characteristics (including age, sex, tobacco-use status, socioeconomic status and professional group, where available)
7 Outcomes not reported, or additional outcomes reported
•Study setting (location, and urban or rural) 8 Risk of bias in selection
•Definition of diagnosis used 9 Risk of bias in measurement and outcomes
•Measurement/assessment tool 10 Limitations discussed
•Outcomes (including subgroup data for age, sex, urban/rural residence, tobacco-use status and professional group, where available)
11 Funding information and information regarding conflicts of interest
The numbers beside the quality assessment criteria are used to indicate how quality for each criterion has been rated, in Tables4–7
The extent of clinical and methodological diversity limited the scope for meta-analysis of the studies of trialled interventions. Although three studies of similar school-based interven-tions were identified, different types of effect estimate were reported for each. We were there-fore unable to pool these, and we were unable to obtain the underlying data. The only other trial sub-category containing multiple studies pertained to non-pharmacological cessation in-terventions. Meta-analysis was performed using a random effect model, for unadjusted and ad-justed intention to treat data. Estimated summary odds ratios, confidence intervals and measures of heterogeneity were produced. Calculations were performed using RevMan version 5.3 (Copenhagen: The Nordic Cochrane Centre, The Cochrane Collaboration, 2014).
Results
Additional to the GTSS data, the search yielded 527 studies for review. The processing of search results is detailed inFig 1. Eighty studies were considered suitable for inclusion. Other than five studies from the late 1980s/early 1990s, all had been published since 2002, and half since 2010. The studies excluded from some aspects of synthesis due to reliability concerns (see
Methods), included 21/40 pre-2010, and 18/40 post-2009, studies. Some components of a fur-ther four studies (two pre-2010) were similarly excluded from some aspects of synthesis.
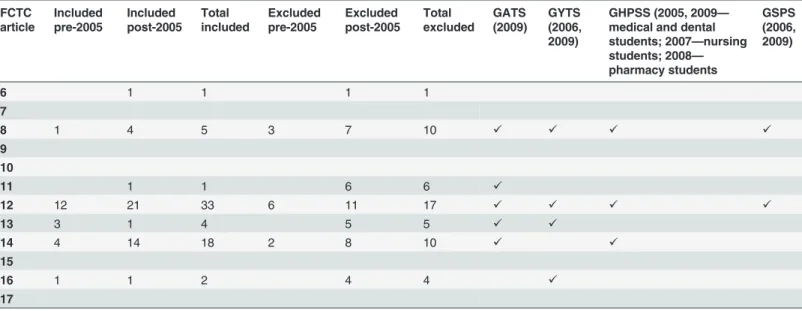
Among the studies identified, 56 described various aspects of tobacco control to date, and 25 the results of trialled interventions (one study achieved both).Table 3lists the articles of the FCTC relating to the reduction of demand and supply of tobacco, and the number of identified studies in each category (trial/non-trial) addressing each. The majority of studies pertained to articles 12 (10 trial and 38 non-trial studies) and 14 (10 trial, and 17 non-trial). Smaller num-bers of studies relating to articles 6, 8, 11, 13 and 16 were also identified. The studies included
Table 3. Summary of studies identified by FCTC Article.
FCTC article
Included pre-2005
Included post-2005
Total included
Excluded pre-2005
Excluded post-2005
Total excluded
GATS (2009)
GYTS (2006, 2009)
GHPSS (2005, 2009— medical and dental students; 2007—nursing students; 2008— pharmacy students
GSPS (2006, 2009)
6 1 1 1 1
7
8 1 4 5 3 7 10 ✓ ✓ ✓ ✓
9 10
11 1 1 6 6 ✓
12 12 21 33 6 11 17 ✓ ✓ ✓ ✓
13 3 1 4 5 5 ✓ ✓
14 4 14 18 2 8 10 ✓ ✓
15
16 1 1 2 4 4 ✓
17
The numbers of identified studies included and excluded from full analysis are displayed by FCTC Article. The number of studies performed before and after 2005 (year FCTC brought into force) are also shown. Studies that involved data collection both pre- and post- FCTC have been listed as‘post-2005’. Where the dates of the study were not reported, the‘pre-/post- 2005’designation was applied according to the date of publication. Five identified studies with outcomes that relate only to multiple articles of the FCTC are not included in the table. All were excluded from full analysis. The table also
demonstrates which articles of the FCTC the data collected for the Global Tobacco Surveillance System relate to, and the years in which these data were collected.
in all aspects of synthesis are summarised, by FCTC article, in Tables4to7(those excluded from analysis of outcomes summarised in Tables A to E inS1 File), and discussed further—by FCTC article—below.
Studies describing the extent of tobacco control measures
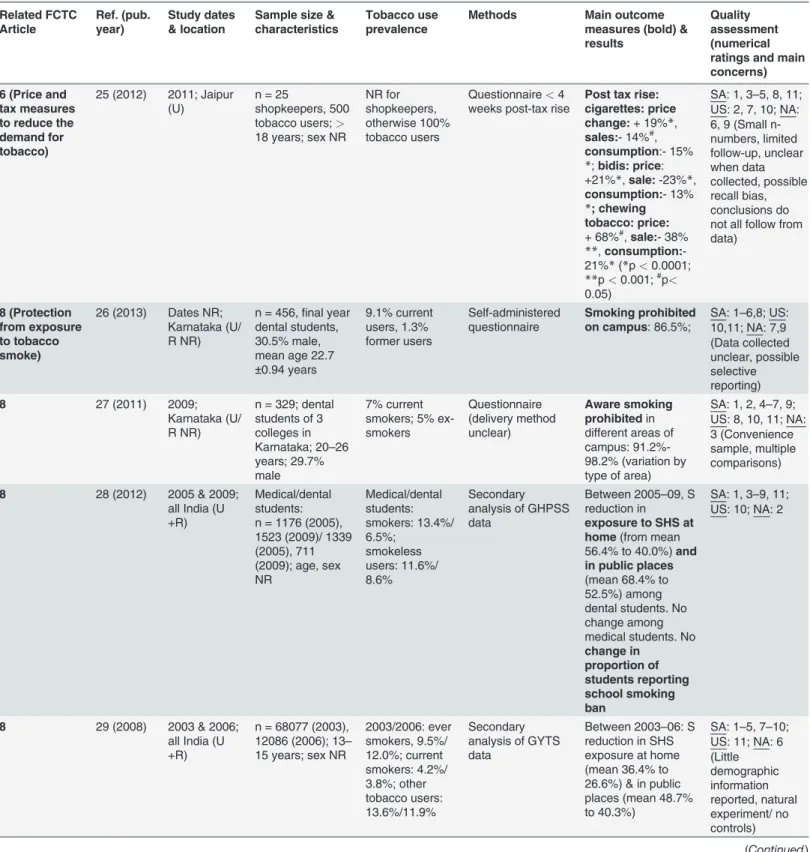
Article 6: Price and tax measures to reduce the demand for tobacco (Table 4). The one
identified study in this category suggested a 2011 increase in taxation had led to a reduction in self-reported tobacco sales and consumption at the short-term end-point (less than one month post-intervention) considered [25].
Article 8: Protection from exposure to tobacco smoke (Table 4). The five studies in this
category included in full analysis reported on prohibition of smoking on clinical campuses and SHS exposure. Data collection relied on self-reported outcomes. Four studies reported on smoking policy. In a 2004 study, 49.1% of doctors reported no local smoke-free policy [30]. Higher proportions of students (>85%) reported smoke-free policies on campus in two later
studies, both likely to have taken place post-implementation of FCTC [26,27]. However, in a secondary analysis of GHPSS data, no trend towards a wider extent of smoke-free policies (be-tween 2005 and 2009) was observed (40.8% in 2006 and 2009 reported for medical schools; for dental schools: 67.6% in 2009, 72.6% in 2006) [15,28]. According to the GSPS, 68.7 and 65.2% of school personnel reported school policies against student and staff tobacco use, respectively, in 2009 (66.9 and 57.1% in 2006) [15].
Two secondary analyses of GTSS data reported on recent trends in SHS exposure among school students and medical/dental students. One suggested SHS exposure had declined among dental, but not medical, students between 2005 and 2009 [28]. GHPSS data indicate that most medical and dental students are nevertheless still exposed to SHS, particularly in public places (52.5% of dental students and 71.4% of medical students exposed in 2009) [15]. Exposure among nursing students (50.8% in 2007) and pharmacy students (55.0% in 2008), was similar. The second study suggested that SHS exposure declined among young people be-tween 2003 and 2006 (from 36.4% to 26.6% at home, 48.7% to 40.3% in public places) [29]. Up-dated GYTS data suggest this downward trend continues, but that SHS exposure among young people is still widespread and more common in public places than at home [15]. In contrast, among adults, exposure at home (40%) is more common than exposure at work (29.9%) and in public places (5.4–17.5%; 2009 GATS) [15].
Article 11: Packaging and labelling of tobacco products (Table 4). The GATS data
(2009) indicate that 54.7% and 62.9% are aware of health warnings on cigarette and smokeless tobacco packaging, respectively [15]. One additional identified study (published 2011) demon-strated that although 25.6% of young people from tribal villages were aware of warnings on to-bacco packaging, fewer (21.0% of those aware) could interpret these as intended [31].
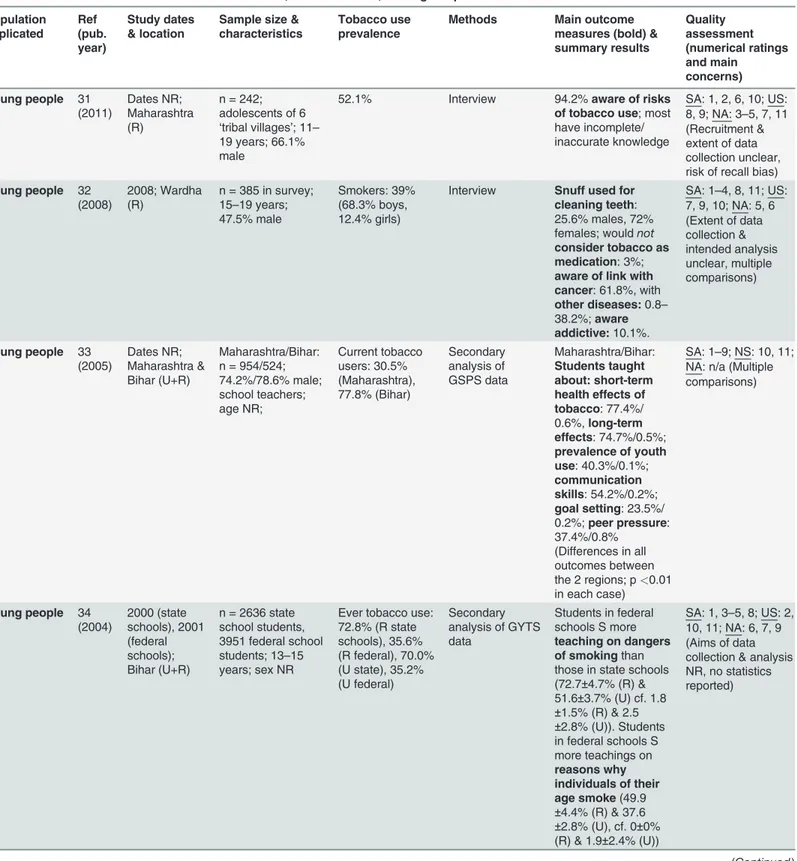
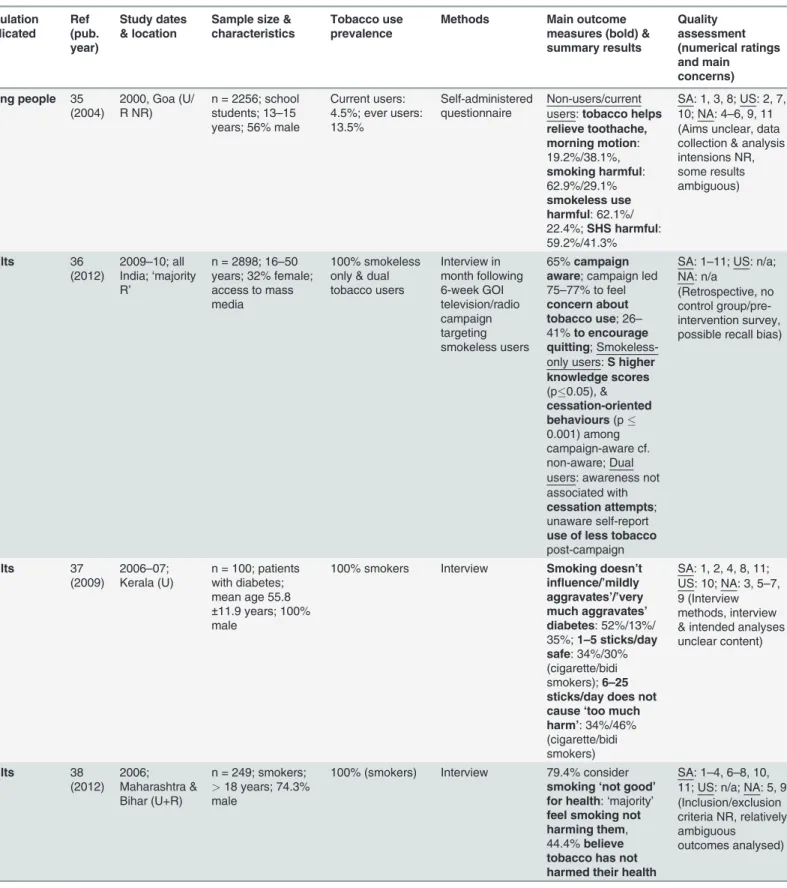
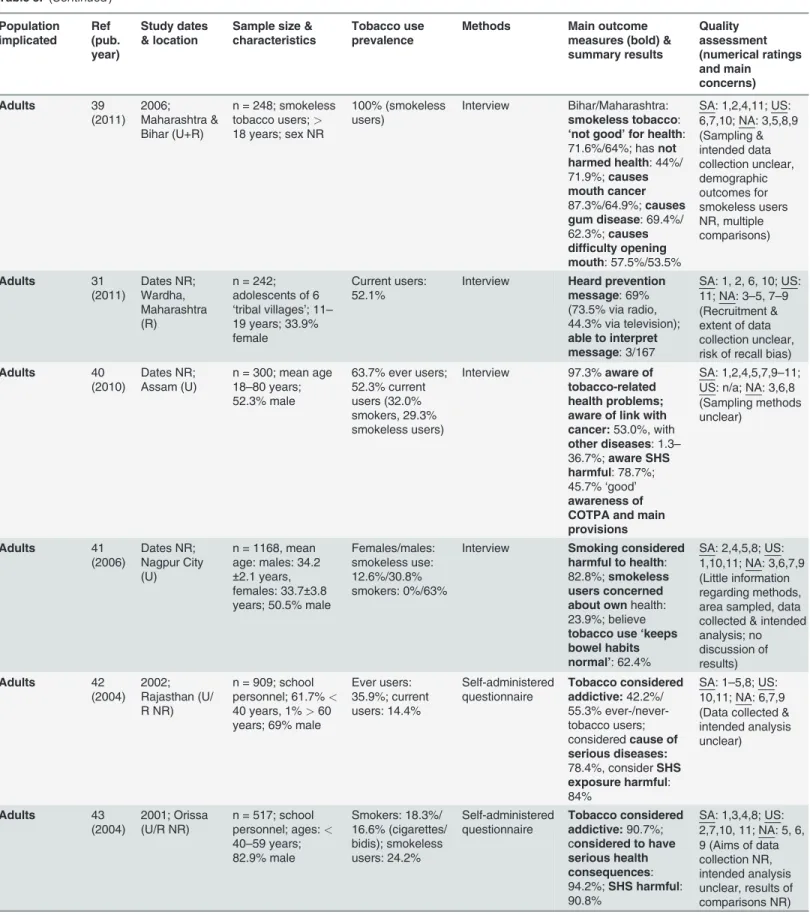
Article 12: Education, communication, training and public awareness (Table 5). Of the
studies in this category included in all aspects of analysis, five related to knowledge and educa-tion among young people, eleven to adult knowledge/educaeduca-tion, and ten to knowledge and training of healthcare professionals. All relied on self-reported outcomes. Outcomes investigat-ed includinvestigat-ed knowlinvestigat-edge of the consequences of tobacco use and SHS exposure, beliefs about me-dicinal uses of tobacco, and inclusion of tobacco in school and health professional
training curricula.
Table 4. Studies related to FCTC articles 6, 8, 11, 13 and 16. Related FCTC Article Ref. (pub. year) Study dates & location
Sample size & characteristics
Tobacco use prevalence
Methods Main outcome
measures (bold) & results
Quality assessment (numerical ratings and main concerns)
6 (Price and tax measures to reduce the demand for tobacco)
25 (2012) 2011; Jaipur (U)
n = 25
shopkeepers, 500 tobacco users;>
18 years; sex NR
NR for shopkeepers, otherwise 100% tobacco users
Questionnaire<4
weeks post-tax rise
Post tax rise: cigarettes: price change:+ 19%*,
sales:- 14%#, consumption:- 15%
*;bidis: price: +21%*,sale:-23%*,
consumption:- 13%
*; chewing tobacco: price:
+ 68%#,sale:- 38% **,consumption: -21%*(*p<0.0001; **p<0.001;#p<
0.05)
SA: 1, 3–5, 8, 11; US: 2, 7, 10; NA: 6, 9 (Small n-numbers, limited follow-up, unclear when data collected, possible recall bias, conclusions do not all follow from data)
8 (Protection from exposure to tobacco smoke)
26 (2013) Dates NR; Karnataka (U/ R NR)
n = 456,final year dental students, 30.5% male, mean age 22.7
±0.94 years
9.1% current users, 1.3% former users Self-administered questionnaire Smoking prohibited on campus: 86.5%;
SA: 1–6,8; US: 10,11; NA: 7,9 (Data collected unclear, possible selective reporting)
8 27 (2011) 2009;
Karnataka (U/ R NR)
n = 329; dental students of 3 colleges in Karnataka; 20–26 years; 29.7% male
7% current smokers; 5% ex-smokers Questionnaire (delivery method unclear) Aware smoking prohibitedin different areas of campus: 91.2%-98.2% (variation by type of area)
SA: 1, 2, 4–7, 9; US: 8, 10, 11; NA: 3 (Convenience sample, multiple comparisons)
8 28 (2012) 2005 & 2009; all India (U +R)
Medical/dental students: n = 1176 (2005), 1523 (2009)/ 1339 (2005), 711 (2009); age, sex NR Medical/dental students: smokers: 13.4%/ 6.5%; smokeless users: 11.6%/ 8.6% Secondary analysis of GHPSS data
Between 2005–09, S reduction in
exposure to SHS at home(from mean 56.4% to 40.0%)and in public places
(mean 68.4% to 52.5%) among dental students. No change among medical students. No
change in proportion of students reporting school smoking ban
SA: 1, 3–9, 11; US: 10; NA: 2
8 29 (2008) 2003 & 2006; all India (U +R)
n = 68077 (2003), 12086 (2006); 13–
15 years; sex NR
2003/2006: ever smokers, 9.5%/ 12.0%; current smokers: 4.2%/ 3.8%; other tobacco users: 13.6%/11.9% Secondary analysis of GYTS data
Between 2003–06: S reduction in SHS exposure at home (mean 36.4% to 26.6%) & in public places (mean 48.7% to 40.3%)
SA: 1–5, 7–10; US: 11; NA: 6 (Little demographic information reported, natural experiment/ no controls)
Table 4. (Continued) Related FCTC Article Ref. (pub. year) Study dates & location
Sample size & characteristics
Tobacco use prevalence
Methods Main outcome
measures (bold) & results
Quality assessment (numerical ratings and main concerns)
8 30 (2004) 2004; Bihar
(U/R NR)
n = 521 doctors; 55.3% GPs; 82% 25–55 years; 89.3% male
Cigarette smokers: 7%;
‘other tobacco users’:<1%;
`chewing/ applied product’
users: 11.7% Self-administered questionnaire Smoking prohibited across campus/in enclosed spaces/in public areas: 25.3%/10.8%/10.4%;
smoking permitted only in designated areas: 2.4%;no smoke-free policy: 49.1%
SA: 1, 3, 4, 8, 11; US: 2, 9, 10; NA: 5–7 (Aims unclear, data collected & analysis intentions NR, some reported outcomes ambiguous) 11 (Packaging and labelling of products)
31 (2011) Dates NR; Wardha, Maharashtra (R)
n = 242; adolescents of 6
‘tribal villages’; 11–19 years; 33.9% female
Current users: 52.1%
Interview Aware of warnings on packs:62/242;
able to interpret warnings: 20.97%
SA: 1, 2, 6, 10; US: 11; NA: 3–5, 7–9 (Recruitment & extent of data collection unclear, risk of recall bias)
13 (Tobacco advertising, promotion and sponsorship)
53 (2011) 2009; New Delhi (U)
n = 3956; school students; 12–16 years; 54.1% male
Ever use: 5.3% Self-administered questionnaire
Mean60% (31/59 items) of list of
movies depicting tobacco use viewed; 7.3%
owned tobacco branded item
SA: 1, 3–8, 10, 11; US: 2; NA: 9 (1/3 schools consented to participate, possible recall bias)
13 29 (2008) 2003 & 2006; all India (U +R)
n = 68077 (2003), 12086 (2006); 13–
15 years; sex NR
2003/2006: ever smokers, 9.5%/ 12.0%; current smokers: 4.2%/ 3.8%; other tobacco users: 13.6%/11.9% Secondary analysis of GYTS data
Between 2003–
2006: NS difference in exposure to advertisements, S increase free cigarette offers from tobacco companies (mean 8.0% in 2003, 11.2% in 2006)
SA: 1–5, 7–10; US: 11; NA: 6 (Little demographic information reported, natural experiment/no controls)
13 54 (2008) 2004; Delhi & Chennai (U)
n = 11642; school students; mean age 11.2 years (6thgraders), 12.9
years (8th graders); 54.9% male
NR Self-administered
questionnaire
Reported favourite advertisement: 493; recalled brand names:238; had
seen
advertisements in>4/1–4/none of places listed in survey:37%/50%/ 13.2%
SA: 1–4, 6–9, 11; US: 10; NA: 5 (Multiple comparisons, possible recall bias)
13 55 (2004) 2000; Bihar;
59.8% R
n = 2636 school students; 13–15 years; 76% male
Ever users: 71.8%; current users: 58.9% Self-administered questionnaire Gutka/cigarette advertisements in media seenby
‘almost all’;
SA: 1–5, 8; US: 10, 11; NA: 6, 7, 9 (Data collected & intended analysis unclear, some reported
and 59.2% [35]. In a more recent study (published 2011), 94.2% of‘tribal adolescents’were aware that tobacco is harmful [31]. A 2008 study suggested knowledge of specific risks was less common and varied from<1% (hypertension and heart disease) to 61.8% (cancer). 10% were
aware of tobacco’s addictive properties [32]. In the same study, 72% of females and 25.6% of males reported use of snuff for tooth cleaning and 97% accepted tobacco as a medication for abdominal pain or toothache.
Regarding school-based education, two secondary analyses of pre-FCTC GTSS data were identified. One demonstrated high variability in the teaching of knowledge/skills to prevent youth tobacco use, between two states [33]. The second suggested that students in federal schools recalled tobacco-related teaching more than those in state schools [34]. In the most re-cent GSPS (2009), 44.4% of staff reported the inclusion of tobacco use prevention in their school curriculum (cf. 42.0% in 2006), 10.1% of teachers had received relevant training (cf. 16.7% in 2006), and 37.8% had access to relevant materials (cf. 34.6% in 2006) [15]. In line with these outcomes, 2009 GYTS data suggest 63.3% of students receive teaching about tobac-co-related harms (cf. 54.4% in 2006) [15].
Regarding adult education, a study of a 2009–10 Government television/radio campaign showed that in the weeks after airing it was recalled by 65% of tobacco users, who generally considered it relevant [36]. This compares to the 36% and 15.1% reported to have recalled anti-cigarette messages from television and radio, respectively, in the 2009 GATS [15]. This addi-tionally reported on viewing of anti-cigarette information in newspapers/magazines (25.1%) and on billboards (21.5%). One further related study (published 2011) suggested 69% of‘tribal adolescents’had heard radio/television tobacco prevention messages, but only 1.8% of those exposed could interpret the messages as intended [31].
Nine studies of adult knowledge outcomes were identified. Four were studies of school per-sonnel (all published 2004). In these, the proportion of participants that considered tobacco Table 4. (Continued)
Related FCTC Article
Ref. (pub. year)
Study dates & location
Sample size & characteristics
Tobacco use prevalence
Methods Main outcome
measures (bold) & results
Quality assessment (numerical ratings and main concerns)
16 (Sale to and by minors)
29 (2008) 2003 & 2006; all India (U +R)
n = 68077 (2003), 12086 (2006); 13–
15 years; sex NR
2003/2006: ever smokers, 9.5%/ 12.0%; current smokers: 4.2%/ 3.8%; other tobacco users: 13.6%/11.9%
Secondary analysis of GYTS data
Between 2003–06: NS difference in proportion of users purchasing cigarettes in a store (mean 65.9% in 2003, 51.9% in 2006)
SA: 1–5, 7–10; US: 11; NA: 6 (Little demographic information reported, natural experiment/no controls)
16 55 (2004) 2000; Bihar;
59.8% R
n = 2636 school students; 13–15 years; 76% male
Ever users: 71.8%; current users: 58.9%
Self-administered questionnaire
Bought tobacco in store: 56.1%;not refused purchase due to age: 77.2%
SA: 1–5, 8; US: 10, 11; NA: 6, 7, 9 (Data collected & intended analysis unclear, some reported
outcomes unclear) Reviewed studies relating to FCTC articles 6, 8, 11, 13 and 16 included in all aspects of synthesis. The numbers following the different quality categories (SA, US, NA) indicate the aspect of quality assessment (seeTable 2) rated as satisfactory (SA), unsatisfactory (US) or not-assessable (NA). All studies were of cross sectional design, or secondary analyses of cross-sectional surveys. U = urban; R = rural; NR = not reported; GHPSS: Global Health Professions Student Survey; S = significant; NS = non-significant; SHS = second-hand smoke; GYTS = Global Youth Tobacco Survey
Table 5. Studies related to FCTC Article 12: Education, communication, training and public awareness. Population implicated Ref (pub. year) Study dates & location
Sample size & characteristics
Tobacco use prevalence
Methods Main outcome
measures (bold) & summary results Quality assessment (numerical ratings and main concerns)
Young people 31 (2011)
Dates NR; Maharashtra (R)
n = 242; adolescents of 6
‘tribal villages’; 11–
19 years; 66.1% male
52.1% Interview 94.2%aware of risks
of tobacco use; most have incomplete/ inaccurate knowledge
SA: 1, 2, 6, 10; US: 8, 9; NA: 3–5, 7, 11 (Recruitment & extent of data collection unclear, risk of recall bias)
Young people 32 (2008)
2008; Wardha (R)
n = 385 in survey; 15–19 years; 47.5% male
Smokers: 39% (68.3% boys, 12.4% girls)
Interview Snuff used for cleaning teeth: 25.6% males, 72% females; wouldnot
consider tobacco as medication: 3%;
aware of link with cancer: 61.8%, with
other diseases:0.8–
38.2%;aware addictive:10.1%.
SA: 1–4, 8, 11; US: 7, 9, 10; NA: 5, 6 (Extent of data collection & intended analysis unclear, multiple comparisons)
Young people 33 (2005)
Dates NR; Maharashtra & Bihar (U+R)
Maharashtra/Bihar: n = 954/524; 74.2%/78.6% male; school teachers; age NR; Current tobacco users: 30.5% (Maharashtra), 77.8% (Bihar) Secondary analysis of GSPS data Maharashtra/Bihar: Students taught about: short-term health effects of tobacco: 77.4%/ 0.6%,long-term effects: 74.7%/0.5%;
prevalence of youth use: 40.3%/0.1%;
communication skills: 54.2%/0.2%;
goal setting: 23.5%/ 0.2%;peer pressure: 37.4%/0.8%
(Differences in all outcomes between the 2 regions; p<0.01
in each case)
SA: 1–9; NS: 10, 11; NA: n/a (Multiple comparisons)
Young people 34 (2004) 2000 (state schools), 2001 (federal schools); Bihar (U+R)
n = 2636 state school students, 3951 federal school students; 13–15 years; sex NR
Ever tobacco use: 72.8% (R state schools), 35.6% (R federal), 70.0% (U state), 35.2% (U federal)
Secondary analysis of GYTS data
Students in federal schools S more
teaching on dangers of smokingthan those in state schools (72.7±4.7% (R) &
51.6±3.7% (U) cf. 1.8 ±1.5% (R) & 2.5
±2.8% (U)). Students in federal schools S more teachings on
reasons why individuals of their age smoke(49.9
±4.4% (R) & 37.6
±2.8% (U), cf. 0±0% (R) & 1.9±2.4% (U))
SA: 1, 3–5, 8; US: 2, 10, 11; NA: 6, 7, 9 (Aims of data collection & analysis NR, no statistics reported)
Table 5. (Continued)
Population implicated
Ref (pub. year)
Study dates & location
Sample size & characteristics
Tobacco use prevalence
Methods Main outcome
measures (bold) & summary results
Quality assessment (numerical ratings and main
concerns)
Young people 35 (2004)
2000, Goa (U/ R NR)
n = 2256; school students; 13–15 years; 56% male
Current users: 4.5%; ever users: 13.5%
Self-administered questionnaire
Non-users/current users:tobacco helps relieve toothache, morning motion: 19.2%/38.1%,
smoking harmful: 62.9%/29.1%
smokeless use harmful: 62.1%/ 22.4%;SHS harmful: 59.2%/41.3%
SA: 1, 3, 8; US: 2, 7, 10; NA: 4–6, 9, 11 (Aims unclear, data collection & analysis intensions NR, some results ambiguous)
Adults 36
(2012)
2009–10; all India;‘majority R’
n = 2898; 16–50 years; 32% female; access to mass media
100% smokeless only & dual tobacco users
Interview in month following 6-week GOI television/radio campaign targeting smokeless users
65%campaign aware; campaign led 75–77% to feel
concern about tobacco use; 26–
41%to encourage quitting; Smokeless-only users:S higher knowledge scores
(p0.05), &
cessation-oriented behaviours(p
0.001) among campaign-aware cf. non-aware; Dual users: awareness not associated with
cessation attempts; unaware self-report
use of less tobacco
post-campaign
SA: 1–11; US: n/a; NA: n/a
(Retrospective, no control group/pre-intervention survey, possible recall bias)
Adults 37
(2009)
2006–07; Kerala (U)
n = 100; patients with diabetes; mean age 55.8
±11.9 years; 100% male
100% smokers Interview Smoking doesn’t influence/’mildly aggravates’/’very much aggravates’ diabetes: 52%/13%/ 35%;1–5 sticks/day safe: 34%/30% (cigarette/bidi smokers);6–25 sticks/day does not cause‘too much harm’: 34%/46% (cigarette/bidi smokers)
SA: 1, 2, 4, 8, 11; US: 10; NA: 3, 5–7, 9 (Interview methods, interview & intended analyses unclear content)
Adults 38
(2012) 2006; Maharashtra & Bihar (U+R)
n = 249; smokers;
>18 years; 74.3%
male
100% (smokers) Interview 79.4% consider
smoking‘not good’ for health:‘majority’
feel smoking not harming them, 44.4%believe tobacco has not harmed their health
SA: 1–4, 6–8, 10, 11; US: n/a; NA: 5, 9 (Inclusion/exclusion criteria NR, relatively ambiguous
outcomes analysed)
Table 5. (Continued) Population implicated Ref (pub. year) Study dates & location
Sample size & characteristics
Tobacco use prevalence
Methods Main outcome
measures (bold) & summary results Quality assessment (numerical ratings and main concerns) Adults 39 (2011) 2006; Maharashtra & Bihar (U+R)
n = 248; smokeless tobacco users;>
18 years; sex NR
100% (smokeless users)
Interview Bihar/Maharashtra:
smokeless tobacco:
‘not good’for health: 71.6%/64%; hasnot harmed health: 44%/ 71.9%;causes mouth cancer
87.3%/64.9%;causes gum disease: 69.4%/ 62.3%;causes difficulty opening mouth: 57.5%/53.5%
SA: 1,2,4,11; US: 6,7,10; NA: 3,5,8,9 (Sampling & intended data collection unclear, demographic outcomes for smokeless users NR, multiple comparisons) Adults 31 (2011) Dates NR; Wardha, Maharashtra (R)
n = 242; adolescents of 6
‘tribal villages’; 11–
19 years; 33.9% female
Current users: 52.1%
Interview Heard prevention message: 69% (73.5% via radio, 44.3% via television);
able to interpret message: 3/167
SA: 1, 2, 6, 10; US: 11; NA: 3–5, 7–9 (Recruitment & extent of data collection unclear, risk of recall bias)
Adults 40
(2010)
Dates NR; Assam (U)
n = 300; mean age 18–80 years; 52.3% male
63.7% ever users; 52.3% current users (32.0% smokers, 29.3% smokeless users)
Interview 97.3%aware of tobacco-related health problems; aware of link with cancer:53.0%, with
other diseases: 1.3–
36.7%;aware SHS harmful: 78.7%; 45.7%‘good’
awareness of COTPA and main provisions
SA: 1,2,4,5,7,9–11; US: n/a; NA: 3,6,8 (Sampling methods unclear) Adults 41 (2006) Dates NR; Nagpur City (U)
n = 1168, mean age: males: 34.2
±2.1 years, females: 33.7±3.8 years; 50.5% male
Females/males: smokeless use: 12.6%/30.8% smokers: 0%/63%
Interview Smoking considered harmful to health: 82.8%;smokeless users concerned about ownhealth: 23.9%; believe
tobacco use‘keeps bowel habits normal’: 62.4%
SA: 2,4,5,8; US: 1,10,11; NA: 3,6,7,9 (Little information regarding methods, area sampled, data collected & intended analysis; no discussion of results) Adults 42 (2004) 2002; Rajasthan (U/ R NR)
n = 909; school personnel; 61.7%<
40 years, 1%>60
years; 69% male
Ever users: 35.9%; current users: 14.4% Self-administered questionnaire Tobacco considered addictive:42.2%/ 55.3% ever-/never-tobacco users; consideredcause of serious diseases:
78.4%, considerSHS exposure harmful: 84%
SA: 1–5,8; US: 10,11; NA: 6,7,9 (Data collected & intended analysis unclear) Adults 43 (2004) 2001; Orissa (U/R NR)
n = 517; school personnel; ages:<
40–59 years; 82.9% male Smokers: 18.3%/ 16.6% (cigarettes/ bidis); smokeless users: 24.2% Self-administered questionnaire Tobacco considered addictive:90.7%; considered to have serious health consequences: 94.2%;SHS harmful: 90.8%
SA: 1,3,4,8; US: 2,7,10, 11; NA: 5, 6, 9 (Aims of data collection NR, intended analysis unclear, results of comparisons NR)
Table 5. (Continued) Population implicated Ref (pub. year) Study dates & location
Sample size & characteristics
Tobacco use prevalence
Methods Main outcome
measures (bold) & summary results Quality assessment (numerical ratings and main concerns) Adults 44 (2004) 2001; West Bengal (U/R NR)
n = 663; school personnel;<40
to>60 years;
68.5% male Smokers: 30.9%; smokeless users: 13.1% Self-administered questionnaire Tobacco considered addictive:88.6%;
considered to have serious health consequences: 88.6%;SHS harmful: 92.3%
SA: 1,3,4,8; US: 2,7,10, 11; NA: 5, 6, 9 (Aims of data collection NR, intended analysis unclear) Adults 45 (2004) 2001; Uttar Pradesh (UP) & Uttaranchal (Ut) (U/R NR)
n = 993 (UP); 705 (Ut); school personnel;<40– >60 years; UP 92%
male, Ut 84.1% male UP/Ut: smokers: 27.3%/23.7% cigarettes, 17.5%/ 13.1% bidis; smokeless users: 21.9%/29.2% Self-administered questionnaire UP/Ut:Tobacco considered addictive:84.5%/ 69%;considered to have serious health consequences: 88.9%/66.4%;SHS harmful: 88.5%/ 70.6%
SA:1,3,4,8; US: 2,7,10, 11; NA: 5, 6, 9 (Aims of data collection & intended analysis unclear) Healthcare professionals 46 (2013)
2011–12; Thrissur (U)
n = 637, age & sex NR; dental students
NR Self-administered
questionnaire
97.6%aware of link with oral cancer, 45.1%of link with implant failure
SA: 1–3,6,7,9,10; US: 4,8,11; NA: 5 (Convenience sample, inclusion/ exclusion criteria NR) Healthcare professionals 47 (2013) 2011; Andhra Pradesh (AP) & Gujarat (‘primarily R’)
n = 238; 82.2% GPs, 17.8% alternative health practitioners; Gujarat/AP: mean ages: 32.2±7.7/
36.4±8 years; 79.6%/63.1% male
Ever users: 10.4%; current users: 3.9%
Interview Knowledge of effective
counselling: 92.2%;
knowledge of NRT: 66.1%;sufficient background to provide cessation services: 17%
SA: 1–5,8,11; US: 7,10; NA: 6,9 (Limited information regarding analysis) Healthcare professionals 48 (2013)
2009–10; Kerala & Karnataka (U/ R NR)
Medical faculty/ students: n = 713/ 2585; mean age 32.9±9.7/20.3±1.7
years, 59%/47.7% male
28% faculty, 26% students ever smokers
(a) curriculum review; (b) self-administered questionnaire
Curriculum review: tobacco not mandated part of any curriculum; information delivered not systematic/ sufficient; Student survey: tobacco-related teachingin class: 64%; teaching
‘minimal’& not examined; agreeno safe level of smoking: 54%; Faculty survey: agree
no safe level of smoking: 89%;
sufficient experience to aid cessation:20%
SA: 1–8, 10, 11; US: n/a; NA: 9 (College selection, analysis intentions & classification of some variables unclear) Healthcare professionals 26 (2013) Dates NR; Karnataka (U/ R NR)
n = 456,final year dental students, 30.5% male, mean age 22.7±0.94 years 9.1% current users, 1.3% former users Self-administered questionnaire Received teaching regarding link with cancer: 100%
SA: 1–6,8; US: 10,11; NA: 7,9 (Data collected unclear, possible selective reporting)
Table 5. (Continued) Population implicated Ref (pub. year) Study dates & location
Sample size & characteristics
Tobacco use prevalence
Methods Main outcome
measures (bold) & summary results Quality assessment (numerical ratings and main concerns) Healthcare professionals 27 (2011) 2009; Karnataka (U/ R NR)
n = 329; dental students of 3 colleges in Karnataka; 20–26 years; 29.7% male
7% current smokers; 5% ex-smokers
Questionnaire (delivery method unclear)
Received teaching regarding link with cancer: 97.2%
SA: 1, 2, 4–7, 9; US: 8, 10, 11; NA: 3 (Convenience sample, multiple comparisons) Healthcare professionals 49 (2011) 2007; Bangalore (U)
n = 76; clinical residents; mean age 28±2.9 years;
68% male
NR Self-administered
questionnaire
>2/3unaware of smoking prevalence in India, 20% suggest
tobacco use not linked to stroke, 25%not aware of NRT; 25%
considered tobacco use a permissible 'fun activity' not to intervene with
SA: 1–4,7–10, 11; US: n/a; NA: 5, 6 (Small n-number, questionnaire components NR) Healthcare professionals 30 (2004) 2004; Bihar (U/R NR)
n = 521 doctors; 55.3% GPs; 82% 25–55 years; 89.3% male
Cigarette smokers: 7%;
‘other tobacco users’:<1%;
`chewing/applied products’: 11.7%
Self-administered questionnaire
Tobacco use not considered safe in any form/amount:
90.4%
SA: 1,3,4,8,11; US: 2,9,10; NA: 5–7 (Aims unclear, data collected & analysis intentions NR, some reported outcomes ambiguous) Healthcare professionals 50 (2009) 2003; Kerala (U & semi-U)
n = 110 male faculty, 154 male doctors, 75 female doctors; mean age 42.2±7.7 years
63.1% never smokers Self-administered questionnaire 5cigarettes/day considered harmful
by faculty and female doctors, 3 by male doctors;
smoking>6/day harmful: 1/4 faculty, 1/3 doctors;1/day harmful: 42% faculty, 68% male doctors, 17% female doctors
SA: 1–4, 8; US: 7, 9–11; NA: 5,6 (Extent of data collection & analysis unclear, low participation rates in some groups) Healthcare professionals 51 (1995) Dates NR; Punjab (U &
‘semi-U’)
n = 106; private GPs; age NR; 90.6% male
7.5% smokers Self-administered questionnaire
11.3%aware of cessation clinics, 9.4%aware of low tar cigarettes, 5.7%
aware of nicotine gum
SA: 1–4, 8; US: 9–11; NA: 5–7 (Data collection methods & data collected NR, no analysis reported) Healthcare professionals 52 (1991) Dates NR; Mumbai (U)
n = 363; GPs; age NR; 85.4% male
Smokers: 7.7%; smokeless users: 8.7% Self-administered questionnaire 97%considered smoking and chewing harmful; 15%considered bidis less harmful,
15%more harmful, than cigarettes
SA: 1–4, 8; US: 7, 9–11; NA: 5,6 (Data collection methods, data collected & intended analysis unclear)
Reviewed studies relating to FCTC Article 12 included in all aspects of synthesis, sub-categorised by population implicated. The numbers following the different quality categories (SA, US, NA) indicate the aspect of quality assessment (seeTable 2), rated as satisfactory (SA), unsatisfactory (US) or not-assessable (NA). All studies were of cross-sectional design, or secondary analyses of cross-sectional surveys. NR = not reported; U = urban; R = rural; NR = not reported; GSPS = Global School Personnel Survey; GYTS = Global Youth Tobacco Survey; S: significant; NS: non-significant; SHS = second hand smoke; COTPA: Cigarettes and Other Tobacco Products Act; GOI = Government of India; GP = general practitioner; NRT = nicotine
replacement therapy
harmful (66.4%, 78.4%, 88.6%, 88.9% and 94.2%), to be addictive (84.5%, 88.6%, 90.7%) and to be harmful via SHS exposure (88.5%, 90.8%, 92.3%), were reasonably high [42–45]. Many oth-ers (79.4% of a smoking population, 82.8% and 97.3% of general populations, and 71.6% and 64% of smokeless tobacco-using populations)—all likely to have been surveyed post-FCTC—
also considered tobacco use harmful [38–41]. However, fewer considered it harmful to them-selves specifically, and some considered particular levels of smoking safe [37–39]. As among young people, there was also a lower appreciation of specific health effects, and an indication that tobacco use was considered to have some positive effects [37,40,41]. The 2009 GATS data are generally consistent with these outcomes (90.2%, 88.8% and 82.9% reported smoking, smokeless tobacco use and SHS exposure to be harmful, respectively), and as in all other studies reviewed, the link between tobacco use and cancer was more commonly appreciated than links with other diseases (e.g. 84.9% appreciated the link with lung cancer, compared with 49.4% a link with stroke) [15].
The ten studies of knowledge outcomes among health professionals included seven surveys of doctors, three of dental students, one of medical students, and one medical curriculum re-view. In an early study (published 1991), 97% of doctors considered tobacco use harmful [52]. 90.4% suggested no level of tobacco use was safe in a 2004 study [30], but other studies (2003, 2007 and 2009–10) suggested that only one quarter of medical faculty consider smoking more than six times per day harmful, that one quarter of residents consider tobacco use a‘fun activi-ty, not to interfere with’, and that 11% of faculty and 46% of students consider various levels of tobacco use safe [48–50]. As among non-health professionals, despite generally widespread ap-preciation that tobacco causes harm, links with specific diseases were less well appreciated [49], and evidence from one study suggested that cancer was again the disease most commonly asso-ciated with tobacco use [46]. In two recently published studies (2011 and 2013), more than 97% of dental students reported having been taught about the link with cancer [26,27]. In con-trast, a 2009–10 curriculum review in five medical colleges suggested tobacco-related teaching was not systematic or sufficient. 64% of students at these colleges reported receipt of some to-bacco-related teaching, and generally it was felt to be‘minimal’[48]. The 2009 GHPSS indi-cates 86.6% of dental students received teaching about tobacco-related harm (cf. 97.2% in 2005). 73.5% of medical students reported such teaching in 2009 (cf. 80.7% in 2005) [15].
Regarding cessation, knowledge of options for input was reported to be much higher in a 2011 study [47] than in an earlier study (published 1995) [51], but still only 17% of participants felt sufficiently knowledgeable and skilled to deliver cessation services. 20% felt sufficiently pre-pared in a 2009–10 study [48]. Further information about cessation-related training is dis-cussed in relation to Article 14.
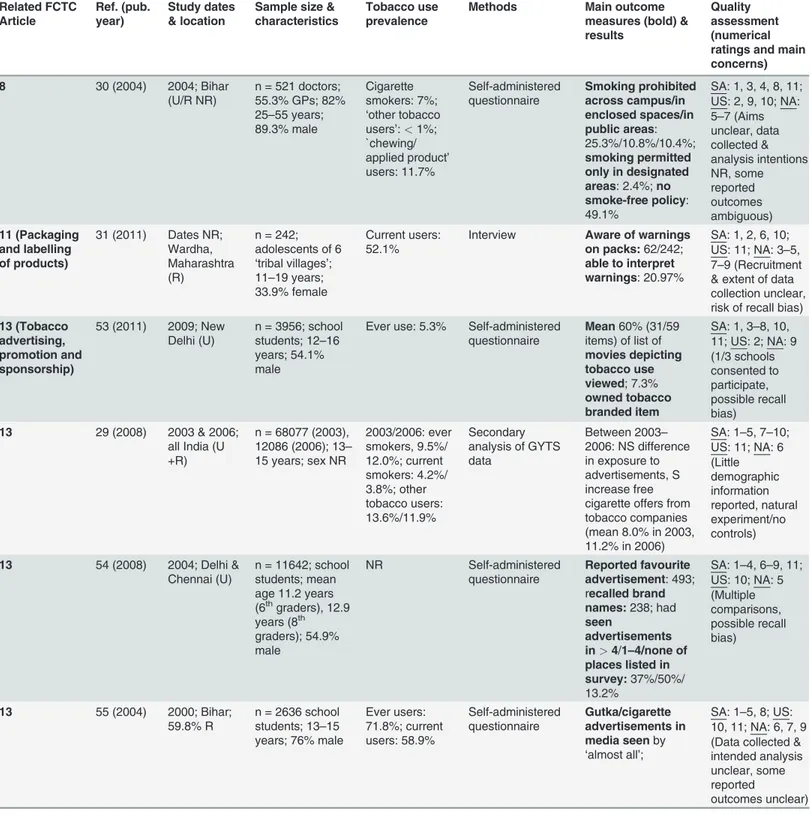
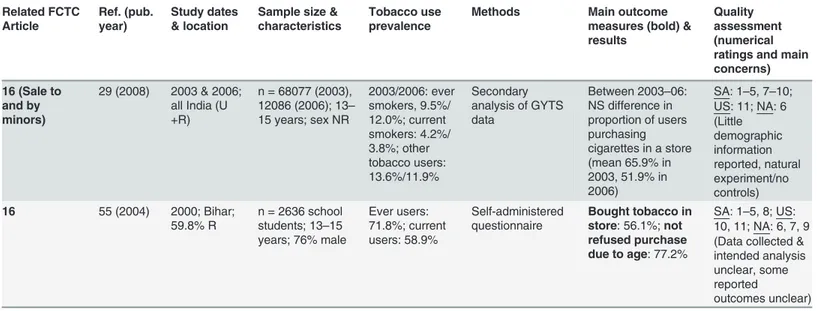
Article 13: Tobacco advertising, promotion and sponsorship (Table 4). The four studies
related to Article 13 included in all aspects of analysis utilised school student survey data. Re-sults from 2000 and 2004 suggested that almost all school students recalled exposure to adver-tisements [55], although fewer (238/11624) could recall brand names [54]. A secondary analysis of GYTS data indicated that 37.8% of schoolchildren were exposed to billboard adver-tisements in 2006, similar to levels in 2003 [29]. In 2009, 7.3% of students surveyed reported owning a tobacco-branded item, and on average they had viewed 60% of a list of movies depict-ing tobacco use [53]. In the GYTS survey, 8.1% of young people reported having been offered free cigarettes by a tobacco company in 2009 (cf. 9.3% in 2006) [15]. 2009 GATS data suggest that relatively fewer adults are aware of tobacco advertising: frequency of recall did not exceed 10.7% for any advertising method, and awareness of tobacco promotions was low among adults, not exceeding 4% for any type of promotion [15].
Table 6. Article 14: Demand reduction measures concerning tobacco dependence and cessation. Population surveyed Ref. (pub. year) Study dates & location
Sample size & characteristics
Tobacco use prevalence
Methods Main outcome
measures (bold) & results Quality assessment (numerical ratings and main concerns) Medical/ dental practitioners
47 (2013) 2011; Andhra Pradesh (AP) & Gujarat (‘primarily R’)
n = 238; 82.2% GPs, 17.8% alternative health practitioners; Gujarat/AP: mean ages: 32.2±7.7/ 36.4 ±8 years; 79.6%/
63.1% male
Ever users: 10.4%; current users: 3.9%
Interview Received training in medical school/at work: 29%/16.5%;
have knowledge of effective
counselling: 92.2%;
feel background sufficient to deliver cessation services: 17%
SA: 1–5,8,11; US: 7,10; NA: 6,9 (Limited information regarding analysis)
Medical/ dental practitioners
48 (2013) 2009–10; Kerala & Karnataka (U/R NR)
n = 713; medical faculty; mean age 32.9±9.7 years, 59% male 28% ever smokers Self-administered questionnaire
Perceived sufficient experience to help patients quit: 20%
SA: 1–8,10,11; US: n/a; NA: 9 (College selection, analysis intentions & classification of some variables unclear)
Medical/ dental practitioners
56 (2011) 2006; Ernakulam City (86% U)
n = 114, dentists, 54.4% male, ages NR 17.6% current smokers, 13.2% ex-smokers Self-administered questionnaire
Use of tobacco histories: 60.9% use with 50% of patients, 10.6% never use; 54.6%not confident in tobacco
cessation, no provision of
assistance with quitting or referral
SA: 1–3; US: 7,10,11; NA: 4–6,8,9 (Intended analysis unclear, selective reporting possible) Medical/ dental practitioners
30 (2004) 2004; Bihar (U/R NR)
n = 521 doctors; 55.3% GPs; 82% 25–
55 years; 89.3% male
Cigarette smokers: 7%;
‘other tobacco users’:<1%;
`chewing/ applied product’
users: 11.7%
Self-administered questionnaire
Use of tobacco histories:40.4% in adults, 16.9% in paediatrics;advise quitting:68.6%, &
cutting down:
48.3%;relate patient’s problems to tobacco: 60.4%;
discuss benefits of quitting: 69.2%
SA: 1,3,4,8,11; US: 2, 9, 10; NA: 5–7 (Aims unclear, data collected & analysis intentions NR, some reported outcomes ambiguous)
Medical/ dental practitioners
50 (2009) 2003; Kerala (U & semi-U)
n = 110 male faculty, 15 male & 75 female doctors; mean age 42.2±7.7 years; 77.9% male 63.1% never smokers Self-administered questionnaire
Use of smoking histories: 41.2% occasionally, 22.3% almost always, 35.3% always;
advise quitting: 21.2% occasionally, 77% almost always;
assist with drugs for quitting: 10%;
received training in cessation: 31.5%
SA: 1–4, 8; US: 7, 9–11; NA: 5, 6 (Extent of data collection & analysis unclear, low participation rates in some groups)
Table 6. (Continued) Population surveyed Ref. (pub. year) Study dates & location
Sample size & characteristics
Tobacco use prevalence
Methods Main outcome
measures (bold) & results Quality assessment (numerical ratings and main concerns) Medical/ dental practitioners
51 (1995) Dates NR; Punjab (U and‘semi-U’)
n = 106; private GPs; age NR; 90.6% male
7.5% smokers Self-administered questionnaire
Use of smoking histories:22.6% always, 52.8% often, 20.8% rarely;advise against smoking:
18.9% regularly, 81.1% when acute presentation; no referrals made to specialist clinics;
knowledge updated via: newspapers: 73.4%, television: 66%, journals: 3.8%, conferences/ education programmes: 0
SA: 1–4, 8; US: 9–11; NA: 5–7 (Data collection methods & data collected NR, no analysis reported)
Medical/ dental practitioners
52 (1991) Dates NR; Mumbai (U)
n = 363; GPs; age NR; 85.4% male
Smokers: 7.7%; smokeless users: 8.7% Self-administered questionnaire
Routinely advise to quit smoking: 64%;
advise to quit smoking only if symptoms present: 36%
SA: 1–4, 8; US: 7, 9–11; NA: 5,6 (Data collection methods, data collected & intended analysis unclear)
Patients 57 (2012) 2009–10; all India (31% U)
n = 25175;>21
years; 69.6% male
100% ever tobacco users
Secondary analysis of GATS data
Extent ofuse of cessation aids
approx. 10% (6.82% counselling, 1.16% alternative therapy, 0.74% NRT, 0.72% prescription medication, 0.56%
‘quitline’)
SA: 1–3, 5–11; US: n/a; NA: 4
Patients 37 (2009) 2006–07; Kerala (U)
n = 100; patients with diabetes; mean age 55.8±11.9 years; 100% male
100% smokers Interview Asked about tobacco use at diagnosis: 75%;
advised to quit: 52%;advised to cut down: 21%;not asked about tobacco use in past year: 42%;asked about tobacco use only once: 22%
SA: 1,2,4,8,11; US: 10; NA: 3, 5–7, 9 (Interview methods, interview content & intended analyses unclear)
Patients 58 (2008) 2006–07; Kerala (U/R NR)
n = 215; completed TB treatment; mean age 49.0±12.1 years;
100% male
94.4% ever users; 20.2% quit 6 months prior to TB diagnosis
Interview Asked about tobacco use by health staff:99.5%;
received TB-specific smoking advice:49%; given
general advice to quit without explanation: 50%; most received one brief message about tobacco at time of diagnosis
SA: 1–10; US: 11; NA: n/a (Recall bias possible)
Table 6. (Continued) Population surveyed Ref. (pub. year) Study dates & location
Sample size & characteristics
Tobacco use prevalence
Methods Main outcome
measures (bold) & results Quality assessment (numerical ratings and main concerns) Medical/ dental trainees
48 (2013) 2008–10; Kerala & Karnataka (U/R NR)
Medical faculty/ students: n = 713/ 2585; mean age 32.9
±9.7/20.3±1.7 years,
59%/47.7% male 28% faculty, 26% students ever smokers Self-administered questionnaire Nocessation trainingreceived
SA: 1–8, 10, 11; US: n/a; NA: 9 (College selection, classification of some variables & analysis intentions unclear)
Medical/ dental trainees
26 (2013) Dates NR; Karnataka (U/R NR)
n = 456,final year dental students, 30.5% male, mean age 22.7±0.94 years
9.1% current users, 1.3% former users Self-administered questionnaire
Routine use of tobacco histories: 94.8%;received teaching on anti-tobacco advice: 81.9%;give counselling: 94%;
consider own counselling skills insufficient: 49.8%;
never suggest use of NRT: 76.5%;
cessation information displayed in institution: 87%
SA: 1–6,8; US: 10,11; NA: 7,9 (Data collected unclear, possible selective reporting) Medical/ dental trainees
27 (2011) 2009; Karnataka (U/R NR)
n = 329; dental students of 3 colleges in Karnataka; 20–26 years; 29.7% male
7% current smokers; 5% ex-smokers Questionnaire (delivery method unclear)
Routine use of tobacco histories: 93%;give cessation advice: 94.2%;
received teaching on anti-tobacco advice: 47.1%;
counselling considered ineffective unless patient’s problem related: 67.8%;
cessation information displayed in institution: 58.7%
SA: 1, 2, 4–7, 9; US: 8, 10, 11; NA: 3 (Convenience sample, multiple comparisons) Medical/ dental trainees
28 (2012) 2005 & 2009; all India (U +R)
Medical/dental students: n = 1176 (2005), 1523 (2009)/ 1339 (2005), 711 (2009); age, sex NR
Medical/dental students: smokers: 13.4%/6.5%; smokeless users: 11.6%/ 8.6% Secondary analysis of GHPSS data
No S change in
provision of cessation training
for medical students between 2005 & 2009, but S increase in training received by dental students (mean 10.5 to 54.8%)
SA: 1, 3–9, 11; US: 10; NA: 2
healthcare students, and patients. Outcomes considered related to training and practice in to-bacco control. In two pre-FCTC surveys of doctors (2003 and 2004), and a post-FCTC survey of dentists (2006), approximately half reported routine use of tobacco histories [30,50,56]. Pre-FCTC, most doctors (64%, 68.6% and 77.5%, in different surveys) reported routine provision of cessation advice [30,50,52]. In contrast, two post-FCTC (2006–07) surveys of patients with diabetes and tuberculosis suggested most had been asked about tobacco use, but only approxi-mately half advised to quit [37,58]. In the 2009 GATS, 53.0% had been asked about smoking, 34.2% about smokeless use, and 46.3% of smokers and 26.7% of smokeless users recalled being advised to quit [15].
Regarding cessation assistance, post-FCTC studies suggest that 54.6% of dentists (in 2006), and 80–83% of doctors (2009–11), feel they have insufficient experience to offer cessation assis-tance [47,48,56]. Only small numbers report offering assistance: 10% of doctors in one study [50], none of the dentists surveyed in another [56]. In the 2009 GATS, 9.2% and 7.6% of ers and smokeless tobacco users had received cessation counselling/advice, and 4.0% of smok-ers had used pharmacotherapy as a cessation aid [15]. A recent analysis of GATS data
suggested alternative (e.g. ayurvedic) methods are used more commonly than NRT [57]. 31.5% of doctors had received cessation-related training in a 2003 survey [50], and 16.5% work-based training in a 2011 survey [47].
A secondary analysis of GHPSS data reported a significant increase in cessation training for dental students between 2005 and 2009 (54.8% prevalence in 2009, cf. 10.5% in 2005), but only a small upward trend among medical students (29.1% in 2009, cf. 22.3% in 2005) [28]. In keep-ing, more recent surveys reported receipt of cessation–related teaching by 47.1% and 81.9% of dental students [26,27], but little training for medical students [48]. 35.1% of nursing students had received cessation training in 2007, and 30.4% of pharmacy students in 2008 (GHPSS) [15].
Table 6. (Continued)
Population surveyed
Ref. (pub. year)
Study dates & location
Sample size & characteristics
Tobacco use prevalence
Methods Main outcome
measures (bold) & results
Quality assessment (numerical ratings and main
concerns)
Medical/ dental trainees
49 (2011) 2007; Bangalore (U)
n = 76; clinical residents; mean age 28±2.9 years; 68% male
NR
Self-administered questionnaire
>80%routinely use tobacco histories; 50%
routinely offer cessation advice;2/ 3wait for patients to request assistance; self-rated as low/average
proficiency in cessation practice: 69%
SA: 1–4, 7–10, 11; US: n/a; NA: 5, 6 (Small n-number, questionnaire components NR)
Reviewed studies relating to FCTC Article 14 included in all aspects of synthesis, sub-categorised by population surveyed. The numbers following the different quality categories (SA, US, NA) indicate the aspect of quality assessment (seeTable 2), rated as satisfactory (SA), unsatisfactory (US) or not-assessable (NA). All studies were of cross-sectional design, or secondary analyses of cross-sectional surveys. U = urban; R = rural; GP = general practitioner; NR = not reported; GATS: Global Adult Tobacco Survey; TB = tuberculosis; NRT = nicotine replacement therapy; GHPSS: Global Health Professions Student Survey; S = significant; NS = not significant
Table 7. Studies related to trialled interventions. Relevant FCTC Article and intervention type Ref. (pub. year) Study dates, design & location
Sample size & characteristics
Intervention Methods (M) & follow-up (F)
Main outcome measures (bold) & results
Quality assessment (numerical ratings and main concerns) 12: Education,
communication, training and public awareness (school-based interventions)
59 (2012) 2010–2011; QE; Maharashtra (U/R NR)
Controls: n = 690 8th
graders, mean age: 13.6 years, 51% male; 8.7% tobacco users; Intervention group: 8th/9th
graders: n = 660/501; mean age: 13.4/14.5 years; 48%/46% male; 4.1%/3.6% tobacco users
Year 1: education programme; Year 2: work with civic authorities/other organisations
M: Follow-up by survey; F: at 1 year (8thgrade
intervention group) or 2 years (9thgraders)
post-start of intervention, unclear for controls
Control/intervention group:awareness of programme: 16%/ 97–99%;read programme newsletter: 5%/40– 50%. S higher
knowledge,life skills, self-efficacy scores,andactions to prevent tobacco use among others, in intervention group. S lesstobacco use
in intervention group.
SA: 1–2,7,10–11; US: n/a; NA: 3–6, 8,9 (No pre-intervention data, one control group for heterogeneous intervention groups, analysis methods/ outcomes unclear) 12 (school-based interventions)
60 (2013) 2004–06; RCT cost analysis; Delhi & Chennai (U)
n = 6365; school students; 10–16 years; 43% female
Project MYTRI: classroom curriculum, posters, parent postcards & peer-led health activism
M: theoretical cost analysis; F: lifelong modelling study
4.52QALYs added per averted smoker;
cost per QALY addeddue to averted smoking = $2769;cost per life-year added: $4348
SA: 1–5, 7, 8; US: 10,11; NA: 6, 9 (Source & breakdown of costs not presented, some assumptions based on data from outwith India)
12 (school-based interventions)
61 (2011) 2004–06; RCT mediation analysis; Delhi & Chennai (U)
n = 6381
(intervention group), 7704 (control group); 43.4% female, ages NR (6th-8thgraders)
Project MYTRI (as above)
M: mediation analysis based on questionnaire data; F: at baseline and postfirst and second years of intervention
(1)Positively affected by intervention & positive effect on behaviour: knowledge of health effects, reasons to use/not to use, advocacy skills, normative beliefs; (2)
Negatively affected by intervention: perceived prevalence of tobacco use
SA: 1–9; US: 10, 11; NA: n/a (Secondary analysis, size/ relevance of effects unclear)
12 (school-based interventions)
62 (2009) 2004–2006; RCT; Delhi & Chennai (U)
n = 6365
(intervention group), 7698 (control group); school students; 43% female; ages NR (6th-8thgraders)
Project MYTRI (as above)
M: delivered over 4 months of each of 2 years; data collected via self-administered questionnaire; F: at baseline and post
first and second years of intervention
Tobacco use:
increased by 68% in controls, decreased by 17% in intervention group: S differences in
changes in cigarette(p<0.05),
bidi(p<0.01) &any tobacco use
(p<0.04), &
tobacco use intentions(p<0.03)
SA: 1–10; US: 11; NA: n/a
12 (school-based interventions)
63 (2010) 2004–05; process evaluation of RCT; Delhi & Chennai (U)
n = 5564; school students; sex NR, ages NR (6th-8th
graders)
Project MYTRI (as above)
M: delivered over 4 months; data collected by‘ co-ordinators’, teachers, & peers; structured data collection process; F: assessed throughout implementation of project
Average extent to which programme implemented:
71.3%, moretrained teacherscorrelated with higher implementation rates & lower susceptibility to tobacco use; teachers‘often’
reported activities 'enjoyed' when 'not conducted'
SA: 1–5, 7, 8, 11; US: 10; NA: 6, 9 (No controls, risk of recall bias)
Table 7. (Continued) Relevant FCTC Article and intervention type Ref. (pub. year) Study dates, design & location
Sample size & characteristics
Intervention Methods (M) & follow-up (F)
Main outcome measures (bold) & results
Quality assessment (numerical ratings and main concerns) 12 (school-based
interventions)
64 (2009) 2004–2005; mediation analysis of RCT; Delhi, Chennai (U)
n = 4360 (control group), 4009 (intervention group); school students; intention to use tobacco; 51.6% male; ages NR (6th
-8thgraders)
Project MYTRI (as above)
M: mediation analysis based on survey data; F: 1 year post-start of intervention
Intention to use tobacco used as outcome variable for mediation analysis; S
programme effect
for intention to chew (p = 0.04) but not smoke (p = 0.07); knowledge of health effects (10% of total effect), normative beliefs (18%), reasons for use (6%) &perceived prevalence (7%) S
mediators between intervention & use intentions
SA: 1–4,6,7,9; US: 10, 11; NA: 5, 8
12 (school-based interventions)
65 (2002) 1997–1999; group randomised trial; Delhi (U)
n = 1293–1863 (variation by group & pre/post-test); school students; age 12 years; 50.5% males
School based: cardiovascular health education programme; Family-based: booklets to share with families
M: Schools assigned to school/ family programme, school alone, or control condition; F: students surveyed at baseline & immediately following intervention (1 year duration)
At post-test: NS difference in ‘tobacco
knowledge’between groups; S lower ‘tobacco
knowledge/attitude score’among ‘school only’cf. other conditions, S more in control cf. other conditionstried smoking, S more in control cf. school/ family group
tobacco use intentions
SA:1,4–6,10; US: 2,7,11; NA: 3,8–9 (Limited demographic information, some outcomes NR, limited follow-up, p-values NR)
12 (community-based intervention)
66 (2010) 2006–2007; QE; Delhi (U)
Controls: n = 1152 (baseline), 1083 (endline); intervention group: n = 1229 (baseline), 1162 (endline); residents of slum/ resettlement colonies; 10–19 years; sex
distribution NR for full population
Community-based intervention including posters,
films, lectures, plays, booklets, pamphlets, awareness rally
M: 3–7 sessions of 4 activities conducted at different locations (mean 40–50 participants at each); F: questionnaire administered at baseline & 1 year post-start of intervention
At post-test: Prevalence of current (p = 0.003) & ever (p = 0.009)tobacco uselower in intervention cf. control group;fresh uptakehigher in control cf. intervention groups (OR = 5.96 (95% CI: 1.73–20.51)); NS between-group difference inquit rate
SA: 1–2,4,6,10; US: 7, 11; NA: 3, 5, 8–9 (Area selection and sorting to groups unclear, small n-number for females, no information regardingfidelity of intervention, some outcomes NR) 14: Demand reduction measures concerning tobacco dependence and cessation (pharmacological intervention)
67 (2010) Dates NR; RCT; Delhi (U)
n = 30 (15/group); smokers attending cessation clinic Drug group/placebo group: mean age 46.9±14.1 years/39.3±12.2 years, 100% male/ 93.3% male
Drug group: physician advice + bupropion; Placebo group: advice + placebo
M: Single-blind RCT; abstinence, weight, Beck’s depression score, withdrawal symptoms & side effects monitored; F: intervention for 7 weeks, follow-up at weeks 1–8, 12 & 16
7-day abstinence rate (drug vs control):week 2: 46.67 vs 13.33% (p = 0.04); week 16: 53.33 vs 20% (p = 0.05); NS difference in
depression scores; meanweight gainS less in drug cf. placebo group,
withdrawal symptomsS higher in drug group in early weeks.Side effects
higher in drug group