EURASIAN JOURNAL OF BUSINESS AND
MANAGEMENT
www.eurasianpublications.com
T
HE
E
FFICIENCY
A
NALYSIS OF
S
INGAPORE
R
EAL
E
STATE
I
NVESTMENT
T
RUSTS
Hui Chen Chiang
Ming Chuan University, Taiwan Email: hcchiang@mail.mcu.edu.twYih Ching Tsaih
Ming Chuan University, Taiwan Email: yctsaih@mail.mcu.edu.twWen-Cheng Hsiao
Ming Chuan University, Taiwan Email: wchsiao@mail.mcu.edu.twAbstract
Since the REIT industry is relatively new in Singapore, the objective of this research is to examine the operation efficiency among firms in the industry through the method of Data Envelopment Analysis (DEA). In addition, the method of Tobit regression is applied to investigate the impact factors on efficiency. The results are as follows. First, none of 14 firms analyzed performs relatively efficiently based on the average efficiency scores over the sample periods of 2007 to first quarter of 2015. Nevertheless, it is found that First REIT and Suntec REIT are the most efficient and least efficient REITs respectively. Second, ROA is positively correlated to efficiency scores while the negative relationship is found with the debt ratio. Third, regarding property-type, retail REITSs perform better than commercial ones on average. However, the most efficient group is “others” which consists of one hospitality/residential REITs, one healthcare REITs, and three industrial REITs. Fourth, geographical diversification may not
affect REIT’s efficiency. Meanwhile, REITs holding more properties overseas perform better than their counterparts on average. Last, in regards to size, small-size REITs significantly perform better in efficiency than those in other categories. Especially, medium-size and large-size REITs do not have significant differences on average in efficiency.
Keywords: REIT, Singapore, DEA, Tobit Regression
1. Introduction 1.1. Background
Singapore is known to be one of the four original Asian Tigers, a global financial hub, as well as
Asia’s 1st and the world’s 4th most influential city by Forbes. She is recognized to be one of the
10
ranks high in the Human Development Index in terms of education, healthcare, life expectancy, quality of life, personal safety and housing. According to World Bank, she has the 3rd highest annual GDP per capita at purchasing power parity of US$82,736.4 in 2014. Certainly, her successes did not come easy.
After her independence from Malaysia in 1965, Singapore was faced with high levels of unemployment and poverty. She has only a small domestic market and lacks natural resources. She could only rely on her population as resources, half of them illiterate at the time. Hence, the government established Economic Development Board to attract foreign direct investment to build her economy. She also established the Central Provident Fund that forces its citizen to save a proportion of their salary into an account that can be later used for housing, medical purposes, and retirement. Coupled with state-led industrialization strategy, Singapore produced an average real GDP growth of 8.7% since her independence until the 1997 Asian Financial Crisis hit.
Due to Singapore’s integration to the region’s economy, her economy was affected. Singapore’s exports and tourism regional demand decreased significantly due to the region’s
depreciation against the Singapore Dollar as well as the region’s weakening demand, her banking sector were affected due to lending exposure to these Asian countries, investments in these region suffered a setback, and Singapore real estate sector took a beating. However, due to her strong economic fundamentals, sound policies, and the ability to take bold effective measures, her economy was quick to rebound with an astounding growth of 5.4% in 1999 and
public sector employees’ pay cuts were fully restored by the year 2000 (Jin, 2000).
One of the other things Singapore did was to introduce the Singapore Real Estate Investment Trust (REIT). REIT is a trust that pooled money from many investors to purchase and manage income property (Keke and Emoh, 2015). When the Asian Financial crisis hit,
Singapore’s private property prices was reduced to 40% within the year among other things
(Jin, 2000). The introduction of REIT would bring more liquidity and new capital needed to reawaken her real estate sector that was severely affected by the Asian Financial Crisis. It is also established to widen the range of financial products available to investors, strengthening
Singapore’s position as a global financial hub further (Ooi et al. 2006). There are many benefits of REITs: they serve as a vehicle for international funds who are looking to diversify into Asia’s real estate assets (Newell et al. 2005), provide steady income in the form of dividends while having the potential of capital gain in the future (especially ideal for pensioner), provide a hedge against inflation, offer tax benefits as REITs enjoy corporate tax and exempted from paying Goods and Service Tax and capital gain tax, a more secure form of investment as they are subjected to more stringent regulation in areas of corporate governance, leverage, and financial reporting (Keke and Emoh, 2015), as well as having a lower transaction fees than real estate transaction whereby investors have to pay for GST, trading tax, broker fee and stamp duties.
According to Monetary Authority of Singapore, Singapore is currently the second largest REIT market after Japan. However, countries such as China and India are catching up to establish their own REIT market and will threaten Singapore’s REIT market position if they manage to overcome their high tax and high interest rates problems. Hence, it is important for Singapore REITs to strengthen their position by managing and improving their technical efficiency level to retain their position as a major Asian REIT hub.
1.2. Objectives and Structure of the Research
Since the REIT industry is relatively new in Singapore, there are not many empirical studies that are done to assess their technical efficiency. Hence, the first objective of this research is to examine efficiency across the REIT industry in Singapore using Data Envelopment Analysis (DEA). The study will cover available quarterly data of REITs from first quarter of 2007 until first quarter of 2015.
There are many REIT characteristics that may explain the differences in a REIT’s
11
categories respond to their respective underlying property sector (Mueller and Laposa, 1996). These property sectors respond differently to certain market conditions at times. For example, falling recreational tourist arrival will affect hospitality and retail sector but unlikely to affect healthcare sector. Hence, falling tourism level will affect hospitality REITs and retail REITs. Because of this reason, our second objective is to include property-type as one of the REIT characteristics that may explain differences in technical efficiency.
There are some REITs that diverse geographically. Diversification is usually associated with higher cost in general expenses. On the other hand, REITs might choose to diversify to lower their risk and take advantage of rapid growth in other countries. Therefore, the third objective is to find out whether diversification actually improves technical efficiency.
Different properties locations are subjected to different markets and economic conditions, hence, there might be some differences in performance. In this study, the fourth objective of the researcher is to find out whether there is a significant difference in technical efficiency for concentrating on overseas properties versus Singapore properties.
There exists an optimal size for REIT where they operate at the lowest point of the average cost curve. Hence, the fifth objective of this study is to assess the technical efficiency level across size. From this study, the researcher can deduce whether there are opportunities of better performance through expansion.
The remainder of this research is organized as follows: Chapter Two will discuss the research methods used in this study. Chapter Three will present Research and Findings of this research while Chapter Four will provide conclusion to this study.
2. Research Method
2.1. Research Data and Sources
The data used in this study consists of quarterly observations from Real Estate Investment Trusts that are listed in Singapore Exchange between first quarter of 2007 to first quarter of 2015. Quarterly information of REITs is gathered from each REIT’s respective quarter and annual reports that can be found on their official websites. The sample data excluded stapled REITs as there are very few stapled REITs in Singapore. To assess REITs efficiency improvements over the years with fairness as mentioned by Topuz and Isik (2009), only S-REITs that are active throughout the studied period (1Q2007 to 1Q2015) will be used. In total, there will be 14 S-REITs and hence, 462 REITs observations (calculation: 14 REITs * 33 quarters from 2007 to 1st quarter of 2015).
As discussed previously, the efficiency of the Decision Making Units (REITs) increase when their number of inputs and outputs increase. Hence, to solve this problem, the researcher will adhere to the rule of thumbs used by Golany and Roll (1989), Bowlin (1998), and Dyson et al. (2001). The researcher will only use 2 input variables: (1) Property operating expenses, (2)
Manager’s Fees, as well as 2 output variables: (1) Total Revenue, (2) Total Assets to assess
the efficiency of each REITs. Following the DEA estimation, the researchers will run regression of the efficiency scores against factors such as property-type, diversification, geographical concentration, and size.
The list of input and output variables for the period of 2007Q1-2015Q1 is shown in Table 1.
Table 1. List of input and output variables (2007Q1-2015Q1)
Input Variables Output Variables
Property Operating Expenses Management Fees
12 2.2. Research Variables
2.2.1. Variable Selection
The selection of inputs and outputs variables will depend on the researcher’s interest, view of firms and availability of data (Aly et al. 1990). There a lot of disagreements between researchers on what constitute the productions of REITs and how to measure their output. There are even arguments on whether REITs should be classified as stocks (e.g. Anderson et al. 2015; Ro and Ziobrowski, 2011; Campbell et al. 2003) or real estate institutions with many recent studies by Bers and Springer (1997),Bers and Springer (1998), and Anderson et al. (2002) supporting the latter. This research will view REITs as real estate institutions rather than stocks.
In regards to input, Anderson et al. (2002) use four inputs: interest expense, property operating expense, general and administrative expense, and management fees whereas Topuzet al. (2005) as well as Topuz and Isik (2009) employ interest expense and property operating expense. In this research, similar to Topuz and Isik (2009) and Topuzet al. (2005), only two inputs are used mainly due to the researcher’s effort to adhere to the rules of thumbs in regards to the number of inputs and outputs used relative to number of DMUs reported. However, instead of interest expense, management fee will be used because the researcher is interested in finding out whether management fee actually improves efficiency. Many local articles in Singapore such as Straits Times discuss the importance of considering management fees when investing in REITs. Therefore, the inputs of this study will be 1) property operating expense and 2) management fees.
On the other hand, the common outputs used in research papers are market capitalization, total revenue, total assets, and/or dividends. According to Bers and Springer (1998), the use of total assets as output will yield a more conservative and more believable results as compared to other output measures. It has a high correlation with and a smaller variance than market capitalization. It also has more consistent results and if bias exists, it is conservative bias. Therefore, total assets will be preferable over market capitalization. In addition, Bers and Springer (1997) as well as Anderson et al. (2002) found that results are very similar in their efficiency studies when both assets and dividends are used as output and when only assets are used. Hence, this strengthened the researcher’s choice for total assets as one of the outputs. Miller et al. (2006) as well as Miller and Springer (2007) also use total revenue in addition to total assets as their outputs in their study. Hence, in this study, the outputs will be 1) total assets, 2) total revenue.
2.2.2. REIT Characteristics
The researcher aims to examine whether REIT characteristics such as property-type,
diversification, geographical concentration, and scale have an impact on REIT’s efficiency. In
this study, property-type is classified into three categories: retail, commercial, and other REITs. The property-type classification is based on the respective REIT’s portfolio value concentration e.g. Suntec REIT is classified as commercial as its portfolio value in commercial exceeds retail. In regards to geographical diversification, the researcher will measure diversification using two methods. The first method will employ the Herfindahl Index1 method. The second method is to split the categories into specialized for REITs that focuses 75% of its total portfolio value on one country, and diversified otherwise (Anderson et al. 2015). On the other hand, for geographical concentration, the categories are split into Singapore-focused properties and
overseas properties. The REIT’s portfolio value concentration determines their geographical
focus.
Lastly, for size, total asset is the parameter used for measurement. In this study, splitting the assets into three quartiles determines the REIT size into small, medium, and large. Capozza and Lee (1995) have also determined REIT size based on asset quartiles.
13 2.2.3. Tobit Regression Model
This research will use two-stage procedure that comprise of DEA analysis followed by Tobit Regression Model to obtain consistent estimator. This model is introduced by James Tobin (1958) and allows the researchers to validate the DEA analysis and explain possible causes of differences in efficiencies. It traditionally assumes the dependent variable is left-censored at zero, hence, enabling researcher to estimate linear relationship between a non-negative dependent variable and independent variables. However, variation of the original Tobit model allows for a lower bound value other than zero and an upper bound value other than the latent value. Tobit regression model will help the researcher recognize the relationship between various controlling factors (i.e. size, property type, etc) and efficiency.
According to Hoff (2007) as well as Bogetoft and Otto (2010), Tobit Regression is commonly used as the second-stage evaluation to DEA scores. The Tobit model will enable researcher to find out the marginal impact of independent variables on the latent variable (i.e. efficiencies). In addition to that, it also allow researcher to see whether their relationship is positive, negative, or even neutral. As previously mentioned, it will help verify the findings of the earlier DEA model.
There are many literary works that combine the use of DEA and Tobit Regression (e.g. Barry et al. 2010; Berger and Humphrey, 1990; Wang et al. 2006;Pande and Patel, 2013). In the real estate industry, Anderson et al.(1998) use DEA and Tobit Regression to measure the efficiency levels of residential real estate brokerage firms.
3. Research Result
3.1. DEA Input and Output Variables
We treated REITs as an institution rather than stocks; hence, we assume the inputs are Property Operating Expenses and Management Fees, while the outputs are Total Revenue and Total Assets. The researcher used SPSS to organize the data panel of 462 observations and processed them accordingly.
The
d
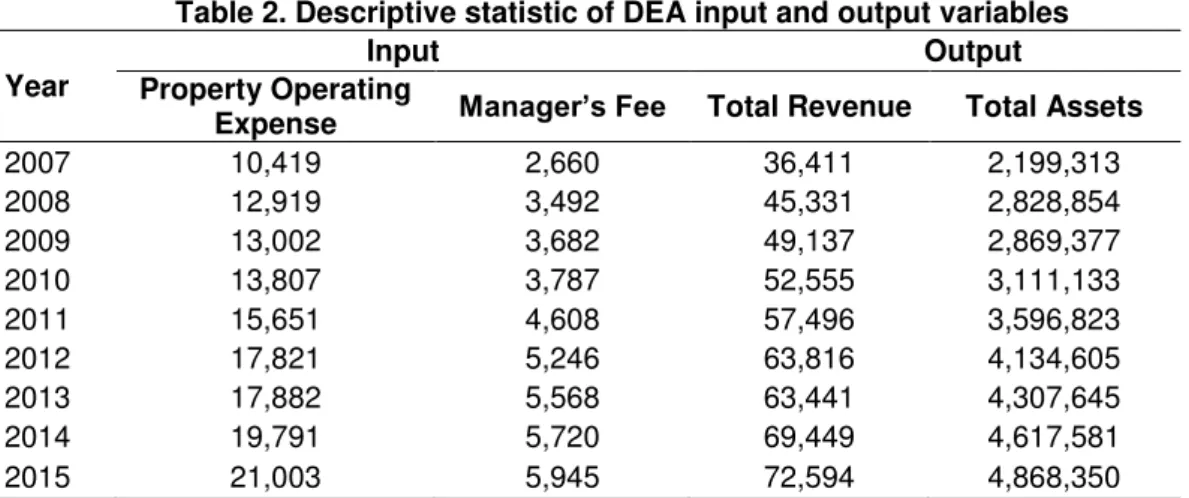
escriptive statistic of DEA input and output variablesis shown in Table 2.Table 2. Descriptive statistic of DEA input and output variables
Year
Input Output
Property Operating
Expense Manager’s Fee Total Revenue Total Assets
2007 10,419 2,660 36,411 2,199,313
2008 12,919 3,492 45,331 2,828,854
2009 13,002 3,682 49,137 2,869,377
2010 13,807 3,787 52,555 3,111,133
2011 15,651 4,608 57,496 3,596,823
2012 17,821 5,246 63,816 4,134,605
2013 17,882 5,568 63,441 4,307,645
2014 19,791 5,720 69,449 4,617,581
2015 21,003 5,945 72,594 4,868,350
Note: Variables expressed in thousand Singapore Dollar
Table 2 shows that Singapore REITs had increase in average property operating expense and management fee over the years. The average revenue also increases except for the year 2012 to 2013 where they experience a small decline. As for the average total assets, S-REIT also experienced an increase over the few years, reaching an average of $4,868,350,000 in the first quarter of 2015. Table 3 shows the overall statistical results of DEA input and output variables.
14
Table 3. Overall statistical result of DEA input and output variables
Note: Variables expressed in thousand Singapore Dollar
The Pearson correlation of DEA inputs with efficiency scores that this paper proceeded is shown in Table 4.
Table 4. Pearson correlation of DEA inputs with efficiency scores Operating Expense (as a %
of Total Revenue)
Manager’s Fee (as a % of Total Revenue)
Pearson Correlation -0.077 -0.404
Significant (two-tailed) 0.049** 0.000***
Notes: **,***. Correlation is significant at the 0.05 and 0.01 level, respectively (2-tailed).
From the results, it can be seen that both operating expense and manager’s fee are
negatively correlated with efficiency scores, which means that an increase in operating expense or management fee reduces the efficiency of REITs. As mentioned before, Singapore
newspaper “Straits Times” stressed upon the importance of considering Management Fees
when choosing which REITs to invest. Based on DEA results, investors are discouraged from investing in REITs that has a high management fees as it is shown to reduce efficiency.
3.2. DEA Efficiency Scores
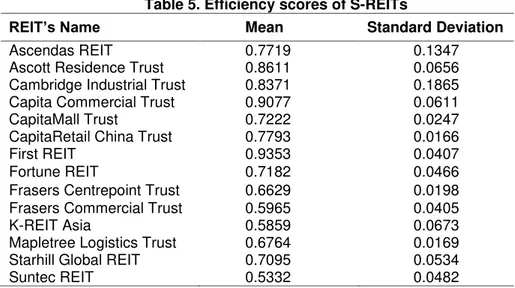
Through the DEA program, the researcher was able to obtain the technical efficiency scores of Singapore Real Estate Investment Trust. The mean and standard deviation of REIT’s efficiency scores are shown in Table 5.
Table 5. Efficiency scores of S-REITs
REIT’s Name Mean Standard Deviation
Ascendas REIT 0.7719 0.1347
Ascott Residence Trust 0.8611 0.0656
Cambridge Industrial Trust 0.8371 0.1865
Capita Commercial Trust 0.9077 0.0611
CapitaMall Trust 0.7222 0.0247
CapitaRetail China Trust 0.7793 0.0166
First REIT 0.9353 0.0407
Fortune REIT 0.7182 0.0466
Frasers Centrepoint Trust 0.6629 0.0198
Frasers Commercial Trust 0.5965 0.0405
K-REIT Asia 0.5859 0.0673
Mapletree Logistics Trust 0.6764 0.0169
Starhill Global REIT 0.7095 0.0534
Suntec REIT 0.5332 0.0482
From this result, it can be seen that First REIT has the highest average efficiency scores over the year 2007 to 2015 (Q1) period. Capita Commercial Trust followed closely
Variable Average Standard
Deviation Maximum Minimum
Property Operating
Expenses 15,332 13,864 60,754 14
Manager’s Fees 4,381 3,085 15,504 551
Total Revenue 55,206 40,141 173,794 6,003
15
behind with an average mean score of 0.93527. On the other hand, Suntec REIT has the lowest efficiency score of 0.53324. The standard deviation of the efficiency scores shows the consistency of efficiency. Although Cambridge Industrial Trust has a relatively high efficiency score of 0.83712, it also has the highest standard deviation of 0.186497.
This research also examines the correlation of Return on Assets and Debt Ratio with efficiency score. The correlation of ROA and debt ratio with efficiency scores is shown in Table 6.
Table 6. Pearson correlation of ROA and debt ratio with efficiency scores ROA (based
on Operating Profit)
Debt Ratio (Total Liabilities/Total Assets)
Pearson Correlation 0.371 -0.155
Significant (two-tailed) 0.000*** 0.001**
Notes: **, ***. Correlation is significant at the 0.05 and 0.01 level, respectively (2-tailed).
The result shows that Return on Assets is positively correlated with efficiency while debt ratio is negatively correlated at the 0.01 significant levels. Hence, this question the
government’s recent policies to increase leverage from 35% to 45% of total assets because increasing leverage does not translate into increasing efficiency. The Debt Ratio results also confirm study done by Anderson et al. (2002)
3.3. Efficiency Score Based on Property-Type
The second objective of this research is to examine the differences in efficiency of REITs based on their type specialization. The DEA efficiency scores comparison between property-type is shown in Table 7.
Table 7. DEA efficiency scores comparison between property-type
Mean Standard
Deviation F Sig.
Retail 0.7184 0.0511
65.949 0.000***
Commercial 0.6558 0.1577
Others 0.8164 0.1386
Notes:***. Mean Difference between groups is significant at the 0.01 level (2-tailed).
The mean differences of efficiency scores between property-type are shown in Table 8.
Table 8. Mean differences of efficiency scores between property-type
(I) (J) Mean Differences
(I – J) Sig.
Retail Commercial 0.0626 0.000***
Others -0.0980 0.000***
Commercial Retail -0.0626 0.000***
Others -0.1605 0.000***
Others Retail 0.0980 0.000***
Commercial 0.1605 0.000***
Notes:***. Mean Difference is significant at the 0.01 level (2-tailed).
It shows that the category “others” has the highest efficiency of 0.81636, followed by
16
the sector) to represent the whole sector. For example, the efficiency achieved by Ascott Residence Trust may not be due to their property-type, but rather efficiency of the REIT itself.
According to Mueller and Laposa (1996), retail has a higher quarterly return with lower standard deviation than office on average for the period 1990-1995. In this paper, the researcher categorized office as commercial. The result is consistent with Mueller and Laposa (1996) as the result of this study shows that retail has a higher mean (higher efficiency score) and lower standard deviation (lower risk) than commercial.
3.4. Efficiency Score based on Geographical Diversification
The third objective of this research is to find out the effect of geographical diversification on
REIT’s efficiency. The researcher engaged 2 methods based on Herfindahl index and diversification level, respectively.
The result of Pearson correlation of Herfindahl index with efficiency scores is shown in Table 9.
Table 9. Pearson correlation of Herfindahl index with efficiency scores
Herfindahl Index
Pearson Correlation 0.013
Significant (two-tailed) 0.780
The result of efficiency scores comparison between specialized and diversified REITs is shown in Table 10.
Table 10. Efficiency scores comparison between specialized versus diversified
Mean Standard
Deviation t Sig. Specialized 0.739 0.1443
0.830 0.407 Diversified 0.727 0.1230
Using the Herfindahl Index method, it can be deduced that there is no correlation between efficiency and geographical diversification. Meanwhile, the research categorizes REITs into specialized if 75% of its portfolio value is concentrated on one country, and diversified for otherwise. The researcher further analyzed using the second method to see if it still holds true and finds that although specialized REITs has a higher efficiency of 0.73901, it does not differ significantly from diversified which has a mean of 0.72737.
In summary, both tests show that there is no impact of geographical diversification on efficiency level. This confirms findings of Topuz et al. (2005) as well as Ro and Ziobrowski (2011).
3.5. Efficiency Score based on Geographical Concentration
The fourth objective is to find out whether there are differences in efficiency if REITs is more focused on Singapore or overseas in terms of their portfolio.
17
Table 11. Efficiency Scores Comparison between Singapore versus Overseas
Mean Standard
Deviation t Sig.
Overseas 0.824 0.0940 11.047 0.000***
Singapore 0.700 0.1374
Notes: ***. Mean Difference is significant at the 0.01 level (2-tailed).
It shows that the efficiency level of REITs who focused their portfolio more in overseas have a higher efficiency level of 0.824 compared to their counterparts on average. Furthermore, they are also more consistent in their efficiency level and hence, less risky as shown by the lower standard deviation. The results are shown to be statistically significant.
This result reflects the situation of the Singapore’s economy that has slower growth
compared to other countries such as China and Indonesia in recent years. The economy’s growth definitely has an impact on the growth of REIT. In addition, rising cost of land and property prices in Singapore has slowed down the number of acquisitions as it has become more expensive and riskier to do so, and since one of the DEA output measure in this research is based on total assets, this situation might explain the lower DEA efficiency scores.
3.6. Efficiency Score based on Size
The fifth objective is to find out whether REIT’s size (measured in terms of total assets) has an impact on efficiency. Assets are split into three quartiles to categorize REIT into small, medium, or large.
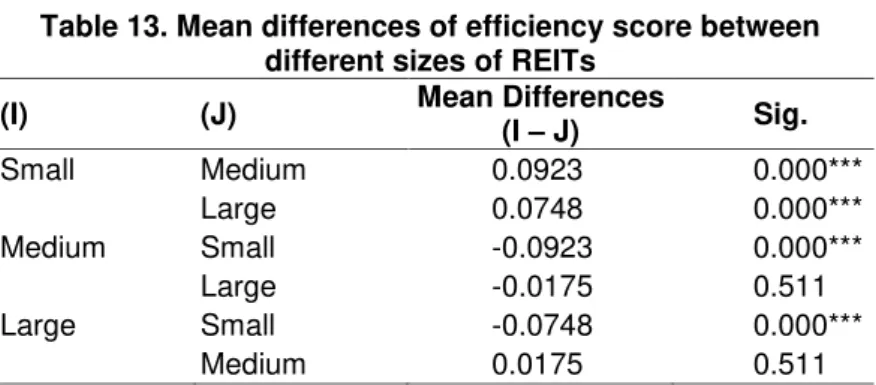
The comparison of efficiency scores by sizes of REITs is shown in Table 12.
Table 12. Efficiency scores comparison between different sizes of REITs
Mean Standard
Deviation F Sig.
Small 0.7912 0.1376
21.062 0.000***
Medium 0.6989 0.1055
Large 0.7164 0.1505
Notes: ***. Mean Difference between groups is significant at the 0.01 level (2-tailed).
It shows that the smaller REITs display higher efficiency on average with a score of 0.7912. This is followed by large-size REITs with an efficiency score of 0.7164 and medium-size REITs with an efficiency score of 0.6989. Regarding standard deviation, medium-size REITs has the lowest standard deviation, followed by small-size REIT. However, the average standard deviations of different sizes of REITs are not very distinct from each other.
The testing result for statistically significant differences on the mean of these categories is shown in Table 13.
Table 13. Mean differences of efficiency score between different sizes of REITs
(I) (J) Mean Differences
(I – J) Sig.
Small Medium 0.0923 0.000***
Large 0.0748 0.000***
Medium Small -0.0923 0.000***
Large -0.0175 0.511
Large Small -0.0748 0.000***
Medium 0.0175 0.511
18
The result shows that the mean differences between small-size REITs and other REITs are statistically significant while the differences between medium-size and large-size REIT are not. Hence, from this result, it can be deduce that small-size REIT has the highest efficiency while medium-size and large-size REITs are on an equal footing.
3.7. Tobit Regression Analysis
To support and enhance the researcher’s analysis further, Tobit regression is conducted. Tobit
regression enabled the researcher to combine and assess all independent factors together to see their impact on efficiency level.
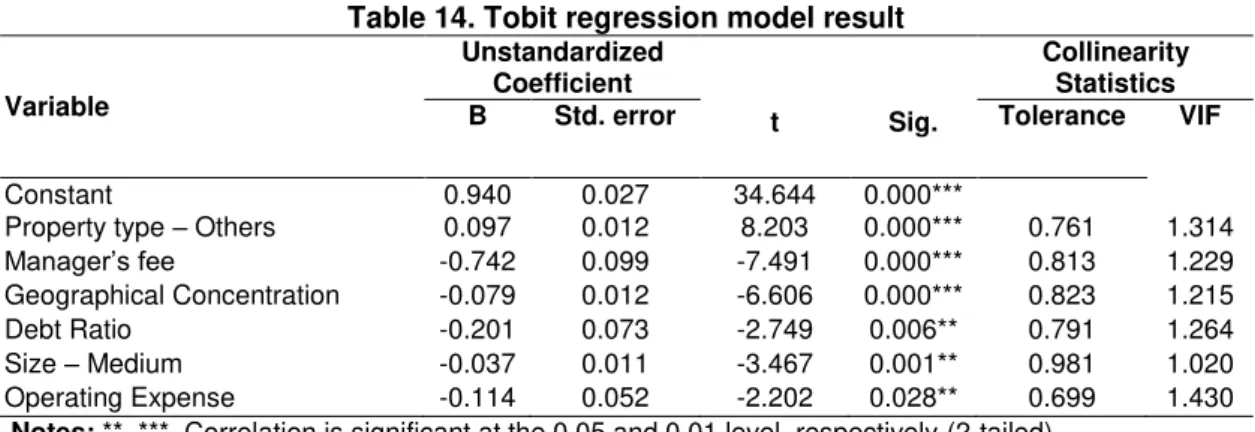
The result of Tobit regression model is shown in Table 14.
Table 14. Tobit regression model result
Variable
Unstandardized Coefficient
t Sig.
Collinearity Statistics
B Std. error Tolerance VIF
Constant 0.940 0.027 34.644 0.000***
Property type – Others 0.097 0.012 8.203 0.000*** 0.761 1.314
Manager’s fee -0.742 0.099 -7.491 0.000*** 0.813 1.229
Geographical Concentration -0.079 0.012 -6.606 0.000*** 0.823 1.215
Debt Ratio -0.201 0.073 -2.749 0.006** 0.791 1.264
Size – Medium -0.037 0.011 -3.467 0.001** 0.981 1.020
Operating Expense -0.114 0.052 -2.202 0.028** 0.699 1.430
Notes: **, ***. Correlation is significant at the 0.05 and 0.01 level, respectively (2-tailed).
DEA efficiency scores are regressed against several factors that the researcher’s has
proven to affect efficiency level such as the property type-others, manager’s fee, geographical concentration – Singapore, debt ratio, size-medium, and operating expense. The result shows the coefficients for these factors are 0.097, -0.742, -0.079, -0.201, -0.037, -0.114 respectively. The variables are all statistically significant. In addition, the VIF in table 14 shows that there is no collinearity problem between these variables.
4. Conclusion
This paper presented a DEA analysis that was supported by the Tobit regression analysis to examine the efficiency level of Singapore REITs over the period of 2007 to first quarter of 2015. First of all, the researcher found that First REIT is the most efficient REIT, followed by Capita Commercial Trust. Cambridge Industrial Trust and Ascendas REIT are the most inconsistent in performance over the years as shown by the standard deviation. ROA is also positively correlated to efficiency while the opposite applies to debt ratio. From here, the researcher concludes that REITs are not able to make use of their leverage to improve efficiency level, hence, it is recommended for REITs to minimize their debt as much as possible.
Secondly, regarding property-type, retail performed better than commercial on average.
However, the most efficient group is “others” which consists of 1 hospitality/residential REITs, 1
healthcare REITs, and 3 industrial REITs. Apart from Mapletree Logistics Trust, other REITs in
the “others” category performs better than the average REITs of other categories.
Thirdly, geographical diversification does not seem to affect REIT’s efficiency. Fourthly,
19
Tobit Regression Analysis also supported earlier findings by DEA where apart from
ROA, variables such as manager’s fee, market concentration – Singapore, debt ratio, size-medium, and operating expense has a negative impact on efficiency.
Future studies may want to look at Interest Expense as well as General and Administrative Expense as inputs because they are cost sources of REITs too. In addition, as there is a lack of sample in the hospitality, healthcare, and industrial sectors, further studies need to include more REITs in these categories to assess whether these sectors have better efficiency level than others. Having more REITs whose portfolio is concentrated in other countries e.g. China, Indonesia, etc will allow investors to compare between countries as well. In this research paper, only REITs that exist continuously between 2007 to 2005 (Q1) are used, hence, expanding the sample number of REITs can be done through shortening data collection years as only in recent years did many S-REITs enter the market. Finally, other approaches (e.g. SFA) can be used instead to assess efficiency of REITs in order to check for robustness of
this paper’s results.
References
Aly, H.Y., Grabowski, R., Pasurka, C., and Rangan, N., 1990. Technical, scale, and allocative efficiencies in US banking: An empirical investigation. The Review of Economics and Statistics, 72(2), pp.211-218. http://dx.doi.org/10.2307/2109710
Anderson, R. I., Benefield, J. D.,and Hurst, M. E., 2015. Property-type diversification and REIT performance: An analysis of operating performance and abnormal returns. Journal of Economics and Finance, 39(1), pp.48-74. http://dx.doi.org/10.1007/s12197-012-9232-0 Anderson, R. I., Fok, R., Springer, T., and Webb, J., 2002. Technical efficiency and economies
of scale: A non-parametric analysis of REIT operating efficiency. European Journal of Operational Research, 139(3), pp.598-612. http://dx.doi.org/10.1016/S0377-2217(01)00183-7
Anderson, R., Fok, R., Zumpano, L.,and Elder, H., 1998. Measuring the efficiency of residential real estate brokerage firms. Journal of Real Estate Research, 16(2), pp.139-158.
Barry, T. A., Dacanay, S.J.O.I., Lepetit, L., and Tarazi, A., 2010. Ownership structure and bank efficiency in six Asian countries. Philippine Management Review (Special Issue), 18, pp.19-35.
Berger, A. N. and Humphrey, D. B., 1990. Measurement and efficiency issues in commercial banking. Output Measurement in the Services Sectors, pp.245 - 300.
Bers, M. and Springer, T. M., 1998. Differences in scale economies among real estate investment trusts: More evidence. Real Estate Finance, 15, pp.37-44.
Bers, M. and Springer, T., 1997. Economies-of-scale for real estate investment trusts. Journal of Real Estate Research, 14(3), pp.275-290.
Bogetoft, P. and Otto, L. 2010. Benchmarking with DEA, SFA, and R. Switzerland: Springer International Series in Operations Research & Management Science.
Bowlin, W. F., 1998. Measuring performance: An introduction to data envelopment analysis (DEA). The Journal of Cost Analysis, 15(2), pp.3-27. http://dx.doi.org/10.1080/08823871.1998.10462318
Campbell, R.D., Petrova, M. andSirmans, C.F., 2003. Wealth effects of diversification and financial deal structuring: Evidence from REIT property portfolio acquisitions. Real Estate Economics, 31(3), pp.347-366. http://dx.doi.org/10.1111/1540-6229.00069 Capozza, D. and Lee, S. 1995. Property type, size and REIT value. The Journal of Real Estate
Research, 10(4), pp.363-379.
Dyson, R.G., Allen, R., Camanho, A.S., Podinovski, V.V., Sarrico, C.S., and Shale, E.A., 2001. Pitfalls and protocols in DEA. European Journal of operational research, 132(2), pp.245-259. http://dx.doi.org/10.1016/S0377-2217(00)00149-1
Golany, B. and Roll, Y., 1989. An application procedure for DEA. Omega, 17(3), pp.237-250. http://dx.doi.org/10.1016/0305-0483(89)90029-7
20
European Journal of Operational Research, 181(1), pp.425-435. http://dx.doi.org/10.1016/j.ejor.2006.05.019
Jin, N.K., 2000. Coping with the Asian financial crisis: The Singapore experience. Institute of Southeast Asian Studies, 8.
Keke, O. V. and Emoh, F. I., 2015. Real estate investment trusts (REITs) and mortgage backed securities (MBS) as emerging trends for financing real estate development in the Nigerian capital market. International Journal of Civil Engineering, Construction and Estate Management, 3(2), pp.1-7.
Miller, S.M. and Springer, T.M. 2007. Cost Improvements, Returns to Scale, and Cost Inefficiencies for Real Estate Investment Trusts. University of Connecticut Working Paper Series, No. 2007-05.
Miller, S.M., Clauretie, T.M., and Springer, T.M., 2006. Economies of scale and cost efficiencies: A panel-data stochastic-frontier analysis of real estate investment trusts. The Manchester School, 74(4), pp.483-499. http://dx.doi.org/10.1111/j.1467-9957.2006.00505.x
Mueller, G.R. and Laposa, S.P., 1996. REIT returns: A property-type perspective. Real Estate Finance, 13, pp. 45-55.
Newell, G., Liow, K.H., Ooi, J., and Zhu, H., 2005. The impact of information transparency and market capitalization on out-performance in Asian property companies. Pacific Rim
Property Research Journal, 11(4), pp.393-411.
http://dx.doi.org/10.1080/14445921.2005.11104194
Ooi, J. T., Newell, G., and Sing, T., 2006. The growth of REIT markets in Asia. Journal of Real Estate Literature, 14(2), pp.203-222.
Pande, S. and Patel, G.N., 2013. Assessing cost efficiency of pharmacy retail stores and identification of efficiency drivers. International Journal of Business Performance Management, 14(4), pp.368-385. http://dx.doi.org/10.1504/IJBPM.2013.056774
Ro, S. and Ziobrowski, A.J., 2011. Does focus really matter? Specialized vs. diversified REITs. The Journal of Real Estate Finance and Economics, 42(1), pp. 68-83. http://dx.doi.org/10.1007/s11146-009-9189-8
Topuz, J.C. and Isik, I., 2009. Structural changes, market growth and productivity gains of the US real estate investment trusts in the 1990s. Journal of Economics and Finance, 33(3), pp.288-315. http://dx.doi.org/10.1007/s12197-008-9026-6
Topuz, J.C., Darrat, A.F., and Shelor, R.M., 2005. Technical, allocative and scale efficiencies of REITs: An empirical inquiry. Journal of Business Finance and Accounting, 32(9‐10), pp.1961-1994. http://dx.doi.org/10.1111/j.0306-686X.2005.00653.x