The impact of growth rate on the results of growth
and slaughter traits of young crossbred boars in
Poland in Bydgoszcz Breeding Region
Wpływ tempa wzrostu na wyniki cech tucznych i
rzeźnych knurków mieszańców ocenionych przyżyciowo
w Polsce w bydgoskim okręgu hodowlanym
Jerzy NOWACHOWICZ, Grażyna MICHALSKA, Przemysław Dariusz WASILEWSKI, Tomasz BUCEK
University of Technology and Life Sciences in Bydgoszcz, Faculty of Animal Breeding and Biology, Department of Animal Products Evaluation, Kordeckiego 20, 85-225 Bydgoszcz, Poland, E-mail: surzwierz@utp.edu.pl
ABSTRACT
There was analysed the impact of growth rate on the results of growth and slaughter traits of 3917 young crossbred boars performance tested in years 2004-2008 in Poland in The Bydgoszcz Breeding Region. They came from 8 following crossing variants, where sow’s breed was given in a irst position and boar’s breed in a second position: Hampshire x Belgian Landrace (H x BL), Hampshire x Duroc (H x D),
Hampshire x Pietrain (H x P), Duroc x Hampshire (D x H), Duroc x Pietrain (D x P), Pietrain x Hampshire (P x H), Pietrain x Duroc (P x D) and Line 990 x Pietrain (990 x P). The impact of growth rate on the results’ formation in the range of tested traits noted in different degrees. It was the most visible in the growth traits (age and body weight) and the performance test selection index and less visible in the slaughter traits, among which the most visible in case of the backfat thickness measured in P2 and P4 points and then in the meat content and the height of loin eye. In the
analyzed years tested young crossbred boars of the high growth rate, i.e. of high daily gain of body weight standardized on the 180th day of life were younger and generally obtained higher body weight and higher performance test selection index and in the majority of cases, where the statistically signiicant differences were proved, had thinner backfat in the P2 and P4 points and had lower meat content and the higher height of loin eye as compared to the animals of low growth rate.
Keywords: daily gain of body weight, backfat thickness, meat content, performance
test selection index, young crossbred boars
ABSTRAKT
których rasę lochy podano w pierwszej pozycji a knura w drugiej: hampshire x
belgijska zwisłoucha (h x bz), hampshire x duroc (h x d), hampshire x pietrain (h x p), duroc x hampshire (d x h), duroc x pietrain (d x p), pietrain x hampshire (p x h), pietrain x duroc (p x d) i linia 990 x pietrain (990 x p). Wpływ tempa wzrostu na kształtowanie się wyników w zakresie badanych cech zaznaczył się w różnym stopniu. Najbardziej był widoczny w cechach tucznych (wiek i masa ciała) oraz indeksie selekcyjnym oceny przyżyciowej a w mniejszym stopniu w cechach rzeźnych, spośród których najbardziej w przypadku grubości słoniny mierzonej w punktach P2 i P4 a następnie w zawartości mięsa i wysokości oka polędwicy. W analizowanych latach badane knurki mieszańce o wysokim tempie wzrostu, tj.
wysokim przyroście dobowym masy ciała standaryzowanym na 180. dzień życia były młodsze oraz osiągnęły na ogół większą masę ciała i wyższy indeks selekcyjny oceny przyżyciowej oraz w większości przypadków, w których udowodniono
statystycznie istotne różnice charakteryzowały się cieńszą słoniną w punktach P2 i P4 oraz mniejszą mięsnością i większą wysokością oka polędwicy w porównaniu ze zwierzętami o niskim tempie wzrostu.
Słowa kluczowe: przyrost dobowy masy ciała, grubość słoniny, mięsność, indeks selekcyjny oceny przyżyciowej, knurki mieszańce
DETAILED ABSTRACT
Wieloletnie intensywne prace hodowlane nad trzodą chlewną przyczyniły się do bardziej efektywnego wykorzystania paszy, zwiększenia przyrostu dobowego masy ciała prowadzącego do wzrostu odkładania białka w ciele i w konsekwencji do większego umięśnienia zwierząt. Jednak wyniki badań niektórych autorów sugerują, że zbyt wysokie tempo wzrostu może niekorzystnie wpływać na wartość rzeźną świń szczególnie przy żywieniu ad libitum, prowadząc do obniżenia mięsności i
zwiększenia otłuszczenia.
Celem pracy było określenie wpływu tempa wzrostu na wyniki cech tucznych i rzeźnych 3917 knurków mieszańców pochodzących z następujących wariantów krzyżowania, w których rasę lochy podano w pierwszej pozycji a knura w drugiej: hampshire x belgijska zwisłoucha (h x bz), hampshire x duroc (h x d), hampshire x pietrain (h x p), duroc x hampshire (d x h), duroc x pietrain (d x p), pietrain x
hampshire (p x h), pietrain x duroc (p x d) i linia 990 x pietrain (990 x p) ocenionych przyżyciowo w Polsce w bydgoskim okręgu hodowlanym w latach 2004-2008 zgodnie z obowiązującą metodyką. W zależności od tempa wzrostu knurki pochodzące z poszczególnych wariantów krzyżowania podzielono na dwie grupy o zróżnicowanym tempie wzrostu a więc charakteryzujące się niskim i wysokim przyrostem dobowym masy ciała według określonego schematu. Statystyczne opracowanie wyników
widoczny w cechach tucznych (wiek i masa ciała) oraz indeksie selekcyjnym oceny przyżyciowej a w mniejszym stopniu w cechach rzeźnych, spośród których
najbardziej w przypadku grubości słoniny mierzonej w punktach P2 i P4 a następnie w zawartości mięsa i wysokości oka polędwicy. W analizowanych latach badane knurki mieszańce o wysokim tempie wzrostu, tj. wysokim przyroście dobowym masy ciała standaryzowanym na 180. dzień życia były młodsze oraz osiągnęły na ogół większą masę ciała i wyższy indeks selekcyjny oceny przyżyciowej oraz w większości przypadków, w których udowodniono statystycznie istotne różnice (P≤0,01 lub
P≤0,05) charakteryzowały się cieńszą słoniną w punktach P2 i P4 oraz mniejszą mięsnością i większą wysokością oka polędwicy w porównaniu ze zwierzętami o niskim tempie wzrostu.
INTRODUCTION
Many years of intensive work on the pigs has contributed to more eficient use of feed, increase of the daily gain of body weight leading to raise of the body protein deposition and consequently to higher meat content of the animals (Cameron and Curran, 1995a, 1995b; Fuller et al., 1995). However, the results of some authors suggest that too high growth rate may unfavourable impact on the slaughter value of the pigs, especially with ad libitum feeding, leading to decrease of the meat content and increase of the fat content (Buczyński et al., 2001; Kanis, 1988; Kapelański et al., 2002; Knap, 1987; Michalska et al., 2002, 2003; Milewska and Falkowski 2001;
Urbańczyk et al., 1999). However, the studies of Gy, et al. (1992) and Cameron, et al. (1999) indicate that high growth rate of the pigs of high genetical capacity to the protein deposition does not impact on increase of the fat content.
In a modern breeding and rearing of the pigs crossbred boars are increasingly used, which as compared to the purebred animals are characterized by earlier puberty, higher testicular weight, higher volume of semen of better quality, higher breeding performance regarding to higher libido, higher insemination eficiency and the possibility to their longer use (Czarnecki et al., 1998; Fent et al., 1980; Kapelański, 1995; Koczanowski et al., 2001; Michalski and Polańska, 1983; Neely and Robison, 1983; Nowachowicz, 2004; Rak et al., 1993).
The results of performance test are one of the main criteria in selection-work when animals are chosen to breeding and producing herds (RóŜycki, 2003). The breeding value of performance tested pigs depends on their growth rate and the body meat content. The performance test has a special role in conducted selection, especially the male individuals, because of their breeding value depends largely on the level of productivity of breeding and mass livestock of the pigs. In the recent years, among the paternal components of pigs performance tested in Poland beside young
MATERIALS AND METHODS
The impact of growth rate on the results of growth and slaughter traits of 3917 young crossbred boars intended for further breeding has been examined. The animals were produced and performance tested in years 2004-2008 in Poland within The
Bydgoszcz Breeding Region (Kujawy-Pomorze Province) according to the obligatory methodology (Eckert and Szyndler-Nędza, 2005). The body meat content of young crossbred boars was estimated on the base of ultrasound measurements of the backfat thickness in the P2 and P4 points and the height of loin eye in the P4 measurement point, carried out using PIGLOG 105 apparatus.
Performance test selection index was calculated according to the formula (Eckert and Szyndler-Nędza, 2005):
IO = 0,1364 X1 + 4,7820X2 – 275,5944 where:
IO - paternal lines selection index
X1 – daily gain standardized on 180th day of life
X2 – percentage body meat content.
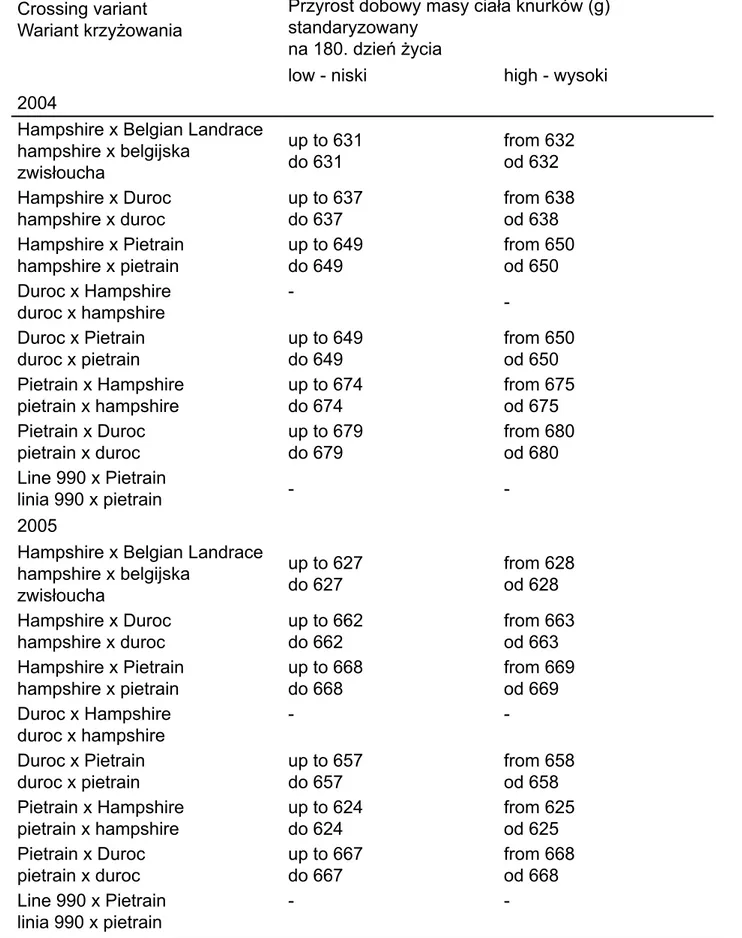
The young crossbred boars came from 8 following crossing variants, where sow’s breed was given in a irst position and boar’s breed in a second position: Hampshire x Belgian Landrace (H x BL), Hampshire x Duroc (H x D), Hampshire x Pietrain (H x P), Duroc x Hampshire (D x H), Duroc x Pietrain (D x P), Pietrain x Hampshire (P x H), Pietrain x Duroc (P x D) and Line 990 x Pietrain (990 x P). Depending on the growth rate, i.e. the height of daily gain of body weight standardized on the 180th day of life young crossbred boars came from different crossing variants were divided into two groups of different growth rate, thus of low and high daily gain of body weight according to the scheme given in Table 1. The number of tested animals was given in Tables 2-6.
The results were statistically elaborated using the one-way variance analysis.The signiicance of differences between the groups of different growth rate within each crossing variant in a particular year was veriied by t-Student’s test. The calculations were made using computer program Statistica 8.0 PL (2008).
RESULTS
and 2005, H x P in 2005, 990 x P in 2006 and H x D in 2007) as compared to the pigs of low growth rate (tables 2-6). The data regarding the daily gain of body weight standardized on 180th day of life (tables 2-6) clearly results that in the tested years in case of all crossing variants the differences between the groups of young boars of the low and high growth rate were high and statistically high signiicant.
The growth rate generally impacted on the standardized backfat thickness in the point P2 (tables 2-6). Detailed analysis of the results of the groups of pigs of low and high growth rate on 26 tested cases (regarding to particular year and the crossing variant) in 17 cases statistically high signiicant or statistically signiicant differences stated, among them in the majority of cases (12) young crossbred boars of the high growth rate had thinner backfat measured in the P2 point. It was observed in the following years in the animals from the groups: 2004 H x D; 2005 H x D, D x P; 2006 H x D, D x P; 2007 D x P, P x H, P x D; 2008 H x P, D x P, P x H, P x D. In 5 following cases the inverse relationship was observed: 2004 H x BL; 2005 H x BL, H x P, P x D; 2006 990 x P. Regarding to the backfat thickness in the P4 point (tables 2-6) it was also stated similar trends as in the backfat thickness measured in the point P2. It was observed that in case of 15 indicated signiicances of differences in the 11 cases young crossbred boars of the high growth rate had thinner backfat (2004 H x D; 2005 H x D; 2006 H x D, D x P; 2007 D x H, D x P, P x H, P x D; 2008 H x P, D x P, P x D). In the 4 cases opposite trend was observed, thus the animals of the high growth rate had thicker backfat (2004 D x P, P x H; 2005 H x P, P x D).
The impact of the growth rate on the results of the standardized height of loin eye in the P4 point was lower than on the fat content of pigs characterized on the base of the backfat thickness measurements in the P2 and P4 points (tables 2-6). In
analyzed years in the pigs from some crossing variants 10 signiicances of
daily gains of the body weight had higher body meat content: 2004 H x D; 2007 P x H; 2008 H x P, D x P, P x D.
In the analyzed period among tested crossing variants young boars of the high growth rate obtained higher value of the performance test selection index as compared to the animals of low daily gains of the body weight (tables 2-6). The
differences in this range between the groups of pigs of different growth rate were high and in the majority statistically high signiicant or signiicant.
DISCUSSION
In Poland and other countries conducted selection based on i.e. performance test results of pigs in the direction to increase the growth rate through the control of the daily gain of body weight and increase the meat content conducted on the base of the backfat thickness measurements and the height of loin eye caused a signiicant progress of the genetic value of animals (Bobček et al., 2002; Cameron and Curran, 1995b; Chen et al., 2003; McKay, 1990; RóŜycki, 2003). However, the obtained results should be analyzed currently, because too intensive increase of the
performance of pigs may cause disorders and changes in the genetic homeostasis of the relations between the groups of traits (Falkenberg et al., 1989). The results of performance test of tested young boars were presented in other publication (Michalska et al., 2010). There was observed, that regarding to the best results of growth and slaughter traits Hampshire x Pietrain crossing variant should be
recommended to young crossbred boars production and used as paternal component in crossing programs of the pigs.
(2001) forcing too high growth rate may cause decrease of the production pigs proitability.
CONCLUSIONS
Summarizing the obtained results it should be stated, that the impact of the growth rate on formation of the results in range of tested traits noted in the different degree. It was the most visible in the growth traits (age and body weight) and the
performance test selection index and the less visible in the slaughter traits, among them the most visible in case of the backfat thickness measured in the P2 and P4 points, than in the meat content and the height of loin eye. In the analyzed years tested young boars of the high growth rate, i.e. the high daily gain of the body weight standardized on the 180th day of life were younger and obtained generally higher body weight and higher performance test selection index and in the most cases where the statistically signiicant differences (P 0.01 or P 0.05) were proved, had thinner backfat in the points P2 and P4 and lower meat content and higher height of the loin eye as compared to the animals of low growth rate.
REFERENCES
Bobček B., Řeháček P., Flak P., Kováč L., Mlynek J., (2002) Comparison of
production traits of Large White and White Meaty pig breeds for 1996 to 2001 in Slovakia. Czech Journal Animal Science 47 (11), 451-459.
Buczyński J.T., Fajfer E., Panek A., Szulc K., (2001) Correlations between fattening and slaughter traits measured live after the irst and second phase of rearing Polish Large White breeding gilts. Annals of Animal Science, Supplement No. 1, 31-36.
Cameron N.D., Curran M.K., (1995a) Genotype with feeding regime interaction in pigs divergently selected for components of eficient lean growth rate. Animal Science 61, 123-132.
Cameron N.D., Curran M.K., (1995b) Responses in carcass composition to divergent selection for components of eficient lean growth rate in pigs. Animal Science 61, 347-359.
Cameron N.D., Penman J.C., Fisken A.C., Nute G.R., Perry A.M., Wood J.D., 1999 Genotype with nutrition interactions for carcass composition and meat quality in pig genotypes selected for components of eficient lean growth rate. Animal Science 69, 69-80.
Czarnecki R., Różycki M., Kamyczek M., Dziadek K., Kawęcka M., Owsianny J., (1998) The growth rate, meatness value and size of tests in young L 990 boars and hybrids of that strain with Duroc and Pietrain pigs., Book of Abstr. 4, 49th Ann. Meet. EAAP, Warsaw, 260.
Eckert R., Szyndler-Nędza M., (2005) Ocena przyżyciowa młodych knurów. W: Stan hodowli i wyniki oceny świń w roku 2004. Instytut Zootechniki Kraków, XXIII, 30-53.
Falkenberg H., Hammer H., Ritter E., (1989) Genetische und phenotypische
Beziehungen zwischen Merkmalen der Mast- und Ansatzleistung von Ebern in zentralen Aufzuchtstationen, der Besamungseignung dieser Tiere sowie der Wurleistung ihrer Schwestern. Archiv für Tierzucht, Dummerstorf 32 (2), 163-172.
Fandrejewski H., Raj S., Weremko D., Skiba G., (2001) Zagadnienie apetytu u rosnących świń z linii ojcowskich. Zeszyty Naukowe AR we Wrocławiu 405, 53-61.
Fent R.W., Wetteman R.P., Johnson R.K., (1980) Testicular characteristics of purebred and crossbred boars. Journal of Animal Science 51, 28-29.
Fischer R., Müller U., Bergfeld U., (2002) Genetic association for daily gain (lifetime) in an crossbreeding program. Archiv für Tierzucht 45, 5, 481-490.
Fuller M.F., Franklin M.F., Mcwilliam R., Pennie K., (1995) The responses of growing pigs, of different sex and genotype, to dietary energy and protein. Animal Science 60, 291-298.
Glodek P., Kratz R., Schulz E., Flachowsky G., (2004) Effect of sire breeds in commercial pig crosses on growth, carcass composition, meat and fat quality. Archiv für Tierzucht, Dummerstorf 47, 59-74.
Gy Y., Schinckel A.P., Martin T.G., (1992) Growth, development and carcass composition in ive genotypes of swine. Journal of Animal Science 70, 1719-1726.
Kanis E., (1988) Effect of average daily food intake on production performance in growing pigs. Animal Production 46, 111-122.
Kapelański W., (1995) Wielkość i sprężystość jąder knurków ras polskiej białej zwisłouchej i Duroc oraz ich mieszańców jako wczesny wskaźnik przydatności do rozpłodu. ATR Bydgoszcz, Rozprawy 67.
Kawęcka M., Pietruszka A., Jacyno E., Czarnecki R., Kamyczek M., (2008) Quality of semen of young boars of the breeds Pietrain and Duroc and their reciprocal crosses. Archiv für Tierzucht, Dummerstorf 51, 1, 42-54.
Koczanowski J., Migdał W., Klocek Cz., Tuz R., (2001) Wpływ wysokości przyrostów dziennych w poszczególnych okresach tuczu na jakość tuszy tuczników
mieszańców żywionych do woli. Annals of Animal Science, Supplement No. 1, 119-123.
Knap P.W., (1987) Performance of purebred Dutch Yorkshire boars versus crossbred Belgian Landrace x Dutch Yorkshire boars. A ield trial. Livestock Production Science 16, 1, 51-64.
McKay R.M., (1990) Responses to index selection for reduced backfat thickness and increased growth rate in swine. Canadian Journal of Animal Science 70, 973-977.
Michalska G., Nowachowicz J., Bucek T., Wasilewski P.D., (2010) Wyniki oceny przyżyciowej knurków mieszańców F1 pochodzących z bydgoskiego okręgu hodowlanego. Roczniki Naukowe Polskiego Towarzystwa Zootechnicznego 6, 2, 31-39.
Michalska G., Nowachowicz J., Chojnacki Z., Bucek T., Wasilewski P.D., (2002) The impact of growth rate on the results of performance testing of Polish Large White pigs. Annals of Animal Science, Supplement No. 2, 63-66.
Michalska G., Nowachowicz J., Chojnacki Z., Wasilewski P.D., Bucek T., (2003) The impact of value of daily gains of body weight on meat content of pigs of different breeds. Acta Scientiarum Polonorum, Zootechnica 2 (2), 77-84.
Michalski Z., Polańska E., (1983) Charakterystyka nasienia knurów w wieku 6-8 miesięcy ras czystych i mieszańców dwurasowych. Roczniki Naukowe Zootechniki 10, 2, 11-18.
Milewska W., Falkowski J., (2001) Analiza wyników oceny przyżyciowej knurków czystorasowych i mieszańców F1 pochodzących z chlewni rejonu OSHZ w Olsztynie w latach 1995-1998. Zeszyty Naukowe AR we Wrocławiu 405, 181-188.
Neely J.D., Robison O.W., (1983) Estimates of heterosis for sexual activity in boars.
Journal of Animal Science 56, 1033-1038.
Rak B., Kapelański W., Biegniewski J., Michalska G., (1993) Przydatność do rozpłodu knurów mieszańców ras Duroc i polskiej białej zwisłouchej. Zeszyty Naukowe Przeglądu Hodowlanego 9, 124-130.
Różycki M., (2003) Selected traits of Polish pedigree pigs - progress in the carcass meat deposition and meat quality. Animal Science Papers and Reports, Vol. 21, Supplement 1, 163-171.
Statistica ARSL 8.0 PL, StatSoft Polska, (2008).
Urbańczyk J., Hanczakowska E., Świątkiewicz M., (1999) Wpływ genotypu na
Tabela 1. Podział knurków mieszańców na grupy o zróżnicowanym tempie wzrostu
Crossing variant Wariant krzyżowania
Daily gain of body weight (g) standardized on 180th day of life
Przyrost dobowy masy ciała knurków (g) standaryzowany
na 180. dzień życia
low - niski high - wysoki
2004
Hampshire x Belgian Landrace hampshire x belgijska
zwisłoucha
up to 631
do 631 from 632 od 632
Hampshire x Duroc
hampshire x duroc up to 637 do 637 from 638 od 638
Hampshire x Pietrain
hampshire x pietrain up to 649 do 649 from 650 od 650
Duroc x Hampshire
duroc x hampshire -
-Duroc x Pietrain
duroc x pietrain up to 649 do 649 from 650 od 650
Pietrain x Hampshire
pietrain x hampshire up to 674 do 674 from 675 od 675
Pietrain x Duroc
pietrain x duroc up to 679 do 679 from 680 od 680
Line 990 x Pietrain
linia 990 x pietrain -
-2005
Hampshire x Belgian Landrace hampshire x belgijska
zwisłoucha
up to 627
do 627 from 628 od 628
Hampshire x Duroc
hampshire x duroc up to 662 do 662 from 663 od 663
Hampshire x Pietrain
hampshire x pietrain up to 668 do 668 from 669 od 669
Duroc x Hampshire
duroc x hampshire - -
Duroc x Pietrain
duroc x pietrain up to 657 do 657 from 658 od 658
Pietrain x Hampshire
pietrain x hampshire up to 624 do 624 from 625 od 625
Pietrain x Duroc
2006
Hampshire x Belgian Landrace hampshire x belgijska
zwisłoucha
-
-Hampshire x Duroc
hampshire x duroc up to 637 do 637 from 638 od 638
Hampshire x Pietrain
hampshire x pietrain up to 667 do 667 from 668 od 668
Duroc x Hampshire
duroc x hampshire -
-Duroc x Pietrain
duroc x pietrain up to 650 do 650 from 651 od 651
Pietrain x Hampshire
pietrain x hampshire -
-Pietrain x Duroc
pietrain x duroc -
-Line 990 x Pietrain
linia 990 x pietrain up to 614 do 614 from 615 od 615
2007
Hampshire x Belgian Landrace hampshire x belgijska
zwisłoucha -
-Hampshire x Duroc
hampshire x duroc up to 759 do 759 from 760 od 760
Hampshire x Pietrain
hampshire x pietrain up to 730 do 730 from 731 od 731
Duroc x Hampshire
duroc x hampshire up to 797 do 797 from 798 od 798
Duroc x Pietrain
duroc x pietrain up to 664 do 664 from 665 od 665
Pietrain x Hampshire
pietrain x hampshire up to 605 do 605 from 606 od 606
Pietrain x Duroc
pietrain x duroc up to 626 do 626 from 627 od 627
Line 990 x Pietrain
linia 990 x pietrain - -
2008
Hampshire x Belgian Landrace hampshire x belgijska
zwisłoucha
- -
Hampshire x Duroc
Hampshire x Pietrain
hampshire x pietrain up to 731 do 731 from 732 od 732
Duroc x Hampshire
duroc x hampshire - -
Duroc x Pietrain
duroc x pietrain up to 688 do 688 from 689 od 689
Pietrain x Hampshire
pietrain x hampshire up to 610 do 610 from 611 od 611
Pietrain x Duroc
pietrain x duroc up to 608 do 608 from 609 od 609
Line 990 x Pietrain
Tabela 2. Wyniki cech tucznych i rzeźnych badanych knurków mieszańców poddanych ocenie przyżyciowej w 2004 roku
Traits Cechy
The daily gain of body weight of young boars standardized on 180th day of life (g) Przyrost dobowy masy ciała knurków standaryzowany na 180. dzień życia (g) H x BL
h x bz H x D h x d H x P h x p D x P d x p P x H p x h P x D p x d
low niski high wysoki total łącznie low niski wysokihigh total łącznie low niski high wysoki total łącznie low niski high wysoki total łącznie low niski wysokihigh total łącznie low niski high wysoki total łącznie
Number, n
Liczebność, szt. 9 9 18 16 18 34 16 14 30 46 46 92 31 27 58 42 40 82
Age on test day Wiek w dniu oceny
x
s
172.33a
0.50 166.11b 7.70 169.22 6.19 161.19 4.69 9.81158.72 159.88 7.82 181.13a 11.59 170.00b 13.18 175.93 13.39 183.65A 13.72 164.39B 10.81 174.02 15.64 171.26A 8.79 8.41164.15B 167.95 9.26 177.98A 12.49 167.90B 10.44 173.06 12.54
Body weight on test day Masa ciała w dniu oceny
x
s
105.56
0.88 104.11 4.43 104.83 3.19 92.06A 5.62 9.21101.06B 96.82 8.88 108.56 7.91 111.64 13.48 110.00 10.78 106.24A 8.69 112.02B 8.92 109.13 9.23 105.48 10.75 8.91108.19 106.74 9.95 108.98A 9.23 116.08B 11.02 112.44 10.69 Daily gain of body weight
standardized on 180th day of life Przyrost dobowy masy ciała standaryzowany na 180. dzień życia
x
s
626.44A
4.82 655.67B 20.95 641.06 21.06 607.13A 14.93 40.80684.83B 648.26 50.09 600.19A 36.80 677.50B 15.96 636.27 48.51 577.15A 49.05 719.76B 57.78 648.46 89.34 632.10A 33.02 11.75693.37B 660.62 39.84 619.48A 48.49 719.13B 43.90 668.09 68.04
Standardized backfat thickness in P2 point
Standaryzowana grubość słoniny w punkcie P2
x
s 7.78a
0.67 8.67b 0.87 8.22 0.88 10.69A 1.74 0.798.83B 9.71 1.61 8.81 1.22 8.43 1.34 8.63 1.27 9.59 1.68 9.63 1.48 9.61 1.58 9.45 1.65 1.608.89 9.19 1.64 8.88 1.55 9.05 1.30 8.96 1.43
Standardized backfat thickness in P4 point
Standaryzowana grubość słoniny w punkcie P4,
x
s 9.67
1.32 10.44 1.01 10.06 1.21 12.31a 1.82 0.7311.22b 11.74 1.44 10.38 1.02 10.21 1.42 10.30 1.21 9.33A 1.59 10.48B 1.85 9.90 1.81 9.97a 2.14 1.7411.11b 10.50 2.03 9.83 1.81 9.60 1.61 9.72 1.71
Standardized height of loin eye in P4 point
Standaryzowana wysokość oka polędwicy w punkcie P4
x
s 50.89
3.06 52.67 1.41 51.78 2.49 55.69 2.68 2.9657.22 56.50 2.89 52.81 2.97 53.86 2.48 53.30 2.76 52.04A 4.41 54.39B 4.17 53.22 4.42 54.06a 3.90 4.1056.59b 55.24 4.16 52.60 4.31 54.10 3.02 53.33 3.79
Standardized body meat content Standaryzowana zawartość mięsa w ciele
x
s 57.59
0.83 57.33 1.06 57.46 0.93 56.15A 1.49 1.1557.96B 57.11 1.59 58.64 1.68 58.36 1.63 58.51 1.64 58.74A 1.86 57.33B 1.44 58.03 1.80 58.10 1.78 1.3058.11 58.10 1.56 58.51 2.28 58.22 1.58 58.37 1.96
Performance test selection index Indeks selekcyjny oceny przyżyciowej
x
s 85.33
3.74 88.11 3.76 86.72 3.91 75.75A 7.82 6.6694.94B 85.91 12.05 86.63A 9.22 95.79B 8.07 90.90 9.73 84.04A 6.86 96.72B 10.70 90.38 10.98 88.39A 10.61 6.2096.96B 92.38 9.77 90.19A 13.96 100.88B 7.89 95.40 12.55
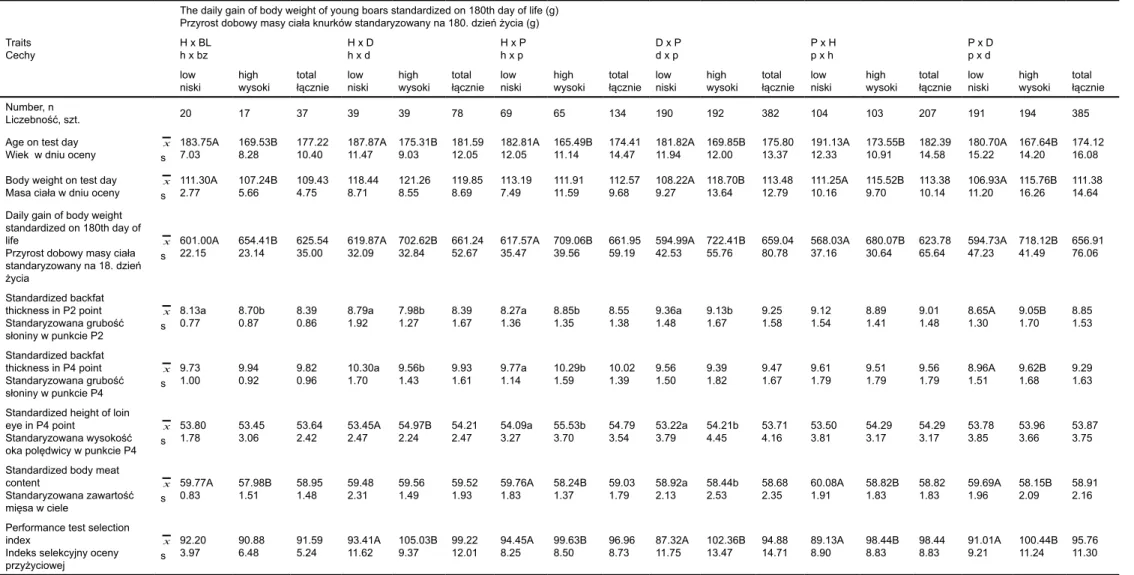
Tabela 3. Wyniki cech tucznych i rzeźnych badanych knurków mieszańców poddanych ocenie przyżyciowej w 2005 roku
Traits Cechy
The daily gain of body weight of young boars standardized on 180th day of life (g) Przyrost dobowy masy ciała knurków standaryzowany na 180. dzień życia (g) H x BL
h x bz H x D h x d H x P h x p D x P d x p P x H p x h P x D p x d
low
niski high wysoki total łącznie low niski wysokihigh total łącznie low niski high wysoki total łącznie low niski high wysoki total łącznie low niski wysokihigh total łącznie low niski high wysoki total łącznie Number, n
Liczebność, szt. 20 17 37 39 39 78 69 65 134 190 192 382 104 103 207 191 194 385
Age on test day Wiek w dniu oceny
x
s
183.75A
7.03 169.53B 8.28 177.22 10.40 187.87A 11.47 9.03175.31B 181.59 12.05 182.81A 12.05 165.49B 11.14 174.41 14.47 181.82A 11.94 169.85B 12.00 175.80 13.37 191.13A 12.33 10.91173.55B 182.39 14.58 180.70A 15.22 167.64B 14.20 174.12 16.08
Body weight on test day Masa ciała w dniu oceny
x
s
111.30A
2.77 107.24B 5.66 109.43 4.75 118.44 8.71 8.55121.26 119.85 8.69 113.19 7.49 111.91 11.59 112.57 9.68 108.22A 9.27 118.70B 13.64 113.48 12.79 111.25A 10.16 9.70115.52B 113.38 10.14 106.93A 11.20 115.76B 16.26 111.38 14.64 Daily gain of body weight
standardized on 180th day of life
Przyrost dobowy masy ciała standaryzowany na 18. dzień życia
x
s
601.00A
22.15 654.41B 23.14 625.54 35.00 619.87A 32.09 32.84702.62B 661.24 52.67 617.57A 35.47 709.06B 39.56 661.95 59.19 594.99A 42.53 722.41B 55.76 659.04 80.78 568.03A 37.16 30.64680.07B 623.78 65.64 594.73A 47.23 718.12B 41.49 656.91 76.06
Standardized backfat thickness in P2 point Standaryzowana grubość słoniny w punkcie P2
x
s 8.13a
0.77 8.70b 0.87 8.39 0.86 8.79a 1.92 1.277.98b 8.39 1.67 8.27a 1.36 8.85b 1.35 8.55 1.38 9.36a 1.48 9.13b 1.67 9.25 1.58 9.12 1.54 1.418.89 9.01 1.48 8.65A 1.30 9.05B 1.70 8.85 1.53
Standardized backfat thickness in P4 point Standaryzowana grubość słoniny w punkcie P4
x
s 9.73
1.00 9.94 0.92 9.82 0.96 10.30a 1.70 1.439.56b 9.93 1.61 9.77a 1.14 10.29b 1.59 10.02 1.39 9.56 1.50 9.39 1.82 9.47 1.67 9.61 1.79 1.799.51 9.56 1.79 8.96A 1.51 9.62B 1.68 9.29 1.63
Standardized height of loin eye in P4 point
Standaryzowana wysokość oka polędwicy w punkcie P4
x
s 53.80
1.78 53.45 3.06 53.64 2.42 53.45A 2.47 2.2454.97B 54.21 2.47 54.09a 3.27 55.53b 3.70 54.79 3.54 53.22a 3.79 54.21b 4.45 53.71 4.16 53.50 3.81 3.1754.29 54.29 3.17 53.78 3.85 53.96 3.66 53.87 3.75
Standardized body meat content
Standaryzowana zawartość mięsa w ciele
x
s
59.77A
0.83 57.98B 1.51 58.95 1.48 59.48 2.31 1.4959.56 59.52 1.93 59.76A 1.83 58.24B 1.37 59.03 1.79 58.92a 2.13 58.44b 2.53 58.68 2.35 60.08A 1.91 1.8358.82B 58.82 1.83 59.69A 1.96 58.15B 2.09 58.91 2.16
Performance test selection index
Indeks selekcyjny oceny
x
s 92.20
Tabela 4. Wyniki cech tucznych i rzeźnych badanych knurków mieszańców poddanych ocenie przyżyciowej w 2006 roku
Traits Cechy
The daily gain of body weight of young boars standardized on 180th day of life (g) Przyrost dobowy masy ciała knurków standaryzowany na 180. dzień życia (g) H x D
h x d H x P h x p D x P d x p 990 x P 990 x p
low
niski high wysoki total łącznie low niski high wysoki total łącznie low niski high wysoki total łącznie low niski high wysoki total łącznie Number, n
Liczebność, szt. 37 39 76 36 32 68 241 246 487 13 11 24
Age on test day Wiek w dniu oceny
x
s
189.95A
6.48 183.18B 6.22 186.47 7.17 188.81a 10.41 182.25b 10.14 185.72 10.76 186.05A 13.14 174.79B 12.32 180.36 13.92 197.62A 7.04 174.64B 7.09 187.08 13.58
Body weight on test day Masa ciała w dniu oceny
x
s
119.95A
5.86 126.03B 6.62 123.07 6.93 118.92A 11.61 129.91B 12.58 124.09 13.20 111.95A 11.84 123.61B 13.26 117.84 13.86 117.69 6.40 114.36 4.48 116.17 5.74 Daily gain of body weight
standardized on 180th day of life Przyrost dobowy masy ciała standaryzowany na 180. dzień życia
x
s
616.03A
13.76 682.97B 32.35 650.38 41.90 616.64A 39.16 708.72B 32.95 659.97 58.72 594.63A 45.27 720.07B 51.00 658.00 79.15 572.08A 27.77 667.18B 40.91 615.67 58.93
Standardized backfat thickness in P2 point
Standaryzowana grubość słoniny w punkcie P2
x
s 8.11A
0.82 7.55B 0.87 7.82 0.89 8.02 1.02 7.84 0.85 7.93 0.94 9.41A 1.61 8.56B 1.77 8.98 1.75 8.15a 1.26 9.07b 0.75 8.57 1.14
Standardized backfat thickness in P4 point
Standaryzowana grubość słoniny w punkcie P4
x
s 9.70A
0.90 8.38B 1.31 9.02 1.30 8.89 1.59 8.78 1.35 8.84 1.47 9.51A 1.29 9.09B 1.50 9.30 1.41 10.05 1.61 9.99 1.45 10.02 1.50
Standardized height of loin eye in P4 point
Standaryzowana wysokość oka polędwicy w punkcie P4
x
s 54.79
2.65 55.54 3.03 55.18 2.86 56.23 5.42 56.17 4.24 56.20 4.87 54.77A 3.79 56.13B 3.99 55.46 3.94 53.75a 4.04 57.95b 5.44 55.67 5.09
Standardized body meat content Standaryzowana zawartość mięsa w ciele
x
s 60.74
1.13 61.22 1.42 60.98 1.30 61.60 1.44 61.06 1.33 61.35 1.40 59.89 2.35 59.91 2.36 59.90 2.35 61.02a 1.49 59.80b 1.29 60.46 1.51
Performance test selection index Indeks selekcyjny oceny przyżyciowej
x
s
98.81A
6.16 110.26B 8.90 104.68 9.57 103.11A 8.60 113.09B 7.14 107.81 9.35 91.90A 12.42 109.13B 12.79 100.60 15.26 94.31a 8.79 101.27b 6.40 97.50 8.41
Tabela 5. Wyniki cech tucznych i rzeźnych badanych knurków mieszańców poddanych ocenie przyżyciowej w 2007 roku
Traits Cechy
The daily gain of body weight of young boars standardized on 180th day of life (g) Przyrost dobowy masy ciała knurków standaryzowany na 180. dzień życia (g) H x D
h x d H x P h x p D x H d x h D x P d x p P x H p x h P x D p x d
low
niski high wysoki total łącznie low niski wysokihigh total łącznie low niski high wysoki total łącznie low niski high wysoki total łącznie low niski wysokihigh total łącznie low niski high wysoki total łącznie Number, n
Liczebność, szt. 13 13 26 29 25 54 8 9 17 268 247 515 48 49 97 93 92 185
Age on test day Wiek w dniu oceny
x
s
189.00A
7.27 169.69B 6.58 179.35 11.96 187.03A 5.68 11.80177.00B 182.39 10.28 181.00 3.51 178.56 3.09 179.71 3.42 185.57A 11.86 176.17B 10.20 181.06 12.04 192.60A 9.18 11.50177.86B 185.15 12.74 191.65A 14.10 181.79B 13.62 186.75 14.68
Body weight on test day Masa ciała w dniu oceny
x
s
138.69A
11.18 135.62B 10.47 137.15 10.72 125.52 13.73 11.60138.56 131.56 14.27 138.88A 3.14 149.89B 10.23 144.71 9.42 113.85A 12.10 126.66B 11.53 119.99 13.44 109.15A 6.62 15.68125.86B 117.59 14.66 108.80A 16.01 132.65B 15.98 120.66 19.94 Daily gain of body weight
standardized on 180th day of life Przyrost dobowy masy ciała standaryzowany na 180. dzień życia
x
s
717.69A
45.68 824.46B 34.70 771.08 67.41 658.21A 56.89 40.02792.16B 720.22 83.55 765.88A 27.18 842.56B 45.41 806.47 53.95 606.12A 44.68 728.70B 49.03 664.91 77.10 550.58A 27.61 61.24712.39B 632.32 94.13 551.84A 51.62 728.55B 66.94 639.72 106.76
Standardized backfat thickness in P2 point
Standaryzowana grubość słoniny w punkcie P2
x
s 7.02
1.25 6.95 1.09 6.98 1.15 7.26 1.05 0.926.79 7.04 1.01 7.00 0.95 6.62 1.03 6.80 0.98 9.02A 1.52 8.14B 1.70 8.60 1.66 9.60A 1.41 1.297.60B 8.59 1.68 9.27A 1.66 7.68B 1.47 8.48 1.76
Standardized backfat thickness in P4 point
Standaryzowana grubość słoniny w punkcie P4
x
s 7.98
1.55 7.02 1.36 7.50 1.51 8.16 1.25 1.648.02 8.09 1.43 8.34a 0.48 7.41b 0.99 7.85 0.91 9.08A 1.36 8.71B 1.55 8.90 1.46 9.49A 1.45 1.458.44B 8.96 1.54 8.83A 1.49 8.07B 1.42 8.45 1.50
Standardized height of loin eye in P4 point
Standaryzowana wysokość oka polędwicy w punkcie P4
x
s 57.31
4.08 57.26 2.60 57.28 3.35 57.58 4.75 3.8857.91 57.73 4.33 58.55 2.32 56.64 2.84 57.54 2.71 55.45A 4.04 56.79B 4.15 56.09 4.14 54.83A 2.75 2.8956.76B 55.81 2.97 54.93 3.49 56.00 3.98 55.46 3.77
Standardized body meat content Standaryzowana zawartość mięsa w ciele
x
s 62.89
1.84 61.50 1.13 62.20 1.66 62.55a 1.79 1.5162.04b 62.31 1.67 62.34 0.95 62.04 0.76 62.18 0.84 60.46 2.22 60.61 2.12 60.53 2.18 60.45a 1.59 1.8661.15b 60.80 1.76 60.92 1.90 61.41 2.05 61.16 1.99
Performance test selection index Indeks selekcyjny oceny przyżyciowej
x
s
122.85A
13.03 131.08B 7.65 126.96 11.28 113.38 11.35 8.30129.20 120.70 12.75 127.00a 5.18 135.89b 7.46 131.71 7.78 96.17A 12.81 113.62B 12.00 104.54 15.18 88.54A 7.11 12.95114.02B 101.41 16.51 91.01A 12.70 117.46B 15.06 104.16 19.20
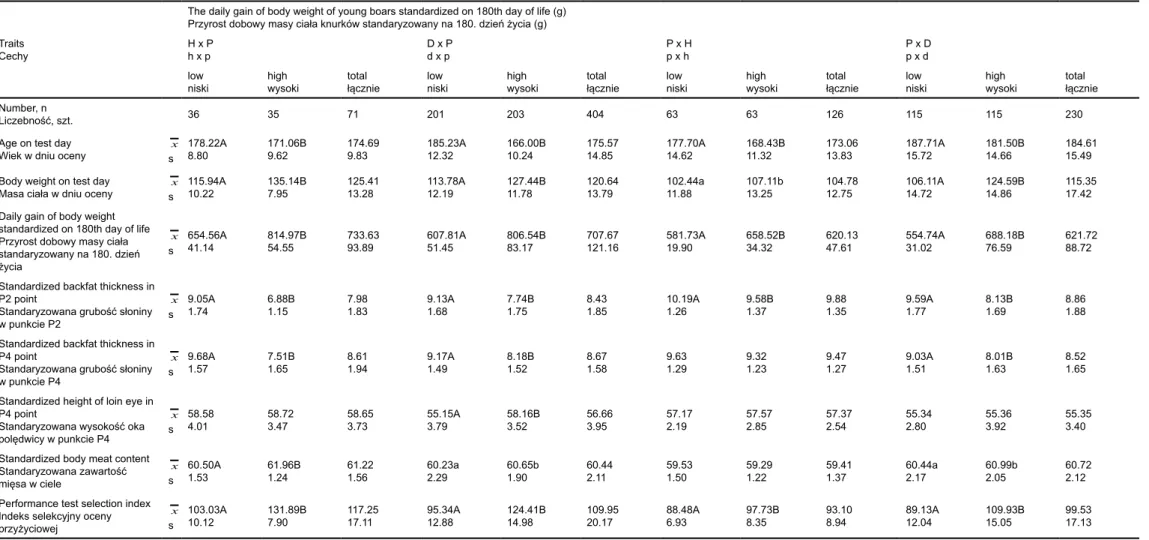
Table 6. The results of growth and slaughter traits of tested young crossbred boars performance tested in year 2008 Tabela 6. Wyniki cech tucznych i rzeźnych badanych knurków mieszańców poddanych ocenie przyżyciowej w 2008 roku
Traits Cechy
The daily gain of body weight of young boars standardized on 180th day of life (g) Przyrost dobowy masy ciała knurków standaryzowany na 180. dzień życia (g) H x P
h x p D x P d x p P x H p x h P x D p x d
low
niski high wysoki total łącznie low niski high wysoki total łącznie low niski high wysoki total łącznie low niski high wysoki total łącznie Number, n
Liczebność, szt. 36 35 71 201 203 404 63 63 126 115 115 230
Age on test day Wiek w dniu oceny
x
s
178.22A
8.80 171.06B 9.62 174.69 9.83 185.23A 12.32 166.00B 10.24 175.57 14.85 177.70A 14.62 168.43B 11.32 173.06 13.83 187.71A 15.72 181.50B 14.66 184.61 15.49
Body weight on test day Masa ciała w dniu oceny
x
s
115.94A
10.22 135.14B 7.95 125.41 13.28 113.78A 12.19 127.44B 11.78 120.64 13.79 102.44a 11.88 107.11b 13.25 104.78 12.75 106.11A 14.72 124.59B 14.86 115.35 17.42 Daily gain of body weight
standardized on 180th day of life Przyrost dobowy masy ciała standaryzowany na 180. dzień życia
x
s
654.56A
41.14 814.97B 54.55 733.63 93.89 607.81A 51.45 806.54B 83.17 707.67 121.16 581.73A 19.90 658.52B 34.32 620.13 47.61 554.74A 31.02 688.18B 76.59 621.72 88.72
Standardized backfat thickness in P2 point
Standaryzowana grubość słoniny w punkcie P2
x
s 9.05A
1.74 6.88B 1.15 7.98 1.83 9.13A 1.68 7.74B 1.75 8.43 1.85 10.19A 1.26 9.58B 1.37 9.88 1.35 9.59A 1.77 8.13B 1.69 8.86 1.88
Standardized backfat thickness in P4 point
Standaryzowana grubość słoniny w punkcie P4
x
s 9.68A
1.57 7.51B 1.65 8.61 1.94 9.17A 1.49 8.18B 1.52 8.67 1.58 9.63 1.29 9.32 1.23 9.47 1.27 9.03A 1.51 8.01B 1.63 8.52 1.65
Standardized height of loin eye in P4 point
Standaryzowana wysokość oka polędwicy w punkcie P4
x
s 58.58
4.01 58.72 3.47 58.65 3.73 55.15A 3.79 58.16B 3.52 56.66 3.95 57.17 2.19 57.57 2.85 57.37 2.54 55.34 2.80 55.36 3.92 55.35 3.40
Standardized body meat content Standaryzowana zawartość mięsa w ciele
x
s
60.50A
1.53 61.96B 1.24 61.22 1.56 60.23a 2.29 60.65b 1.90 60.44 2.11 59.53 1.50 59.29 1.22 59.41 1.37 60.44a 2.17 60.99b 2.05 60.72 2.12
Performance test selection index Indeks selekcyjny oceny przyżyciowej
x
s
103.03A
10.12 131.89B 7.90 117.25 17.11 95.34A 12.88 124.41B 14.98 109.95 20.17 88.48A 6.93 97.73B 8.35 93.10 8.94 89.13A 12.04 109.93B 15.05 99.53 17.13