Empirical evidence for gender differences in Turkey
Sadullah ÇEL
İ
K
1, Emel BAYDAN
2Abstract:
Consumer attitude surveys classified as leading economic indicators aim at extracting information from respondents regarding their perceptions of economic outlook. A typical consumer confidence index includes questions designed to measure the changes in the past-current and current-future pairs of economic outlook perceptions of the participants as well as a question that examines the consumer’s view on the current stage of economic activity. These surveys use equal amount of male and female participants. This paper checks the existence of perceptional difference of genders using CNBC-e consumer confidence index for Turkey. First, we calculate monthly consumer confidence indices for men and women for January 2003 – March 2011. Then, employing this data set, we use the recently developed frequency domain analysis of Breitung and Candelon (2006) and wavelet comovement analysis of Rua (2010) to assess whether these indices follow similar patterns before and after the recent global crisis in time and frequency domain. Our results show that women consistently diverge from men and seem to be on the pessimistic side-due probably to lower levels of wealth in terms of expectation formation. Moreover, this difference is increasing when purchasing durable goods is considered.Key-words: gender difference, consumer confidence, emerging market, wavelet comovement analysis
1. Introduction and motivation
Consumer manner measurements identified as important economic statistics which are obtained from participants’ perceptions of economic outlook and give information on the current and future path of an economy. That kind of statistics is so important for experts, investors and business and financial press for their consumption or investment strategies depending. For this reason, we can see consumer confidence indices (CCI) in many countries to measure and distribute the latest position of consumer manners. The CCI is developed in the 1940s for the USA by Katona and then spread to the rest of the world and includes questions based on measuring the alterations in the past-current and current-future pairs of participants’ perceptions and the consumer’s view on the current stage of economic activity.
1
Marmara University, Istanbul, Turkey, e-mail: [email protected] 2
These surveys use equal amount of male and female participants. The analysis shows the positive relationship between consumer optimism and the future path of
consumption expenditures. Among others, Carroll et al. (1994), Bram and
Ludvigson (1998), Hüfner and Schröder (2002) and Kwan and Cotsomitis (2006) advocate the relationship between alterations in consumer manners and personal consumption expenditures. This paper checks the existence of perceptional difference of genders using CNBC-e consumer confidence index for Turkey by using recently developed frequency domain methodology analysis of Breitung and Candelon (2006) and wavelet comovement analysis. First, we calculate monthly consumer confidence indices for men and women for January 2003 – March 2011. Our preliminary results show that women consistently diverge from men and seem to be on the pessimistic side-due probably to lower levels of wealth-whereas this difference is larger after the global economic and financial crisis-due probably to lower levels of purchasing power.
2. Literature Review
Studies by Mishkin (1978), Throop (1991), Fuhrer (1993), Carroll et al. (1994), Nahuis (2000), Howrey (2001) and Ludvigson (2004) confirm the leading indicator features of expectations for economic variables such as consumer expenditures and economic growth. Hence, consumer manners have predictive ability for economic outlook because trends in aggregate demand or business cycles provide important information for policy makers and economic agents. However, some other studies reached contradictory results as they have included different economic and financial variables in their data set. One of these is by Jansen and Nahuis (2003) which examines the relationship between stock exchange and consumer confidence for 11 European countries and finds a strong positive correlation between stock returns and changes in consumer confidence. The result shows that stock returns cause consumer confidence at very short horizons of 2 weeks to 1 month. Moreover, Dominitz and Manski (2004) are critical about the methodology of confidence indices and suggest enlarging through some specific questions. They believe that ordinary people cannot correctly predict the general economic conditions. Hence, survey respondents cannot provide any extra information. Likewise, Van Oest and Franses (2008) suggest an alternative outlook for the interpretation of movements in consumer confidence and an applicable methodology to estimate the information of consumer confidence.
studies in this literature have used cross section data sets ignoring the dynamic aspect of expectations.
This study focuses on any difference between genders in terms of their responses to consumer confidence questions. Consumer confidence surveys serve several purposes to economic agents by categorizing respondents in gender, age, location and other characteristics. Optimism is measured through a base scale (usually 100) and it is easier to measure whether a gender is more optimistic or pessimistic than the other. Also, consumer confidence surveys have a time dimension. Thus, differences in gender responses in different intervals could signal changes in patterns of behavior among genders. Hence, consumer confidence is an important measure that tries to estimate the specific features of consumer sentiment by employing micro-level consumer survey data. Therefore, this paper examines whether there is a difference in terms of gender optimism/pessimism depending on economic and financial variables of interest over a certain period of time.
3. Data and methodology
3.1. Data
Two well-known consumer confidence indices are the former CNBC-e Consumer Confidence Index (now Bloomberg HT CCI) and the CBRT-TURKSTAT Consumer Confidence Index which are announced on a monthly basis, in Turkey. The former is termed as CCI and we employ it as the micro-level data has been provided by the survey producer. The methodology for the CCI has been adopted from the Michigan University index of consumer sentiment with necessary changes made for Turkish households. The base period of CCI is set as January 2002 and the value of the index at this period is 100. The index has a point of scale ranging from 0 to 200. The database contains records of 15,000,000 individuals. The index is compiled of 720 surveys. The distribution of the surveys has these criteria:
•70 percent is selected from Istanbul, Ankara and Izmir, 30 percent selected from other cities and big districts in Turkey.
•60 percent is selected from 36-55 age group, 40 percent 18-35 age group.
•50 percent is male and 50 percent is female.
•50 percent of the total surveys are composed of new records.
•A minimum of 30 percent of new records belongs to individuals who had been
successfully surveyed in the previous month.
•A maximum 20 percent of 704 completed surveys may be composed of
•Last and one of the most important criteria is that respondents are not surveyed more than two times. This helps to minimize the biases in the answers of survey respondents.
The five questions of the survey are:
1)We would like to learn your current economic situation. Can you compare
your (and your family’s) current financial situation with last year?
2)What do you think your (and your family’s) future financial situation will be in a year?
3) Can you compare your current expectations about Turkish economy with
the previous month?
4) What do you think Turkish economy’s situation will be in a year?
The Answer Choices for these 4 questions are the same as; Better/Worse/Same/No Idea
5) Do you think that the current period is a good time to buy durable
consumer goods such as a TV set, a refrigerator and furniture or vehicles or residence?
Answer Choices for this question is Good Time/Bad Time/No Idea
After the answers for all the surveys are compiled, CCI is calculated according to following formula:
100 value
period Base
value period Current value
index ⎟⎟×
⎠ ⎞ ⎜⎜
⎝ ⎛
= (1)
#
of optimistic answer for the question–
#
of pesimistic answer for the question Current periodvalue for each question is being
calculated as
=
704
× 100
+100 (2)
The current period values of each question are summed up to obtain current period’s value for the overall CCI. The index values for each question are announced as well
as the announcement of sub-indices of consumer exp
ectations index (
questions 2and 4) and propensity to consumer index (question 5).
Our data consists of Consumer Confidence Index for Women (CCIW),
Consumer Confidence Index for Men (CCIM), Consumer Expectations Index for
Women (CEIW), Consumer Expectations Index for Men (CEIM), Propensity to
Consume Index for Women (PCIW) and Propensity to Consume Index for Men
(PCIM). All the datasets are obtained from www.ntvmsnbc.com. The period is July
3.2. Methodology
This section is composed of two parts. In the first part, there is a short summary which explains the methodology of the analysis. In the second part, we present our empirical findings with short interpretations.
3.3. Frequency Domain Analysis
The Granger causality tests show whether the past variety in x (y) have an effect on current variety in y (x). However, these test results can supply results on causality over all frequencies. Besides, studies such as Yıldırım and Taştan (2009) show that the significance and/or direction of the Granger causality can change after adopting the causality test in
frequency domain.
By using a Fourier transformation to VAR (p) model for x and y series, the Geweke’s measure of linear feedback from y to x at frequency is defined as:2 12
2 2
11 11
( )
2 ( )
( ) log log 1
( ) ( ) i x y x i i e f M e e ω ω ω ψ π ω ω ψ ψ − → − − ⎡ ⎤ ⎢ ⎥ = ⎢ ⎥= + ⎢ ⎥ ⎣ ⎦ (3)
If ψ12
( )
e−iω 2 =0then the Geweke’s measure will be zero, then y will not Grangercause x at frequency . Breitung and Candelon (2006) present this test by
reformulating the relationship between x and y in VAR equation:
1 1 ... 1 1 ... 1
t t p t p t p t p t
x =
α
x− + +α
x− +β
y− + +β
y− +ε
(4)The null hypothesis tested by Geweke, My→x
( )
ω =0corresponds to the nullhypothesis of H0:R(ω)β=0where β is the vector of the coefficients of y and.
cos( ) cos(2 )...cos( ) ( )
sin( ) sin(2 )...sin( )
p R
p
ω ω ω
ω
ω ω ω
⎡ ⎤
=⎢ ⎥
⎣ ⎦ (5)
refers to test statistics. There are three frequencies which are low frequency (a year or longer), medium frequency (6 months-a year) and high frequency (less than 6 months). The causality test can be determined according to test statistics and critical
values on 0.05 and 0.1. Secondly, the wavelet-based measure of comovement is
presented through a contour plot as there are three dimensions involved. The horizontal axis refers to time while the vertical axis refers to frequency. To ease interpretation, the frequency is converted to time units (years).
3.4. Wavelet comovement analy
sis
The well-known Fourier transform involves the projection of a series onto an orthonormal set of trigonometric components (see, for example, Priestley (1981)). In particular, it uses sine and cosine base functions that have infinite energy (do not fade away) and finite power (do not change over time). Hence, the Fourier transform does not allow for any time dependence of the signal and therefore cannot provide any information about the time evolution of its spectral characteristics. To circumvent such limitation it has been suggested the so-called short-time or windowed Fourier transform. It consists of applying a short-time window to the signal and performing the Fourier transform within this window as it slides across all the data. A caveat of the windowed Fourier transform is that the window width and thus the time resolution is constant for all frequencies. When a wide range of frequencies is involved, the fixed time window tends to contain a large number of high frequency cycles and a few low frequency cycles which results in an overrepresentation of high frequency components and an underrepresentation of the low frequency components. Hence, as the signal is examined under a fixed time– frequency window with constant intervals in the time and frequency domains, the windowed Fourier transform does not allow an adequate resolution for all frequencies. In contrast, the wavelet transform uses local base functions that can be stretched and translated with a flexible resolution in both frequency and time. In the case of the wavelet transform, the time resolution is intrinsically adjusted to the frequency with the window width narrowing when focusing on high frequencies while widening when assessing low frequencies. As it enables a more flexible approach in time series analysis, wavelet analysis is seen as a refinement of Fourier analysis. Mathematically, the wavelet transform decomposes a time series in terms of some elementary functions, ѱ τ,s(t), which are derived from a time-localized mother wavelet ѱ (t) by translation and dilation (see, for example, Percival and Walden (2000)). Wavelets have finite energy and compact support, that is, they grow and decay in a limited time period and are defined as
⎟ ⎠ ⎞ ⎜ ⎝
⎛ −
=
s t
s t
s
τ
τ
1 ) (
where s is the time position (translation parameter), s is the scale (dilation
parameter), which is related with the frequency, and
s
1
is a normalization factor
to ensure that wavelet transforms are comparable across scales and time series. The scale for the wavelet-based measure is increasing darkness corresponds to an increasing value and mimics the height in a surface plot. Hence, by inspecting the contour plot one can identify both frequency bands (in the vertical axis) and time intervals (in the horizontal axis) where the series move together and assess if the strength of the comovement changes across frequencies.
4. Results and discussions
Figure 1 includes the frequency domain analysis and wavelet comovement analysis
between Consumer Confidence Index for Women (CCIW) and Consumer
Confidence Index for Men (CCIM). At low frequencies (a year or longer) women
cause men and at medium and high frequencies (less than a year) men cause women. There is positive comovement at 6 months or more whereas there is negative comovement in shorter horizons. In economic theory, this means women are more decisive about the short-run picture of the economy whereas men dominate the long-run. Moreover, the genders’ consumer sentiment levels are similar in the long-long-run. Thus, fluctuations occur only in the short run between the two genders, which is probably due to the absorption of information.
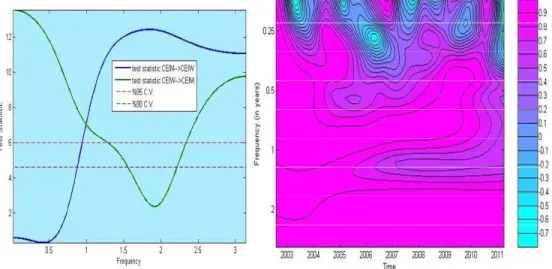
Figure 2 has the frequency domain and wavelet comovement analysis between
Consumer Expectations Index for Women (CEIW) and Consumer Expectations
Index for Men (CEIM), respectively. At low frequencies (a year or longer)
women cause men and at medium and high frequencies (less than a year) men cause women. There is positive comovement at 6 months or more whereas there is negative comovement in shorter horizons. Expectations also differ for genders men are impatient and concerned for the short run whereas women focus on the long-term.
Fig.2. Granger Causality in Frequency Domain (Left) and Wavelet Comovement (Right) for CEIW and CEIM
Figure 3 displays the frequency domain and wavelet comovement analysis
between Propensity to Consume Index for Women (PCIW) and Propensity to
Consume Index for Men (PCIM), respectively. At low frequencies (a year or
Fig. 3. Granger Causality in Frequency Domain (Left) and Wavelet Comovement (Right) for PCIW and PCIM
Figure 4 involves the frequency domain and wavelet comovement analysis between Propensity to Consume Index for Women (PCIW) andConsumer Expectations Index for Women (CEIW), respectively. At low frequencies (a year or longer) and at medium and high frequencies (less than a year) PCI women cause CEI women. There is positive comovement at 1 year or more whereas there is negative comovement in shorter horizons. Hence, women could only realize their expectations in a longer horizon. The purchasing powers of women are rather limited but still are stronger than their expectation formation. This is probably due to the funds obtained only in the longer term needed to purchase such durable assets. Hence, women have pessimistic expectations about purchasing and lag behind the actual pattern of their consumption. This probably is the result of such a long period of time in the job market where women have participated almost at the half rate compared to men. So, expectations are caused by actual results.
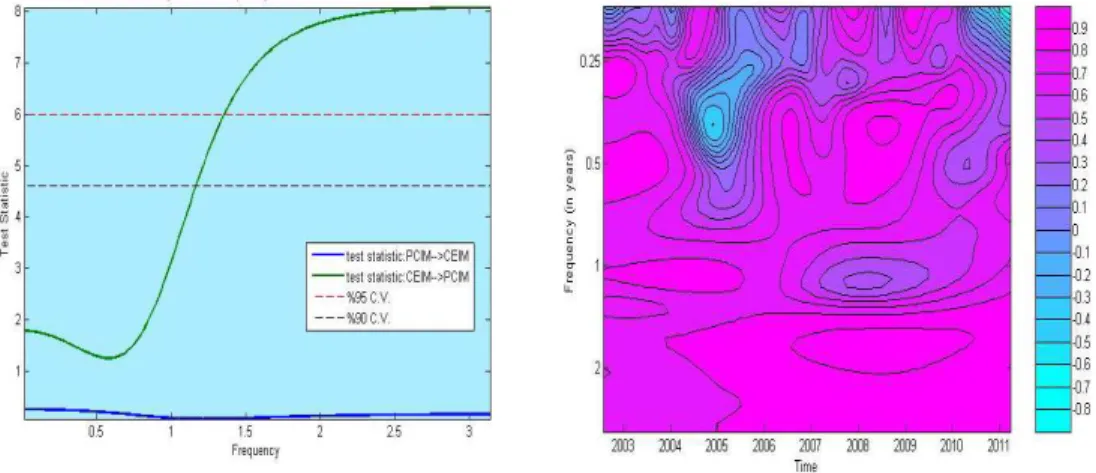
Figure 5 includes the frequency domain and wavelet comovement analysis
between Propensity to Consume Index for Men (PCIM) and Consumer
Expectations Index for Men (CEIM), respectively. At low frequencies (a year or
longer) and at medium and high frequencies (less than a year) CEI men cause PCI men. There is positive comovement at 6 months or more whereas there is negative comovement in shorter horizons. The findings for men are opposite of women because men have the purchasing power and (wealth) to buy the durable goods. So, their expectations cause their transactions. Moreover, these usually occur at shorter terms compared to women. This is further evidence that men dominate women in terms of confidence and purchasing power.
Fig. 5. Granger Causality in Frequency Domain (Left) and Wavelet Comovement (Right) for PCIM and CEIM
5. Conclusions
This study is an attempt to enhance the consumer confidence literature by shifting the focus from the information content of consumer confidence to the criteria content of consumer confidence. Among others, the foremost criterion for any consumer confidence index is the equal number of respondents from the two genders. Hence, we choose to examine whether there is a gender difference in
consumer confidence data. Moreover, this is done f
or an emerging economy,
market which experiments business cycles at shorter horizons with respect to an industrialized economy. Secondly, we calculate frequency domain and wavelet comovement measure for the forecasting and power of the CCI at different forecasting horizons. Last, our empirical findings show that variations in consumer confidence mainly concentrate over seasonal frequencies. However, we see that women are not very straightforward in terms of expectations versus consumption. It is obvious that there exists causality between women and men in consumer confidence terms at low frequencies with the direction from women to men. For further research, the consumer confidence indices for women and men should be analyzed in detail through the addition of several different economic and financial variables into the research pattern.
6. References
Breitung, J. and Candelon, B., 2006. Testing for short and long-run causality: A frequency domain approach. Journal of Econometrics, 132, pp. 363-78.
Central Bank of Republic of Turkey, 2008. [online] Available at: <http://www.tcmb.gov.tr>, [accessed 25 January 2008].
Carroll, C. D., Fuhrer, J. C. and Wilcox, D. W., 1994. Does consumer sentiment forecast household spending? If so, why? American Economic Review, 84, pp. 1397-1408. Çelik, S. and Deniz, P., 2008. Panel cointegration analysis for stock exchange, exchange rates and interest rates: An application to the European Union. Paper presented at the 15th World Congress of the International Economic Association, June, İstanbul, Turkey.
Dominitz J. and Manski, C. F., 2004. How should we measure consumer confidence? Journal of Economic Perspectives, 18, pp. 51-66.
Granger, C. W. J., 1981. Some properties of time series data and their use in econometric model specification. Journal of Econometrics, 16, pp.121–30.
Güneş, H. S. and Çelik, S., 2009. Consumer confidence and financial market
variables in an emerging economy: The case of Turkey. Paper presented at the Society for Computational Economics 15th International Conference on Computing in Economics and Finance, 15-17 July, Sydney, Australia.
Howrey, E. P., 2001. The predictive power of the index of consumer sentiment”,
Brookings Papers on Economic Activity, 1, pp. 175-216.
Hüfner, F. P. and Schröder, M., 2002. Forecasting economic activity in
Germany-How useful are sentiment indicators?” Centre for European Economic
Research Discussion Paper, No. 02-56, September.
Istanbul Stock Exchange, 2008 [online]. Available at: http://www.imkb.gov.tr, [Accessed on 24 Jan 2008].
Katona, G., 1960. The powerful consumer. New York: McGraw Hill.
Katona, G., 1968. Consumer behavior: theory and findings on expectations and aspirations. American Economic Review, 58, pp. 19–30.
Kwan, A. C.C. and Cotsomitis, J. A., 2004. Can consumer attitudes forecast household spending in United States? Further evidence from the Michigan surveys of consumers. Southern Economic Journal, 71, pp. 136-144.
Ludvigson, S., 2004. Consumer confidence and consumer spending. Journal of
Economic Perspectives, 18, pp. 29 -50.
Mishkin, F. S., 1978. “Consumer sentiment and spending on durable goods.
Brookings Papers on Economic Activity, 1, pp. 217-32.
Nahuis, N. J., 2000. Are survey indicators useful for monitoring consumption
growth? Evidence from European countries. Working Paper 2000-08 (June),
Monetary and Economics Policy Department, De Nederlandsche Bank, Amsterdam.
NTVMSNBC, 2008. [online]. Available at: http://www.ntvmsnbc.com, [Accessed 28 January 2008].
Rua, A., 2010. Measuring comovement in the time–frequency space. Journal of
Macroeconomics, 32, pp. 685–91.
Throop, A. W., 1992. Consumer sentiment: Its causes and effects. Federal Reserve Bank of San Francisco Economic Review, 1, 35-59.
Turkish Statistical Institute (online). 2008 [cited 31 January 2008]. Available from Internet: <http://www.tuik.gov.tr>.
Van Oest, R. and Franses, P. H., 2008. Measuring changes in consumer confidence.
Journal of Economic Psychology, 29, pp. 255-275.
Yıldırım, N. and Taştan, T., 2009. Capital flows and economic growth across
spectral frequencies: Evidence from Turkey. Turkish Economic Association