Monitoring of the Sulfur and Nano Silver in Water by Method of
Laser Spectroscopy
Moguilnaya T, Suminov I anН Nikitina
JSC Giprogazoochistka 1 26, Pervomayskaya St., Moscow, 105203, Russia
ABSTRACT
We developed new automatic method that combines the method of forced lumines-cence and stimulated Brillouin scattering (SBS). We used the method for the pathogens monitoring in water supply system earlier. We have researched spectral peaks of gases and show that method allows determining H2S content with 0.01%
accuracy and determining the content constituents of nano silver in water.
I.
INTRODUCTION
Currently, there are high requirements to the content of harmful gas impurities, occurring in oil refining. In particularly, hydrogen sulfide (H2S)
content must not exceed 0.03%.
Optical techniques are often used to determine the concentration of residual gases in oil refinery. To determine the gas concentration, luminescence methods are usually used. The intensity and frequency of monitoring signal depend on the output window transparency. However, the accuracy in the monitoring process is insufficient due to a set of optical noises, such as the noise from radiation source and deterioration of optical properties of the radiation output window. In the process of monitoring, the output window loses its transparency due to the deposition of flue gas residue. This leads to instability of the processed signal.
We developed a new method based on the phenomenon of stimulated Brillouin scattering (SBS). This method allows determining H2S
content with 0.01% accuracy. We studied the spectra of non-elastic scattering from gas probes,
Мontaining 2S at a con-centration of 0.03-5%. The
source of radiation excitation is diode pumped solid state laser with wavelengths of 0.527 and 1.017
m. ThО output powОr raНiation is 400 mW, which
was preselected so that the SBS effect was achieved.
As the result of our experiments, we
obsОrvОН an aННitional pОak at 1.022 m in thО
Stokes spectral area. We found out, that the logarithm of intensity of the Stokes component was linear function of gas concentration. We also carried out a series of experiments with a mixture of gases, containing H2S and CO2 in different
proportions. We identified the gas H2S at its 0.01 %
content in the mixture.
We used a similar method to control nano-silver content in aqueous solution. We observed
both Stokes and anti-Stokes components in the spectra of such solutions. The peak position of the components depended on the nano-silver concentration. We also developed the mathematical mod-el of laser radiation propagation in colloidal solution, which contains additional impurities.
II.
EXPERIMENTAL
The experiment was carried out as follows: sample of gas containing 2 H2S in varying
con-centrations (0.02, -0.2% mass fraction) and at a predetermined pressure was fed into the bubble-free chamber 1 with water. Water temperature was 80 oC. Excitation light from the laser light source 3 was introduced into the same chamber. The source of excitation radiation was the diode-pumped solid state laser with wavelengths of 0.527 and 1.017
m, anН tunablО Оmission powОr, whiМh was
preselected so as to achieve the effect of stimulated Brillouin scattering for a given volume of liquid.
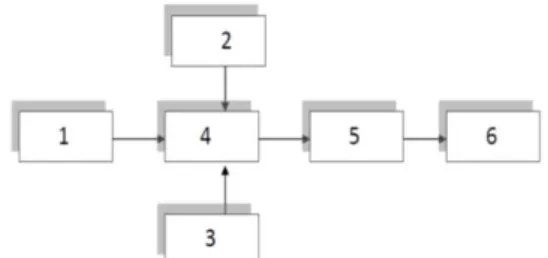
Figure 1. Unit Block Diagram: 1-central highway, 2- pipeline, 3-laser source 4- collector (flow chamber with water), 5-a spectrum analyzer, 6-
computer.
The radiation from this laser (3) through an optically isolated cuvette successively enters the spectrum analyzer (5) and computer memory (6). We chose high degree of averaging for the stability of the results. We recorded each result at intervals of at least five minutes. At the beginning of each series of experiments, the laser emission spectrum and an emission spectrum that has passed through a
clean cuvette were recorded. We entered the results in the computer memory.
We carried out the processing of the spectra using specialized software package statistical analysis of experimental data. We used spectrum analyzer "Yokogawa" with spectral permission 0.01 nm, equipped with a built-in microcomputer for spectra processing and transmission in the computer's memory. Sensitivity spectrum analyzer - + 69 dBm. Experiments using silver are similar. However, the water temperature in the chamber was 20 °C, and another DTL-392QT laser with two wavelengths, respectively
0.527, 1.017 m , with highly stable power supply was applied as the source of radiation to excite luminescence.
III.
GAS STUDY
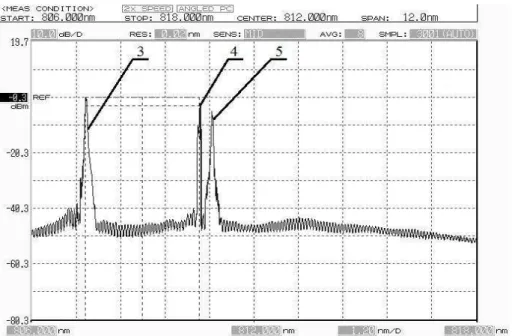
It was detected that secondary radiation, the intensity of which is comparable with the intensity of transmitted laser light, was a function of the concentration of an object in spectral analysis of samples. The radiation was observed in the Stokes and anti-Stokes field in the example of the spectral distribution. The example of the spectral intensity distribution of the logarithm (dbm), 1 represents the laser mode, 2 - Stokes mode is shown in Figure 2
The first peak corresponds to the laser radiation, the second one – to Stokes component. Maximum of the second peak intensity depends on the concentration of dissolved gas. Figure 3 shows the dependence of H2S concentration in % mass
fraction of the ratio of the logarithm of Stokes component intensity peak to the maximum intensity I0 of laser radiation.
Figure 2. An example of the spectral intensity distribution of the logarithm (dbm) 1 -Laser mode . 2 – mode corresponding Stokes component of thО wavОlОngth ( ) at thО concentration of H 2S in 0.8% mass
Figure 3. The dependence of H2S concentration in % mass fraction of the ratio of the logarithm of Stokes
component intensity peak I to the maximum intensity I0 of laser radiation
Figure 4. The example of the logarithm spectral intensity distribution (dbm). 4- laser mode, 5- mode corresponding Stokes component of the wavelength ( ) at a concentration of H2S in 0.8% mass fraction of S 2.
IV.
NANO-SILVER STUDY
The high-voltage electric pulse method to obtain metal nanoparticles in liquid media.
The main elements of the reactor to generate nanoparticles in a liquid medium by a pulsed arc: - high-voltage power supply
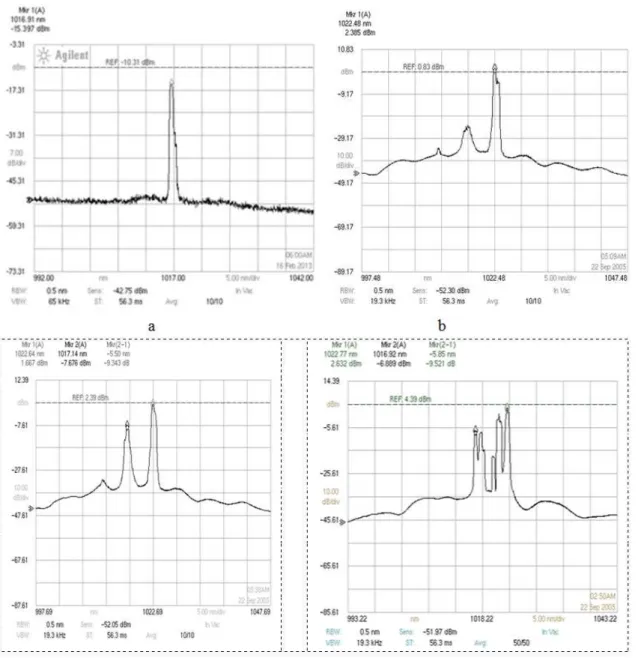
Colloidal silver solution spectra are shown in Figure 5.
Figure 5 a- the laser radiation spectrum passed through the water. Figures 5 b,c – spectrum with content nanosilver 0.01 mg\l and 0.1 mg\l. Figures 5d -the spectrum of colloidal solution contains 10 mg \l nanosilver.
The logarithm of the maximum peak intensity of 2 increases with the concentration of silver linearly. When you reach a concentration of 10, spectral shape changes abruptly, and there are additional
peaks. Electron microscope studies have shown that in this case silver particles begin to agglomerate extensively and effectively, nanosilver loses its properties.
We did not find Lamb dip in the spectrum of the Stokes component of colloidal silver solutions. The intensity logarithm is a linear function of the concentration only at low concentrations. At these concentrations, the peak is observed in the Stokes region.
V.
DISCUSSION
The process is as follows. Luminescence occurs as the result of pumping the laser medium. Interaction and exchange of energy between the pump waves and luminescence take place; Stokes
or anti-Stokes component appears. Interaction and exchange of energy between the pump and Stokes waves and acoustic wave are set. The refractive index of the medium becomes variable. The forced nature of the scattering leads to Stokes component.
Figure 5 Transmission spectra laser radiation passed from colloidal silver solution: a-water, b - concentration of silver 0.01 mg\l, c - concentration of silver 0.1 mg\l, d - concentration of silver 10 mg\l.
The peculiarity of this effect is that the distance between the peaks of the laser radiation and the anti-Stokes or Stokes mode component is practically independent of the concentration. It is known that the threshold of the Brillouin-Mandelstam scattering in liquids is several orders lower than the Raman scattering [1].
Test objects are colloidal solutions of the third group in which the substance is not in the ionized form, but in suspended state, as so-called
above the water level and the temperature. For example, H2S content at 0oC is 0.07% at 80 0C; and
it decreases to almost 0, when the temperature of water that contains the dissolved gas is 800. Therefore, the analyzer chamber with water, into which the test gas mixture was warmed up to 800 C. An indication of the appearance of gas bubbles is the maximum frequency of the spectral distribution of the Stokes component, which depends on the type of substance and is independent of the used optics parameters. The signal is always in the Stokes region.
The angular dependence of the scattered light intensity for gas particles is:
2 0 2 4 2 2 ) 2 ( )
( I A
r a
I f
where αf the
concentration of the gas (bubbles), I0- source
strОngth, -wavelength, r-distance to the receiver [2-3].
It is obvious that the intensity of the response is a smooth single-valued function of the concentration because of the small scattering angle of distribution diagrams. This allows to determine the concentration with high precision. This makes it possible to determine the concentration at the maximum intensity of the Stokes component without special treatment of noise-related pollution. The logarithm of the intensity is a linear function of the concentration only at low concentrations. At these concentrations the peak is observed in the Stokes region.
Nano silver particles in the water can also be attributed to similar structures. There are positive and negative space areas upon irradiation with light silver particles as a result of the displacement of conduction electrons. Near these areas, the electric field is many times greater than the electric field of the incident wave [4]. Logarithm of the intensity is a linear function of the concentration only at low concentrations. The peak is observed in the anti-Stokes region at low concentrations. When you reach a concentration of 10 mg/l, the spectrum acquires another shape. That is likely due to fact that the particles start to form aggregates.
VI.
CONCLUSION
We have developed a new method that combines the method of forced luminescence and stimulated Brillouin scattering. We have analyzed this technique and have proved its applicability for gas analyzer development in exhaust gases control in oil and gas industry.
REFERENCES
[1] Zverev G M and Martynov A D The study thresholds forced Brillouin scattering for different media on waves of 0.35, 0.69 and
1.06 m. JETP Letters 1967, v. 6, pp. 931-934
[2] Moguilnaya T Yu, Saguitova E A, Prokhorov КА, Grebenuk E I and Grebenuk N A, Laser instrumentation for express diagnostics of impurities and toxins in liquid food, 2001 Photonic Detection and Intervention Technologies for Safe Food, Proceeding of SPIE, 4206 256
[3] Moguilnaya T Yu, Saguitova E A and Botikov A G, Instrumentation for noninvasive express-diagnostics bacteriophages and viruses by optical method, 2003 Smart medical and Biomedical Sensor Technology Proceeding of SPIE, 5621 18
[4] Krutyakov Yu A, Kudrinskiy A A, Olenin A Y and Lisichkin G V, Synthesis and properties of silver nanoparticles: advances and prospects, 2008 RUSS CHEM REV, 77
233