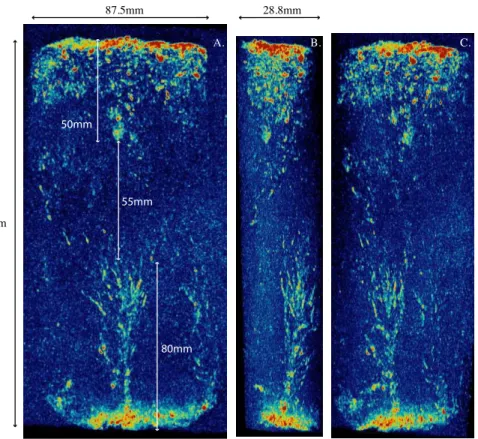
Morphology and distribution of liquid inclusions in young sea ice as imaged by magnetic resonance
Texto
Imagem


Documentos relacionados
The reconstructions are based on a multilinear regression of forecasted ice concentration, level ice thickness, ridge density, ice speed and an additional factor which is based,
To investigate the influence of snow depth, sea ice density, and area on sea ice thick- ness and volume estimates we use freeboard retrievals from ICESat, together with dif-
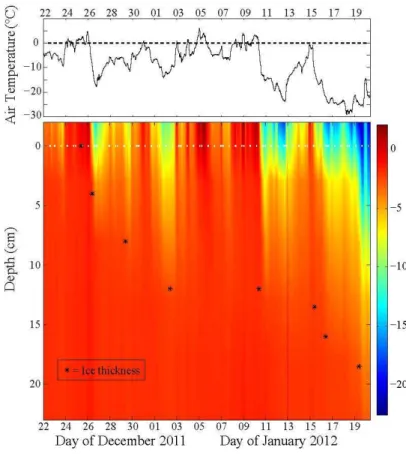
Furthermore, the high- est ionic concentrations were also found in this layer, and it appears reasonable to suggest that unfractionated sea salt was present 17 cm from the
The two points considered at the alternate sides, of the tangents through the diameter of the circle, and then the line joining these points divides the circle
main aim of this work is to derive the eigen-frequencies of the system, which includes the buoyant, elastic ice-shelf and the sea water under the ice-shelf, implying that, in
At the first stage of the measurements results analysis, the gear wheel cast surface image was compared with the casting mould 3D-CAD model (fig.. Next, the measurements results
Int. A.: Ice thickness distribution – measurement and theory, in: The Geophysics of Sea Ice, NATO ASI series B: physics, edited by: Untersteiner, N., Plenum, New York, 146,.. A.,
The rate of formation of dense water is controlled by the rate of cooling in the shallow continental shelf areas in the northern part of the Caspian Sea, ice forma- tion in the
