Sensitivity Cardiac Troponin T in a Community-Based
Population Study in Beijing
Fan Wang, Ping Ye*, Leiming Luo, Ruyi Xu, Yongyi Bai, Hongmei Wu
Department of Geriatric Cardiology, Chinese PLA General Hospital, Beijing, China
Abstract
Background:Reduced renal function is an independent risk factor for cardiovascular disease mortality, and persistently elevated cardiac troponin T (cTnT) is frequently observed in patients with end-stage renal disease. In the general population the relationship between renal function and cTnT levels may not be clear because of the low sensitivity of the assay. In this study, we investigated the level of cTnT using a highly sensitive assay (hs-cTnT) and evaluated the association of estimated glomerular filtration rate (eGFR) with detectable hs-cTnT levels in a community-based population.
Methods:The serum hs-cTnT levels were measured in 1365 community dwelling population aged$45 years in Beijing, China. eGFR was determined by the Chinese modifying modification of diet in renal disease (C-MDRD) equation.
Results:With the highly sensitive assay, cTnT levels were detectable ($3pg/mL) in 744 subjects (54.5%). The result showed that eGFR was associated with Log hs-cTnT (r =20.14, P,0.001). After adjustment for the high predicted Framingham Coronary Heart Disease (CHD) risk (10-year risk.20%) and other prognostic indicators, moderate to severe reduced eGFR was independently associated with detectable hs-cTnT, whereas normal to mildly reduced eGFR was not independently associated with detectable hs-cTnT. In addition, after adjustment for other risk factors, the high predicted Framingham CHD risk was associated with detectable hs-cTnT in the subjects with different quartile levels of eGFR.
Conclusion:The levels of hs-cTnT are detectable in a community-based Chinese population and low eGFR is associated with detectable hs-cTnT. Moreover, eGFR and high predicted Framingham CHD risk are associated with detectable hs-cTnT in subjects with moderate-to-severe reduced renal function.
Citation:Wang F, Ye P, Luo L, Xu R, Bai Y, et al. (2012) Association of Glomerular Filtration Rate with High-Sensitivity Cardiac Troponin T in a Community-Based Population Study in Beijing. PLoS ONE 7(5): e38218. doi:10.1371/journal.pone.0038218
Editor:John E. Mendelson, California Pacific Medicial Center Research Institute, United States of America
ReceivedNovember 7, 2011;AcceptedMay 1, 2012;PublishedMay 31, 2012
Copyright:ß2012 Wang et al. This is an open-access article distributed under the terms of the Creative Commons Attribution License, which permits unrestricted use, distribution, and reproduction in any medium, provided the original author and source are credited.
Funding:This study was supported by a grant from the Capital Medical Development Fund of Beijing (2009-2038) and the National Basic Research Program of China (2012CB517503). The funders had no role in study design, data collection and analysis, decision to publish, or preparation of the manuscript.
Competing Interests:The authors have declared that no competing interests exist.
* E-mail: [email protected]
Introduction
A reduced glomerular filtration rate is an independent risk factor for cardiovascular disease mortality [1–2]. Meanwhile, several large-scale prospective clinical trials have shown that the prevalence of adverse cardiovascular disease events is increased among patients with end-stage renal disease [3–4]. Also, persis-tently elevated levels of cardiac biomarkers are frequently observed in these patients [5–6], such as cardiac troponin T (cTnT), as a highly sensitive and specific marker of myocardial damage. In the asymptomatic general population, however, the relationship between renal function and myocardial injury is not clear. The clinical use of serum levels of cardiac biomarkers has limitations because of the low sensitivity of the assay systems [7]. The prevalence of detectable concentrations of cTnT in the general population is approximately 0.7% with the use of conventional assays [8].
Recently, a highly sensitive cardiac troponin T (hs-cTnT) assay has become commercially available permitting measurement of concentrations that are lower by a factor of 10 than those
measurable with conventional assays [9]. Indeed, as recommended in the recent guideline for biomarker evaluation, optimal precision (the coefficient of variation (CV) at the 99th percentile upper reference limit for assays should be defined as#10%) and reliable precision allows for sensitive assays [10]. cTnT with a highly sensitive assay meets the recommendation and provides a sensitive assay to study the relationship between renal function and myocardial damage or subclinical myocardial damage in asymp-tomatic subjects with normal-to-mild reduced renal function.
high predicted Framingham CHD risk (10-year risk.20%) in a community-based population in Beijing, China.
Methods
The study protocol was approved by the Ethics Committee of the Chinese People’s Liberation Army (PLA) General Hospital (Beijing, China). Each participant provided written informed consent to be included in the study.
Study population
This was a community-based cross-sectional study of people living in the Pingguoyuan area of Shijingshan district, a metropolitan area in Beijing, China. All participants were permanent residents of Han origin, aged $45 years, who were recruited to the study after a routine health check-up from September 2007 to January 2009. Subjects with bedridden status, mental illness, malignant tumors and severe systemic diseases were excluded from the analysis. Initially, 1,601 participants were included. Among them, 1,503 subjects provided blood samples for the testing of cardiac biomarkers. Of those, 6 subjects had missing data, such as without serum lipids, blood glucose or serum creatinine. Therefore, a total of 1,497 participants with complete data were eligible for assessment. Eventually, after excluding 132 participants for overt vardiovascular disease, 1365 participants formed the present study.
Questionnaire and anthropometric measurements Information about smoking status, medication use, a history of hypertension, DM, and coronary heart disease was obtained by self-reporting, standardized questionnaires. This was administered using a face-to-face counseling method. The investigation was completed by physicians in the Department of Geriatric Cardi-ology of the People’s Liberation Army General Hospital who were trained by the research team.
Height, weight and circumferences of the waist and hip were measured. The body mass index (BMI) and waist-to-hip ratio (WHR) were calculated. BMI was calculated as weight in kilograms divided by the height in meters squared (kg/m2). WHR was calculated as waist circumference (WC) divided by hip circumference. The measurement of blood pressure was done using a calibrated desktop sphygmomanometer (Yuyue, Arma-mentarium Limited Company, Jiangsu, China) after participants had been in the supine position for$5 min [13]. Blood pressure was measured thrice consecutively, with $1 min between measurements. The mean value of blood pressure was used for the statistical analysis.
Biomarker measurements
Blood samples were collected in tubes containing separating gel after overnight fasting and maintained at 4uC for #2 h before being centrifuged at 12006g for 15 min. Serum aliquots were frozen at280uC until assays were carried out.
Concentrations of fasting glucose, total cholesterol, triglyceride, high-density lipoprotein (HDL)-cholesterol, LDL-cholesterol, uric acid and homocysteine were determined using the enzymatic assays (Roche Diagnostics GmbH, Mannheim, Germany) on an autoanalyzer (Roche Diagnostics, Indianapolis, IN, USA). Con-centrations of hs-cTnT were determined using a Elecsys Troponin T highly sensitivity assay (Roche Diagnostics GmbH, Mannheim, Germany) by an electrochemiluminescence immunoassay method on a Modular Analytics E170 Autoanalyzer (Roche Diagnostics). Given enhanced sensitivity, this assay was reported in units of picograms per milliliter (pg/mL) with an interassay coefficient of
variation of 8% at 10 pg/mL and 2.5% at 100 pg/mL [14]. The lower detection limit of the hs-cTnT assay was 3 pg/mL (according to manufacturer’s information), which was used as the cut-off point in the present analysis; hs-cTnT levels less than 3 pg/mL were considered undetectable (,3.0 pg/mL). The 99th percentile for a reference population has been reported to be 13.3 pg/mL [10]. Concentrations of the N-terminal prohormone of brain natriuretic peptide (NT-proBNP) were determined with an electrochemiluminescence immunoassay (Roche Diagnostics GmbH) using a Roche analyzer. It had a measurement range of 5– 35000 pg/mL. According to manufacturer’s information, the lower limit of detection was 5 pg/mL [15]. Concentrations of high-sensitivity C-reactive protein (hs-CRP) were determined by an immunoturbidimetric assay (Siemens Healthcare Diagnostics, Los Angeles, CA, USA) using a Dimension RxL Max analyzer (Siemens Healthcare Diagnostics). Concentrations of serum creatinine were measured by an enzymatic assay (Roche Diagnostics GmbH) on a Hitachi 7600 Autoanalyser (Hitachi, Tokyo, Japan). All testing was undertaken by well-trained personnel blinded to clinical data in the Department of Biochemistry of Chinese PLA General Hospital.
Definition of variables
Cigarette smoking was assessed by asking each individual whether he/she was a current smoker. A subject was considered to have hypertension if (i) systolic blood pressure (SBP)$140 mmHg; and/or (ii) diastolic blood pressure (DBP)$90 mmHg; and/or (iii) the subject was taking an antihypertensive drug [16].
All participants without a history of DM were given a standard 75 g oral glucose tolerance test (OGTT). Results showed that 1286 participants had the OGTT. Fasting venous blood was collected from participants with a history of DM to measure blood glucose. A subject was considered to have DM if (i) fasting venous blood glucose $7.1 mmol/L; (ii) 2 h venous blood glucose $11.1 mmol/L; or (iii) the subject was taking a hypoglycemic drug or insulin [17].
Renal function was evaluated by eGFR. Creatinine level was standardized using a calibration equation: Jaffe’s kinetic method Scr (mg/dL) = 0.7956[enzymatic method Scr (mg/dL)]+0.29 [18]. eGFR was calculated using the Chinese modifying modifi-cation of diet in renal disease (C-MDRD) equation [19]: eGFR (mL/min/1.73 m2) = 1756standard creatinine (mg/ dL)21.234
6age (year)20.1796(0.79 if female).
Calculation of predicted risk
The Framingham CHD risk prediction score incorporates sex, age, LDL-cholesterol, SBP, DBP, history of DM, and current smoking [11]. The levels of 10-year risk for the CHD events were categorized as: low (10-year risk,10%); moderate (10-year risk 10% to 20%); or high (10-year risk.20%) [20]. In the present analysis, the high predicted Framingham CHD risk (10-year risk .20%) was used as the cut-off point.
Statistical analyses
were defined as the normal to mild reduced renal function; the quartile 4 level of eGFR was defined as the moderate to severe reduced renal function. Statistical comparison of groups was undertaken by one-way ANOVA (continuous variables) or chi-square tests (categorical variables).
In order to evaluate the association between eGFR and hs-cTnT as a continuous variable (natural logarithm transformed), the Pearson’s correlation for continue variables or the Spearman’s correlation for categorical variables was used in univariable analyses, and multivariable linear regression analysis was per-formed requiring a variable with a probability value of#0.10 to be entered and,0.05 to remain in the model after adjusting for several potential confounders (covariates). In the analysis, unde-tectable hs-cTnT levels (,3 pg/mL) were considered 1.5 pg/mL [21].
In addition, to better understand the association between different quartile levels of eGFR and detectable hs-cTnT, logistic regression models were used. Forward stepwise multivariable logistic regression was performed to obtain the odds ratios (OR) and 95% confidence intervals (CI) requiring a variable with a probability value of#0.10 to be entered and,0.05 to remain in the model and the quartile 1 level of eGFR was used as the reference. Regression models were adjusted for high predicted Framingham CHD risk (10-year risk $20%) (model 1) and for model 1 plus levels of BMI, WC, and WHR (model 2). Model 3 was adjusted for model 2 plus levels of fasting glucose, uric acid, hs-CRP, homocysteine and NT-proBNP.
Furthermore, in order to investigate the role of high predicted Framingham CHD risk in the relationship between eGFR and hs-cTnT, we evaluate the association between high predicted Framingham CHD risk (10-year risk$20%) and detectable hs-cTnT in subjects with different quartile levels of eGFR, forward stepwise multivariable logistic regression was repeatedly used, a variable with a probability value of #0.10 to be entered and ,0.05 to remain in the model. Regression models were adjusted for BMI, WC, and WHR (model 1) and for model 1 plus levels of fasting glucose, uric acid, hs-CRP, homocysteine and NT-proBNP (model 2).
All data entry and management were undertaken on an Excel spreadsheet and were then analyzed by the SPSS statistical package (version 16.0; SPSS Inc., Chicago, IL, USA). A 2-sided value of P,0.05 was considered significant.
Results
Clinical characteristics of participants
A total of 1365 subjects were included in the analysis. There were 578 males (42.3%) and 787 females (57.7%). The age range was 45 to 96 years old (mean, 62.3669.82 years). Of these, there were 351 current smokers (25.7%), 239 DM patients (17.5%), 605 hypertensive individuals (44.3%). There were 28 subjects with eGFR#60 ml/min/1.73 m2(1.89%).
Table 1 shows the clinical characteristics of the study population. Participants were divided into four groups based on the level of the quartile of eGFR ($97.02, 97.01–87.76, 87.75– 78.97,#78.96 mL/min/1.73 m2). Compared to the quartile 1 of eGFR, age, the percentage of hypertension and diabetes, the level of SBP, total cholesterol, uric acid, homocysteine, hs-CRP, log NT-proBNP, log hs-cTnT and high predicted Framingham CHD risk score (10-year risk $20%) in the quartile 4 of eGFR were higher (P,0.05).
Concentration and Distribution of hs-cTnT
The range of detectable hs-cTnT concentrations was 3.03– 176.40 pg/mL with a median value of 7.45 pg/mL (quartile 1 to quartile 3: 4.84–12.02 pg/mL) in this community-based popula-tion. Among 1365 participants, 621 subjects (45.5%) had undetectable hs-cTnT (,3 pg/mL), 580 subjects (42.5%) had hs-cTnT concentration 3–13.2 pg/mL, and 164 subjects (12.0%) had hs-cTnT concentration$13.3 pg/mL.
The association between eGFR and hs-cTnT
The association between eGFR and hs-cTnT as a continuous variable (natural logarithm transformed) was presented in table 2. The results of Pearson’s correlation showed that eGFR had a negative relationship with log hs-cTnT (r=20.143;P,0.001). In multivariable linear regression analysis, eGFR was negatively and independently associated with hs-cTnT levels. In addition, the male, older age, NT-proBNP and fasting glucose were positively and independently associated with hs-cTnT levels.
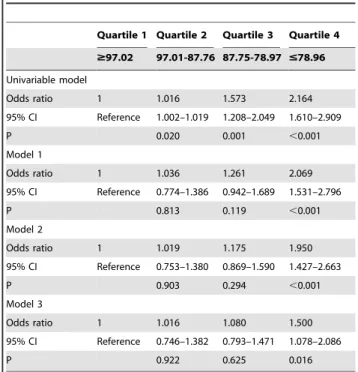
The relationship between different quartile levels of eGFR and detectable hs-cTnT is shown in Tables 3. A stepwise logistic regression model was performed and the quartile 1 level of eGFR was used as the reference. In the univariate model, all quartile levels of eGFR were associated with detectable hs-cTnT. After adjusted for high predicted Framingham CHD risk (10-year risk $20%) and/or other predicted factors, however, only quartile 4 of eGFR was independently associated with detectable hs-cTnT. eGFR in quartile 2 and 3 were not independently associated with detectable hs-cTnT in the adjusted models (Model 1, 2 and 3).
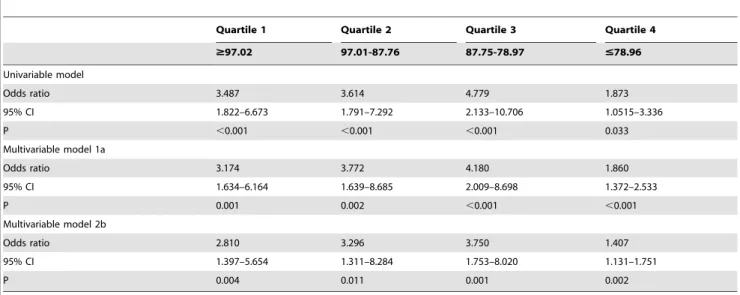
Tables 4 shows the relationship between the high predicted Framingham CHD risk (10-year risk$20%) and hs-cTnT value as a categorical variable (detectable or undetectable) in subjects with different quartile levels of eGFR. The results showed that the high Framingham CHD risk score was independently associated with detectable hs-cTnT in adjusted models (Modle 1, 2). Furthermore, the OR increased with decreasing quartile levels of eGFR (quartiles 1 to 3), whereas the OR decreased abruptly in the quartile 4 of eGFR.
Discussion
deteriorate myofilaments [25]. Thus, cTnT is detetable with highly sensitive assay in subclinical myocardial damage, which is even in slight injury. However, few data are available for evaluating the prevalence of cTnT elevation in a large and representative sample of the general population because of the low sensitivity of the conventional assay system [7]. With the use of this highly sensitive assay, identification of subclinical myocardial damage is improved. In the present study, we found that circulating hs-cTnT levels were detectable in 54.5% of subjects and<12.0% of subjects had hs-cTnT concentrations$13.3 pg/ mL. The results are similar to other studies [26,27].
The interaction between the heart and kidney has been explored for a long time. Several studies have documented that patients with a progressive decrease in eGFR are at a higher risk of cardiovascular disease than the general population, and show a higher prevalence of cardiovascular mortality [28–30]. Levels of cTnT are frequently elevated in the absence of acute coronary occlusion among patients with renal dysfunction, specifically in 30–75% of end-stage renal disease patients [31–32]. However, the pathophysiologic mechanisms causing random increases in cTnT
levels in patients with renal dysfunction or dialysis are unclear. Several reasons may help to explain this correlation. Firstly, with reduced of renal excretion, increase of volume load [33] or accumulation of a certain nephrotoxinper se [34] would lead to ischemia or damage to the myocardium. Secondly, troponin is usually believed to be cleared by the reticuloendothelial system given the relatively large molecular size of troponin [35]. However, recent evidence demonstrates that troponin T can be fragmented into molecules small enough to be excreted by the kidney; this may explain the high prevalence of troponin elevation in patients with severe renal failure [36]. Thirdly, with decreased renal function, the cardiovascular risk is increased and the possibility of subclinical myocardial damage raised [37]. In the present study, after stepwise adjustment for high predicted Framingham CHD risk and other cardiovascular prognostic indicators, such as BMI, NT-proBNP, hs-CRP, homocysteine and so on, normal-to-mild reduced levels of eGFR were not independently associated with detectable hs-cTnT. In contrast, moderate-to-severe reduced levels of eGFR were independently and negatively associated with detectable hs-cTnT. The results Table 1.The clinical characteristics of study participants.
Overall Quartile 1 Quartile 2 Quartile 3 Quartile 4
(n = 1365) $97.02 97.01-87.76 87.75-78.97 #78.96
Characteristic (n = 342) (n = 341) (n = 341) (n = 341)
eGFR (ml/min/1.73 m2) 87.76(78.98,97.03) 107.36(100.45,115.98) 91.74(89.47,93.99)* 83.47(81.14,85.68)* 72.04(67.24,75.99)*
Age (years) 62.3669.82 60.5169.64 59.0568.93 62.0469.54 67.8468.83#
male sex [n (%)] 578(42.3%) 138(40.4%) 146(42.8%) 143(41.3%) 151(44.3%)
BMI (kg/m2) 25.61
63.51 25.5363.56 25.6563.68 25.5463.40 25.7363.41
WC (cm) 86.9069.78 86.2969.92 86.85610.27 86.5969.70 87.9069.17
Waist-hip ratio 0.8760.06 0.8760.06 0.8760.06 0.8760.07 0.8860.06
Current smoking [n (%)] 351(25.7%) 91(26.6%) 80(23.5%) 85(24.9%) 95(27.9%)
Hypertension [n (%)] 605(44.3%) 143(41.8%) 135(39.6%) 158(46.3%)* 169(49.6%)*
Diabetes mellitus [n (%)] 239(17.5%) 78(22.8%) 53(15.5%)* 52(15.2%)* 56(16.4%)*
Systolic BP (mm Hg) 130.79618.20 129.00618.29 128.77618.34 132.07617.18* 133.31
618.60*
Diastolic BP (mm Hg) 76.86610.71 77.51610.84 77.38610.66 76.5269.81 76.04611.45
Total cholesterol (mmol/L) 5.0760.91 4.9360.90 5.0960.87 5.1060.93 5.1860.92#
Triglyceride (mmol/L) 1.8161.22 1.7861.01 1.8561.29 1.8061.37 1.8161.21
HDL cholesterol (mmol/L) 1.4060.36 1.4160.39 1.4160.36 1.4360.35 1.3760.35
LDL cholesterol (mmol/L) 2.9960.70 2.9660.66 2.9760.70 3.0160.73 3.0160.72
Fasting glucose (mmol/L) 5.4261.68 5.5662.10 5.4861.43 5.3961.72* 5.28
61.37*
Uric acid (mmol/L) 291.31673.10 269.88671.47 280.42665.60#
297.31672.78#
317.71673.45#
Homocysteine (mmol/L) 19.1668.56 17.6967.33 18.0567.61 18.7968.58 22.1269.81#
hs-CRP (mg/dL) 0.22(0.14,0.34) 0.20(0.14,0.33) 0.21(0.12,0.33) 0.23(0.13,0.36) 0.25(0.16,0.36)#
Log NT-proBNP (pg/mL) 3.72(2.95,4.39) 3.54(2.86,4.22) 3.48(2.67,4.21) 3.72(2.94,4.32)#
4.14(3.42,4.85)#
Log hs-cTnT (pg/mL) 1.27(1.10,2.08) 1.10(1.10,1.94) 1.10(1.10,1.91) 1.26(1.10,2.13)# 1.67(1.10,2.31)#
Framingham risk score, % 9.00(6.00,15.00) 9.00(5.00,14.00) 8.00(5.00,13.00) 9.00(6.00,14.00) 11.00(7.00,18.00)#
Framingham risk score$20, no. (%) 202(14.8%) 48(14.0%) 35(10.34%) 46(13.5%) 72(21.1%)#
Note: Characteristics are reported as percentages for categorical variables and means (6SD) or median (with interquartile range) for continuous variables. The study participants were divided into four groups based on the level of the quartile of eGFR ($97.02, 97.01–87.76, 87.75–78.97,#78.96 mL/min/1.73 m2). Categorical variables are presented as counts and percentages. The values outside the parentheses are the number of subjects, and the values inside the parentheses are prevalence. The quartile 1 level of eGFR was used as the reference and the quartile 2,3,4 vs the quartile 1, respectively.
*,0.05 vs Quartile 1, #
,0.01 vs Quartile 1.
eGFR, estimated glomerular filtration rate; hs-cTnT denotes high-sensitivity cardiac troponin T; BMI, bodymass index; WC, waist circumference; BP, blood pressure; HDL, high-density lipoprotein; LDL, low-density lipoprotein; hs-CRP, high-sensitivity C-reactive protein; NT-proBNP, N-terminal pro B-type.
implied that other factors may have an effect on detectable hs-cTnT in normal-to-mild reduced renal function. While, high predicted Framingham CHD risk (representing traditional cardio-vascular risk factors) perhaps is the important ‘‘other factors’’.
Then in order to investigate the role of the predicted Framingham CHD risk in the relationship between eGFR and hs-cTnT, we evaluate the association between high predicted Framingham CHD risk (10-year risk$20%) and detectable hs-cTnT in subjects with different quartile levels of eGFR. The results showed that the high predicted Framingham CHD risk was independently associated with detectable hs-cTnT in different levels of eGFR in adjusted models. Furthermore, the OR for high predicted CHD risk increased with decreasing quartile levels of eGFR (quartiles 1 to 3) in normal-to-mild reduced renal function groups. However, the OR for high predicted Framingham CHD risk was abruptly decreased in the moderate-to-severe reduced renal function group (quartile 4). The results indicated that the association between high predicted Framingham CHD risk and detectable hs-cTnT gradually strengthened with decreasing levels of eGFR in normal-to-mild reduced renal function. However, this kind of association was weakened in moderate-to-severe reduced renal function. Combined with the results of table 3, one possible and reasonable explanation for the abruptly decreasing of OR was that eGFR had an effect on detectable hs-cTnT in moderate-to-severe reduced renal function. In other words, we thought that the high predicted Framingham CHD risk was independently associated with detectable hs-cTnT in all levels of eGFR, while reduced level of eGFR as an independent factor was added on
high predicted Framingham CHD risk in association with detectable hs-cTnT in moderate-to-severe reduced renal function. Our study was a cross-sectional survey and, as such, did not have the ability to determine the causes of hs-cTnT elevation in the context of impaired renal function. But our results suggest that sub-clinical myocardial injury due to cardiovascular risk factors (indicated by the high predicted Framingham CHD risk) maybe play a dominant role in hs-cTnT elevation. Our data also suggest that reduced hs-cTnT clearance was not independently associated with hs-cTnT elevations in subjects with normal or mildly reduced renal function. However, in the context of severely impaired renal function, both increased sub-clinical myocardial injury and reduced cTnT clearance may be responsible for elevated hs-cTnT levels. This is a complex issue and further studies are needed to clarify these relationships.
In the present study, GFR was estimated by modifying the MDRD equation based on data from a Chinese population. It offered significant advantages in different stages of chronic kidney disease (CKD). In particular, underestimation of GFR in CKD stages 1–2 was significantly improved, resulting in a lower overestimation of prevalence of reduced renal function if used in a Chinese population [19]. By using this equation, the prevalence of moderate-to-severe reduced renal function in our study was estimated to be 1.89%. This value was similar to the result from another community-based study in China in which the prevalence of decreased renal function was 1.7% [38].
The small number of the community-based population was limitation in the present study and these participants may not be fully representative of the general population. Moreover, the study population was Chinese and renal function was estimated by C-MDRD. Therefore, extrapolation of our results to other demo-Table 2.Pearson’s correlation and Multiple linear regression
analysis for the association between eGFR and the hs-cTnT levels.
Characteristic Univariable Multivariable
r P Value b P Value
Age, yr 0.213 ,0.001 0.112 ,0.001
Male sex 0.240 ,0.001 0.200 ,0.001
Hypertension 0.135 ,0.001 … …
Diabetes mellitus 0.121 ,0.001 … …
Current smoking 0.085 0.002 … …
BMI, kg/m2 0.022 0.409 … …
Systolic BP, mm Hg 0.078 0.004 … …
Diastolic BP, mm Hg 20.034 0.208 … …
Total cholesterol, mmol/L 20.056 0.039 … …
Triglyceride, mmol/L 20.005 0.853 … …
HDL cholesterol, mmol/L 20.110 ,0.001 … …
LDL cholesterol, mmol/L 0.023 0.401 … …
Fasting glucose, mmol/L 0.067 0.013 0.098 ,0.001
hs-CRP, mg/L 0.019 0.472 … …
Uric acid,mmol/L 0.136 ,0.001 … …
Homocysteine,mmol/L 0.194 ,0.001 … …
NT-proBNP, pg/mL 0.116 ,0.001 0.169 ,0.001
eGFR, mL/min/1.73 m2
20.143 ,0.001 20.069 0.009
Note: High-sensitivity cardiac troponin T levels were natural logarithm transformed. BMI, body-mass index; BP, blood pressure; HDL, high-density lipoprotein; LDL, low-density lipoprotein; hs-CRP, high-sensitivity C-reactive protein; NT-proBNP, N-terminal pro B-type natriuretic peptide; eGFR, estimated glomerular filtration rate.
doi:10.1371/journal.pone.0038218.t002
Table 3.Association between eGFR and detectable hs-cTnT.
Quartile 1 Quartile 2 Quartile 3 Quartile 4
$97.02 97.01-87.76 87.75-78.97 #78.96
Univariable model
Odds ratio 1 1.016 1.573 2.164
95% CI Reference 1.002–1.019 1.208–2.049 1.610–2.909
P 0.020 0.001 ,0.001
Model 1
Odds ratio 1 1.036 1.261 2.069
95% CI Reference 0.774–1.386 0.942–1.689 1.531–2.796
P 0.813 0.119 ,0.001
Model 2
Odds ratio 1 1.019 1.175 1.950
95% CI Reference 0.753–1.380 0.869–1.590 1.427–2.663
P 0.903 0.294 ,0.001
Model 3
Odds ratio 1 1.016 1.080 1.500
95% CI Reference 0.746–1.382 0.793–1.471 1.078–2.086
P 0.922 0.625 0.016
Note:
Model 1: Adjusted for the high predicted Framingham CHD risk (10-year risk .20%).
Model 2: Adjusted for model 1 plus levels of body mass index; waist circumference and waist-hip ratio.
Model 3: Adjusted for model 2 plus levels of fasting glucose, uric acid, high-sensitivity C-reactive protein, homocysteine and NT-proBNP.
graphic groups should be done with caution. This study was a cross-sectional survey and had no capability to get the cause and effect, so more exact conclusions should be confirmed by a prospective study.
In conclusion, hs-cTnT levels are detectable with a highly sensitive assay in a community-based Chinese population. Renal function is associated with hs-cTnT levels. eGFR levels and the high predicted Framingham CHD risk are conjunctly associated with detectable hs-cTnT in moderate-to-severe reduced renal function. Further, large and well-conducted studies are urgently required to provide more definitive evidence.
Acknowledgments
We thank colleagues at the Department of Laboratory Medicine, the PLA General Hospital for help with troponin T measurements. We are also grateful to all study participants for their participation in the study.
Author Contributions
Conceived and designed the experiments: FW PY. Performed the experiments: FW LL HW. Analyzed the data: YB RX. Contributed reagents/materials/analysis tools: FW YB RX. Wrote the paper: FW PY. Revised the manuscript: FW.
References
1. Foley RN, Collins AJ (2007) End-stage renal disease in the United States: an update from the United States Renal Data System. J Am Soc Nephrol 18: 2644–2648.
2. Best PJ, Lennon R, Ting HH, Bell MR, Rihal CS, et al. (2002) The impact of renal insufciency on clinical outcomes in patients undergoing percutaneous coronary interventions. J Am Coll Cardiol 39: 1113–1119.
3. Nakayama M, Sato T, Sato H, Yamaguchi Y, Obara K, et al. (2010) Different clinical outcomes for cardiovascular events and mortality in chronic kidney disease according to underlying renal disease: the Gonryo study. Clin Exp Nephrol 14: 333–339.
4. Kanbay M, Goldsmith D, Akcay A, Covic A (2009) Phosphate-the silent stealthy cardiorenal culprit in all stages of chronic kidney disease: a systematic review. Blood Purif 27: 220–230.
5. Apple FS, Murakami MM, Pearce LA, Herzog CA (2001) Predictive value of cardiac troponin I and T for subsequent death in end-stage renal disease. Circulation 106: 2941–2945.
6. Freda BJ, Tang WH, Van Lente F, Peacock WF, Francis GS (2002) Cardiac troponins in renal insufficiency: review and clinical implications. J Am Coll Cardiol 40: 2065–2071.
7. Tsutamoto T, Kawahara C, Yamaji M, Nishiyama K, Fujii M, et al. (2009) Relationship between renal function and serum cardiac troponin T in patients with chronic heart failure. Eur J Heart Fail 11: 653–658.
8. Wallace TW, Abdullah SM, Drazner MH, Das SR, Khera A, et al. (2006) Prevalence and determinants of troponin T elevation in the general population. Circulation 113: 1958–1965.
9. Omland T, de Lemos JA, Sabatine MS, Christophi CA, Rice MM, et al. (2009) A sensitive cardiac troponin T assay in stable coronary artery disease. N Engl J Med 361: 2538–2547.
10. Alpert JS, Thygesen K, White HD, Jaffe AS (2008) Implications of the universal definition of myocardial infarction. Nat Clin Pract Cardiovasc Med 5: 678–679.
11. Wilson PW, D’Agostino RB, Levy D, Belanger AM, Silbershatz H, et al. (1998) Prediction of coronary heart disease using risk factor categories. Circulation 97: 1837–1847.
12. Ruyi Xu, Ping Ye, Leiming Luo, Wenkai Xiao, Li Sheng, et al. (2011) Association between high-sensitivity cardiac troponin T and predicted cardiovascular risks in a community-based population. Int J Cardiol 149: 253–6. 13. Shankar A, Leng CL, Chia KS, Koh D, Tai ES, et al. (2008) Association between body mass index and chronic kidney disease in men and women: populationbased study of Malay adults in Singapore. Nephrol Dial Transplant 23: 1910–1918.
14. Latini R, Masson S, Anand I, Missov E, Carlson M, et al. (2007) The prognostic value of very low plasma concentrations of troponin T in patients with stable chronic heart failure. Circulation 116: 1242–1249.
15. deFilippi CR, Christenson RH, Gottdiener JS, Kop WJ, Seliger SL (2010) Dynamic cardiovascular risk assessment in elderly people. The role of repeated N-terminal pro-B-type natriuretic peptide testing. J Am Coll Cardiol 55: 441–450.
16. Chobanian AV, Bakris GL, Black HR, Cushman WC, Green LA, et al. (2003) Seventh report of the Joint National Committee on prevention, detection, evaluation, and treatment of high blood pressure. Hypertension 42: 1206–1252. 17. Hu J, Wallace DC, Jones E, Liu H (2009) Cardiometabolic health of Chinese older adults with diabetes living in Beijing, China. Public Health Nurs 26: 500–511.
18. Zhang LX, Zuo L, Xu GB, Wang F, Wang W, et al. (2007) Community-based screening for chronic kidney disease among populations older than 40 years in Beijing. Nephrol Dial Transplant 22: 1093–1099.
19. Ma YC, Zuo L, Chen JH, Luo Q, Yu XQ, et al. (2006) Modified glomerular filtration rate estimating equation for chinese patients with chronic kidney disease. J Am Soc Nephrol 17: 2937–2944.
Table 4.Association between the high predicted Framingham CHD risk (10-year risk.20%) and detectable hs-cTnT in different quartile level of eGFR.
Quartile 1 Quartile 2 Quartile 3 Quartile 4
$97.02 97.01-87.76 87.75-78.97 #78.96
Univariable model
Odds ratio 3.487 3.614 4.779 1.873
95% CI 1.822–6.673 1.791–7.292 2.133–10.706 1.0515–3.336
P ,0.001 ,0.001 ,0.001 0.033
Multivariable model 1a
Odds ratio 3.174 3.772 4.180 1.860
95% CI 1.634–6.164 1.639–8.685 2.009–8.698 1.372–2.533
P 0.001 0.002 ,0.001 ,0.001
Multivariable model 2b
Odds ratio 2.810 3.296 3.750 1.407
95% CI 1.397–5.654 1.311–8.284 1.753–8.020 1.131–1.751
P 0.004 0.011 0.001 0.002
Note:
aAdjusted for body mass index; waist circumference and waist-hip ratio.
20. Ford ES, Giles WH, Mokdad AH (2004) The distribution of 10-year risk for coronary heart disease among us adults: findings from the National Health and Nutrition Examination Survey III. J Am Coll Cardiol 43: 1791–1796. 21. Otsuka T, Kawada T, Ibuki C, Seino Y (2010) Association between
high-sensitivity cardiac troponin T levels and the predicted cardiovascular risk in middle-aged men without overt cardiovascular disease. Am Heart J 159: 972–978.
22. Kehl DW, Farzaneh-Far R, Na B, Whooley MA (2011) Prognostic value of electrocardiographic detection of unrecognized myocardial infarction in persons with stable coronary artery disease: data from the Heart and Soul Study. Clin Res Cardiol 100: 359–366.
23. Dickhout JG, Carlisle RE, Austin RC (2011) Interrelationship between cardiac hypertrophy, heart failure, and chronic kidney disease: endoplasmic reticulum stress as a mediator of pathogenesis. Circ Res 108: 629–642.
24. Thygesen K, Alpert JS, White HD (2007) Universal definition of myocardial infarction. J Am Coll Cardiol 50: 2173–2195.
25. Antman EM (2002) Decision making with cardiac troponin tests. N Engl J Med 346: 2079–2082.
26. Everett BM, Cook NR, Magnone MC, Bobadilla M, Kim E, et al. (2011) Sensitive Cardiac Troponin T Assay and the Risk of Incident Cardiovascular Disease in Women With and Without Diabetes Mellitus The Women’s Health Study. Circulation 123: 2811–2818.
27. Saunders SJ, Nambi V, de Lemos JA, Chambless LE, Virani SS, et al. (2011) Cardiac Troponin T Measured by a Highly Sensitive Assay Predicts Coronary Heart Disease, Heart Failure, and Mortality in the Atherosclerosis Risk in Communities. Circulation 123: 1367–1376.
28. Cardiovascular Disease in Dialysis Patients Work Group (2005) Clinical practice guidelines for cardiovascular disease in dialysis patients. Am J Kidney Dis 45(Suppl 4): S7–S153.
29. Berl T, Henrich W (2006) Kidney-Heart interactions: Epidemiology, pathogen-esis, and treatment. Clin J Am Soc Nephrol 1: 8–18.
30. Ninomiya T, Kiyohara Y, Kubo M, Tanizaki Y, Doi Y, et al. (2005) Chronic kidney disease and cardiovascular disease in a general Japanese population: The Hisayama Study. Kidney Int 68: 228–236.
31. Abbas NA, John RI, Webb MC, Kempson ME, Potter AN, et al. (2005) Cardiac troponins and renal function in nondialysis patients with chronic kidney disease. Clin Chem 51: 2059–2066.
32. Conway B, McLaughlin M, Sharpe P, Harty J (2005) Use of cardiac troponin T in diagnosis and prognosis of cardiac events in patients on chronic haemodialysis. Nephrol Dial Transplant 20: 2759–2764.
33. Turakhia MP, McManus DD, Whooley MA, Schiller NB (2009) Increase in end-systolic volume after exercise independently predicts mortality in patients with coronary heart disease: data from the Heart and Soul Study. Eur Heart J 30: 2478–2484.
34. Inrig JK, Patel UD, Briley LP, She L, Gillespie BS, et al. (2008) Mortality, kidney disease and cardiac procedures following acute coronary syndrome. Nephrol Dial Transplant 23: 934–940.
35. Sharma R, Gaze DC, Pellerin D, Mehta RL, Gregson H, et al. (2006) Cardiac structural and functional abnormalities in end stage renal disease patients with elevated cardiac troponin T. Heart 92: 804–809.
36. Diris JH, Hackeng CM, Kooman JP, Pinto YM, Hermens WT, et al. (2004) Impaired renal clearance explains elevated troponin T fragments in hemodi-alysis patients. Circulation 109: 23–25.