HESSD
10, 7733–7781, 2013Historic maps as a data source for
socio-hydrology
A. Zlinszky and G. Tim ´ar
Title Page
Abstract Introduction
Conclusions References
Tables Figures
◭ ◮
◭ ◮
Back Close
Full Screen / Esc
Printer-friendly Version Interactive Discussion
Discussion
P
a
per
|
Dis
cussion
P
a
per
|
Discussion
P
a
per
|
Discussio
n
P
a
per
|
Hydrol. Earth Syst. Sci. Discuss., 10, 7733–7781, 2013 www.hydrol-earth-syst-sci-discuss.net/10/7733/2013/ doi:10.5194/hessd-10-7733-2013
© Author(s) 2013. CC Attribution 3.0 License.
Geoscientific Geoscientific
Geoscientific Geoscientific
Hydrology and Earth System
Sciences
Open Access
Discussions
This discussion paper is/has been under review for the journal Hydrology and Earth System Sciences (HESS). Please refer to the corresponding final paper in HESS if available.
Historic maps as a data source for
socio-hydrology: a case study of the Lake
Balaton wetland system, Hungary
A. Zlinszky1,2,*and G. Tim ´ar3
1
Balaton Limnological Institute, Centre for Ecological Research, Hungarian Academy of Sciences, Klebelsberg Kuno ´ut 3, 8237 Tihany, Hungary
2
Department of Geodesy and Geoinformation, Vienna University of Technology, Gußhausstraße 27–29, 1040 Wien, Austria
3
Department of Geophysics and Space Science, Institute of Geography and Earth Science, E ¨otv ¨os Lor ´and University, P ´azm ´any P ´eter S ´et ´any 1/c, 1117 Budapest, Hungary
*
Invited contribution by A. Zlinszky, recipient of the EGU Young Scientists Outstanding Poster Paper Award 2010.
Received: 1 June 2013 – Accepted: 5 June 2013 – Published: 19 June 2013
Correspondence to: A. Zlinszky ([email protected])
HESSD
10, 7733–7781, 2013Historic maps as a data source for
socio-hydrology
A. Zlinszky and G. Tim ´ar
Title Page
Abstract Introduction
Conclusions References
Tables Figures
◭ ◮
◭ ◮
Back Close
Full Screen / Esc
Printer-friendly Version Interactive Discussion
Discussion
P
a
per
|
Dis
cussion
P
a
per
|
Discussion
P
a
per
|
Discussio
n
P
a
per
|
Abstract
Socio-hydrology is the science of human influence on the water cycle and the influence of the water cycle on human social systems. This newly emerging discipline inherently involves a historic perspective, often focusing on time scales of several centuries. While data on human history is typically available for this time frame, gathering information
5
on the hydrological situation during such a period can prove difficult: measured hydro-logical data for such long periods are rare, while models and secondary datasets from geomorphology, pedology or archaeology are typically not accurate enough over such a short period. In the first part of this study, the use of historic maps in hydrology is reviewed. Major breakthroughs were the acceptance of historic map content as valid
10
data, the use of preserved features for investigating situations earlier than the map, and the onset of digital georeferencing and data integration. Historic maps can be primary quantitative sources of hydro-geomorphological information, they can provide a context for point-based measurements over larger areas, and they can deliver time series for a better understanding of change scenarios.
15
In the second part, a case study is presented: Water level fluctuations of Lake Bala-ton were reconstructed from maps, levelling logs and other documents. An 18th century map system of the whole 5700 km2catchment was georeferenced, integrated with two 19th century map systems and wetlands, forests and open water digitized. Changes in wetland area were compared with lake water level changes in a 220 yr time series.
20
Historic maps show that the water level of the lake was closer to present-day levels than expected, and that wetland loss pre-dates drainage of the lake.
The present and future role of historic maps is discussed. Historic hydrological data has to be treated with caution: while it is possible to learn from the past, the assumption that future changes will be like past changes does not always hold. Nevertheless, old
25
HESSD
10, 7733–7781, 2013Historic maps as a data source for
socio-hydrology
A. Zlinszky and G. Tim ´ar
Title Page
Abstract Introduction
Conclusions References
Tables Figures
◭ ◮
◭ ◮
Back Close
Full Screen / Esc
Printer-friendly Version Interactive Discussion
Discussion
P
a
per
|
Dis
cussion
P
a
per
|
Discussion
P
a
per
|
Discussio
n
P
a
per
|
In the Appendix, a step-by-step guide to using historic maps in hydrology is given, starting from finding a map, through georeferencing and processing the map to publi-cation of the results.
1 Introduction
1.1 What is socio-hydrology?
5
Freshwater bodies are closely connected ecological, social and geomorphological sys-tems (Wetzel, 2001), and on any timescale longer than a few decades, the approaches and methods of these disciplines have to be fused with hydrology for in-depth investiga-tion of water resources (Sear and Arnell, 2006; Rice et al., 2010; Gilvear, 1999; James, 1999; Endreny, 2001; Widlok et al., 2012). From a human perspective, everyone has
10
a right to safe drinking water and sanitation, and ensuring this under global climate change is a challenge for aquatic sciences (United Nations, 2010). From an ecologi-cal perspective, it is well known that the availability of water as a resource is one of the most important controlling factors of habitat development and succession (Gerten, 2013). From the point of view of hydrology, the quantity, quality and movement of water
15
in the landscape has been the focus of scientific investigations since several centuries. The demand to combine and integrate these views has been repeatedly addressed in science and also recognized by policy initiatives such as HELP (Hydrology for Environ-ment, Life and Policy) by UNESCO (HELP Task Force, 2001) and the Water Framework Directive by the European Union (European Commission and European Parliament,
20
2000). The ever increasing human impact on the water cycle combined with the impor-tant role of water as a resource in forming human societies has led to the paradigm that the feedback between man and water, water and natural habitats, and natural habitats and man are each bidirectional. This is the framework of socio-environmental studies (Widlok et al., 2012).
HESSD
10, 7733–7781, 2013Historic maps as a data source for
socio-hydrology
A. Zlinszky and G. Tim ´ar
Title Page
Abstract Introduction
Conclusions References
Tables Figures
◭ ◮
◭ ◮
Back Close
Full Screen / Esc
Printer-friendly Version Interactive Discussion
Discussion
P
a
per
|
Dis
cussion
P
a
per
|
Discussion
P
a
per
|
Discussio
n
P
a
per
|
Socio-hydrology is the science of human influence on the water cycle and the influ-ence of water availability and quality on human social systems (Sivapalan et al., 2012). In a world affected by global change and human population growth, it is not enough to understand the natural processes governing the water cycle, it is also essential to know the cultural reasons for people influencing aquatic systems (Gregory, 2006).
5
Socio-hydrology is a context for decision support in order to ensure safe and sufficient access to clean water and protection from hydrological extremes (Di Baldassarre et al., 2013; Gober and Wheater, 2013). Governance with respect to hydrosystems increas-ingly requires a scientific background conscious not only of hydrological processes in natural systems but also past and future effects of human intervention (Yaeger et al.,
10
2013). Socio-hydrology is a use-inspired, interdisciplinary science (Srinivasan et al., 2013; Srinivasan, 2013) with the urgency and the ethical background similar to other newly emerged fields of crisis science (conservation biology, global change research, disaster mitigation).
1.2 Why bother with the past?
15
Human pressure on aquatic systems is increasing, and informed decisions based on scientific facts are necessary to mitigate or optimize this process (Hoffmann et al., 2010). Interest in the past is part of various sciences dealing with aquatic systems for different reasons. Long-term processes are of inherent interest to “pure” science (such as history or palaeohydrology) as they are the frame for the short-term processes we
20
perceive during a human lifetime. It is a general basis of scientific investigation that more data is better than less data, and therefore long-term records are often a per-spective for expanding our knowledge (such as in ecology or hydrology). Finally, en-gineering and management changes aquatic environments, and these changes are mostly intended to last several human generations.
HESSD
10, 7733–7781, 2013Historic maps as a data source for
socio-hydrology
A. Zlinszky and G. Tim ´ar
Title Page
Abstract Introduction
Conclusions References
Tables Figures
◭ ◮
◭ ◮
Back Close
Full Screen / Esc
Printer-friendly Version Interactive Discussion
Discussion
P
a
per
|
Dis
cussion
P
a
per
|
Discussion
P
a
per
|
Discussio
n
P
a
per
|
1.2.1 Ecology and conservation
Ecological processes often involve a lag in time, and recent studies have shown alarm-ing evidence that the current local extinction risk of species depends more on socioe-conomic pressures encountered a few decades ago than on the current rate of these pressures (Dullinger et al., 2013). This means that the negative (or positive) effect of
5
current human activities will not be fully realized until several decades in the future. In order to gain a deeper understanding of the processes affecting our current natu-ral capital (European Commission, 2011), historic human activities (and hydrological processes) have to be investigated.
Water regime is a major driver of ecological changes in lake systems (Coops et al.,
10
2003). Especially changes in shore vegetation can not be understood without informa-tion on historic condiinforma-tions on a time scale of centuries (Ostendorp, 1989). The Water Framework Directive allows member states to use palaeoecological or historic data to support the development of models of reference conditions for good ecological quality (European Commission and European Parliament, 2000).
15
Deliberate changing of aquatic system properties (“water management”, aka. hydro-engineering) will have a profound effect on plant and animal communities (Gilvear, 1999), and while this is inherently difficult to study through controlled experiments, it is necessary to make predictions in order to conserve biodiversity despite (or through) river engineering (Rice et al., 2010). The other way round, vegetation is well known to
20
influence shore erosion and sediment accumulation, which often means water man-agement projects need to include the ecological engineering aspect.
1.2.2 Hydro-engineering
Humans have modified rivers, lakes and floodplain systems since ancient times, and continue to do so (Gregory, 2006). Present-day aquatic systems management aims to
25
HESSD
10, 7733–7781, 2013Historic maps as a data source for
socio-hydrology
A. Zlinszky and G. Tim ´ar
Title Page
Abstract Introduction
Conclusions References
Tables Figures
◭ ◮
◭ ◮
Back Close
Full Screen / Esc
Printer-friendly Version Interactive Discussion
Discussion
P
a
per
|
Dis
cussion
P
a
per
|
Discussion
P
a
per
|
Discussio
n
P
a
per
|
of hydro-engineering and hydro-geomorphology (Gilvear, 1999; James, 1999) and also the acceptance of palaeohydrology as a science in its own right with implications for current water resource management (Gregory and Benito, 2003b; Sear and Arnell, 2006). A good estimate of future extreme events is necessary for river engineering, and palaeohydrological quantifications of such events can be used to assign rough
5
probabilities to their recurrence in the future (Gregory and Benito, 2003a; Craciunescu et al., 2010).
In many cases, modern river management is difficult because little or no quantitative information exists on the natural sediment dynamics before the artificial modification. Many major rivers in Europe were modified by humans centuries or millennia ago, so
10
the original, natural status is impossible to quantify. Palaeohydrology works on the ge-ological time scale (Baker, 2003), not being able to deal with higher temporal resolution investigations on the century scale due to the uncertainty of chronological constraints (Gregory and Benito, 2003a).
1.2.3 Hydrology
15
Taking a historic and process-based perspective when studying watershed processes is recommended for “pure” theoretical hydrological studies (Harman and Troch, 2013). Without information on historic changes, it might be assumed that the hydrological situation is static over time (James, 1999), while given information on earlier states of a watershed, the changes can be used to inform hydrological models (Yaeger et al.,
20
2013).
However, palaeohydrological data is inherently sparse: fluvial or lake records dating back to more than a few decades are exceptionally rare (Baker, 2003). Other explo-ration methods suffer from the lack of spatial and temporal coverage, the uncertainty of interpretation, poor chronological constraints and the complexity of the processes
25
HESSD
10, 7733–7781, 2013Historic maps as a data source for
socio-hydrology
A. Zlinszky and G. Tim ´ar
Title Page
Abstract Introduction
Conclusions References
Tables Figures
◭ ◮
◭ ◮
Back Close
Full Screen / Esc
Printer-friendly Version Interactive Discussion
Discussion
P
a
per
|
Dis
cussion
P
a
per
|
Discussion
P
a
per
|
Discussio
n
P
a
per
|
the period where human influence on aquatic systems rapidly increased. Changes that happened more closely in time to the present are more important for understanding the present situation (Gilvear, 1999), and therefore, historic hydrological processes are especially interesting for socio-hydrology (Srinivasan, 2013).
1.2.4 Socio-hydrology
5
Socio-hydrology relies heavily on understanding historical processes in order to learn how the present hydrological and social situation has been established, what the in-herent fluctuation in the system is and how it has been dealt with (successfully or unsuccessfully) in the past (Yaeger et al., 2013; Srinivasan et al., 2012). In the typ-ical case, histortyp-ical socio-hydrologtyp-ical investigations can be of quantitative nature as
10
long as there are quantitative hydrological records available, and turns qualitative or model-based in the lack of these. History as a science in the humanity domain is rarely quantitative, and the accuracy of hydrological indicators such as palynology, geomor-phology or pedology within a timeframe of centuries is also limited. Therefore, a “data gap” exists in socio-hydrology, at the scale of centuries to decades. Historical
informa-15
tion often lacks the direct accuracy of instrumental or experimental evidence. There-fore, many scientists and engineers are reluctant to use historical methods because the evidence may be anecdotal, incomplete and less quantifiable than records derived from recent instrumental measurements (James, 1999).
1.3 Objective
20
The objective of this study is to propose historic maps as a quantitative data source widely available for historical socio-hydrology. The methods for processing historic spa-tial data in a quantitative and repeatable way are reviewed, together with applications in socio-(eco)-hydrology. A selected case study is presented in detail, where the aim is to revisit a well-established socio-hydrological concept on a major European Lake. Finally,
HESSD
10, 7733–7781, 2013Historic maps as a data source for
socio-hydrology
A. Zlinszky and G. Tim ´ar
Title Page
Abstract Introduction
Conclusions References
Tables Figures
◭ ◮
◭ ◮
Back Close
Full Screen / Esc
Printer-friendly Version Interactive Discussion
Discussion
P
a
per
|
Dis
cussion
P
a
per
|
Discussion
P
a
per
|
Discussio
n
P
a
per
|
a brief step-by-step guide for using historic maps in GIS (Geoinformation Systems) for socio-hydrology is provided.
1.4 The use of historic maps for hydrology: state of the art
Water conditions of historic times can be estimated from historic documents, archae-ology, abrasion forms, dendrochronarchae-ology, sediment studies or palynology (Cholnoky,
5
1918; Bendefy and Nagy, 1969; Kern et al., 2009; Szanto and Medzihradszky, 2004; Z ´olyomi and Nagy, 1991; Cserny and Nagy-Bodor, 2000; Manville et al., 2007; Kre-mer, 2012; L ´oczy, 1913). While these methods can provide representative and reliable data given certain circumstances, and are thus the mainstream methods of historic (or palaeo-) hydrology in general, their temporal resolution is rarely sufficient to represent
10
the timescales typical for socio-hydrology, and their spatial coverage is often limited. As uniform spatial models of the Earth’s surface, maps provide area-wide repre-sentation of landscape features relevant to the time and purpose of surveying (Rum-sey and Williams, 2002). Maps involve a defined scale and legend (otherwise it is not a map). Relying on the map scale, spatially accurate and quantitative analysis is
pos-15
sible. Based on the map legend, interpretation is straightforward and unambiguous as long as the map is preserved in good condition.
During the early days of cartographic science, with the rapid evolution of geodesy, new maps were thought to be inherently better and more accurate than older maps, and historic maps were therefore not studied in detail. In the initial stage of historic
20
map investigations, differences compared to the current situation were assessed by cartometric techniques and regarded as errors (Stegena, 1982; Cholnoky, 1918).
1.4.1 Breakthrough 1: change detection instead of error detection
Systematic studies of hydrological change based on historic maps probably began in the 1950s and 1960s, still including a critical approach to map content. An early
25
HESSD
10, 7733–7781, 2013Historic maps as a data source for
socio-hydrology
A. Zlinszky and G. Tim ´ar
Title Page
Abstract Introduction
Conclusions References
Tables Figures
◭ ◮
◭ ◮
Back Close
Full Screen / Esc
Printer-friendly Version Interactive Discussion
Discussion
P
a
per
|
Dis
cussion
P
a
per
|
Discussion
P
a
per
|
Discussio
n
P
a
per
|
the shoreline of Lake Balaton through a detailed investigation of historic maps and documents. While spatial accuracy is practically not assessed in this book, compara-ble archaeological, geomorphological, sedimentological evidence together with written records and surveys are elaborately used for investigation of content accuracy.
During the 1970s and 1980s, image processing technology did not allow distortion
5
of maps for georeferencing, and the correctness of historic map content was still not widely accepted. Nevertheless, quantitative studies were already possible (Klimek and Trafas, 1972; S ´agi, 1968; Braga and Gervasoni, 1989; Bravard et al., 1986). The book of Petts, M ¨oller and Roux (eds) (1989) provides an excellent overview of the state of the art of fluvial historic investigations before the onset of GIS georeferencing of historic
10
maps. The uses for historic maps in river studies listed by this book are the following: qualitative uses can be change detection, classification of planform morphology, clas-sification of types of change, dating and zoning of the floodplain. Possible quantitative investigations include measurement of channel or reach characteristics and meander characteristics (Hooke and Redmond, 1989).
15
The next major step was to finally move from an error-detection perspective to the working hypothesis that the surveyed content of a historic map is assumed to be cor-rect. The result of this new approach is that even in cases where the map appears at first sight to show something impossible, it is worth investigating how it could have been correct at the time. The example of the Lazarus map (1528) illustrates this: first,
20
the apparently incorrect Northern direction of the map was resolved by realizing that it has the projection of Ptolemy (Tim ´ar et al., 2008a). The topography of major rivers was also assumed to be incorrect, but was proved correct or at least possible in the investigated cases (Sz ´ekely, 2009). Finally, a lake of several hundred km2 shown on the map in a nowadays dry lowland was spectacularly traced by a major flood and thus
25
HESSD
10, 7733–7781, 2013Historic maps as a data source for
socio-hydrology
A. Zlinszky and G. Tim ´ar
Title Page
Abstract Introduction
Conclusions References
Tables Figures
◭ ◮
◭ ◮
Back Close
Full Screen / Esc
Printer-friendly Version Interactive Discussion
Discussion
P
a
per
|
Dis
cussion
P
a
per
|
Discussion
P
a
per
|
Discussio
n
P
a
per
|
addition, areas inaccessible for surveying were typically drawn based on assumptions (Podobnikar, 2009).
1.4.2 Breakthrough 2: some features can be a lot older than the map
Historic maps may not only be used to draw consequences about the hydrological sit-uation contemporary with the survey: they often contain signatures of sitsit-uations in the
5
earlier past, such as old river arms, vegetation boundaries or other features that allow even quantitative investigation (Large, 1996; Aston, 1985; Bravard, 2010). These might have been prominent during the time of the survey, but are mostly unrecognizable in the present-day landscape. On one hand, once such hydrological features are inactive, they are preserved in the landscape for thousands of years, which means historic maps
10
can deliver information on a geological timescale (Tim ´ar et al., 2001, 2010b; Passmore and Macklin, 2000; Taylor and Lewin, 1996; Bondesan and Furlanetto, 2012; Popov et al., 2008). On the other hand, rivers react very sensitively to differential tectonic up-lift, which can be analysed if historic maps show the original channels (Adams, 1980; Tim ´ar, 2003; Piˇs ´ut, 2006; Zamolyi et al., 2010; Petrovszki and Tim ´ar, 2010; Kov ´acs,
15
2010). Archaeological investigations have also benefitted from interpretation of prehis-toric features on georeferenced hisprehis-toric maps (S ¨umegi, 2003; Toth, 2008; Raczky and Anders, 2009; Gyucha et al., 2011).
Maps have long been used as sources of information for long-term studies, but the possible accuracy of processing was often not considered sufficient for quantitative
20
applications (Rumsey and Williams, 2002). Many very recent studies therefore still do not deal with spatial ground control of the maps they use, for various reasons: the survey can be considered accurate and consistent in itself (Bravard, 2010), the study might be of qualitative nature (Herget et al., 2005; Herget, 2000; Gercs ´ak, 2009), or finding control points could be difficult (Piˇs ´ut, 2002; Anthony and Blivi, 1999).
HESSD
10, 7733–7781, 2013Historic maps as a data source for
socio-hydrology
A. Zlinszky and G. Tim ´ar
Title Page
Abstract Introduction
Conclusions References
Tables Figures
◭ ◮
◭ ◮
Back Close
Full Screen / Esc
Printer-friendly Version Interactive Discussion
Discussion
P
a
per
|
Dis
cussion
P
a
per
|
Discussion
P
a
per
|
Discussio
n
P
a
per
|
1.4.3 Breakthrough 3: digital georeferencing, processing and distribution of historic maps
During the last few years, the implementation of projection transformation in GIS and the spread of digital aerial imaging have resulted in an increasing number of method-ological studies concerning georeferencing of remotely sensed data. A deeper
under-5
standing of historic cartography and the migration of remote sensing processing tech-nology to commercial GIS software has led to new, digital methods for transforming scanned historic maps (Leys and Werritty, 1999; Moln ´ar, 2010), eventually even imple-mented in free software (Armas et al., 2013). Probably the work of Mossa and McLean (1997) is the first to describe a full workflow for georeferencing, digitizing and statistical
10
evaluation of historic maps in a GIS environment. Systematic distortions of the map sheet (caused by miscalculations, shrinking of the paper, unknown geodetic basis) were corrected, while local (random) errors were preserved, as a measure of accuracy or a basis for change detection. This was a revolutionary step in the use of historic maps. Much better time series overlays could be produced, and maps compiled
be-15
fore the era of triangulation-based surveying from astronomical geodesy could also be georeferenced, some with surprising accuracy. This meant that historic data excluded from earlier studies were now included, effectively broadening the possible timeframe by several centuries. Small-scale maps covering entire nations could also be studied together with more precise 18–19th century country maps, which was an advantage
20
especially in areas where a long series of maps was conserved (Braga and Gervasoni, 1989; Pettersen, 2009; Bravard, 1989; Bruna et al., 2010; Krejci and Cajthaml, 2009).
Another major step enabled by GIS technology was the spatially explicit compari-son with data gained from other sources, allowing verification (Pasternack et al., 2001) and more accurate timing (Tim ´ar and G ´abris, 2008). Correlations in time and space
25
HESSD
10, 7733–7781, 2013Historic maps as a data source for
socio-hydrology
A. Zlinszky and G. Tim ´ar
Title Page
Abstract Introduction
Conclusions References
Tables Figures
◭ ◮
◭ ◮
Back Close
Full Screen / Esc
Printer-friendly Version Interactive Discussion
Discussion
P
a
per
|
Dis
cussion
P
a
per
|
Discussion
P
a
per
|
Discussio
n
P
a
per
|
hydrological models allowed conclusions on the effect of social changes on aquatic systems even in cases where no deliberate modification of the water body by aquatic engineering has taken place. Some notable examples describe the variation in sedi-ment load of waters in relation to historic land use change (Szilassi et al., 2006; Zlin-szky et al., 2008).
5
Quantitative measures of river discharge and dynamics can be obtained from digi-tized channel outlines of meandering or braided rivers. Some of these studies remain in the geomorphology domain (Petrovszki et al., 2012; Petrovszki and Tim ´ar, 2010; Tim ´ar, 2003; Szab ´o et al., 2004; Tim ´ar et al., 2001), but cases exist where human influence is taken into account (Comiti et al., 2011; Ziliani and Surian, 2012; Kiss et al., 2008) or
10
water resource management is the question in focus (Tim ´ar and G ´abris, 2008; Craci-unescu et al., 2010; Day et al., 1990; Zlinszky and Moln ´ar, 2008, 2009). Based on the interpretation of historic maps, ecological changes caused by human interventions in river and lake systems can also be quantified (Bravard et al., 1986; D ¨om ¨ot ¨orfy et al., 2003; Comiti et al., 2011).
15
The final step was web distribution: databases now allow rapid search and identifi-cation of historical geospatial information (M ´arton and Gede, 2009; Rycht ´aˇr, 2012).
The state of the art is accurate georeferencing of maps of large areas and compara-tive integration of GIS data derived from multiple historic maps, together with quantita-tive investigations of other sources. As the following case study shows, this approach
20
HESSD
10, 7733–7781, 2013Historic maps as a data source for
socio-hydrology
A. Zlinszky and G. Tim ´ar
Title Page
Abstract Introduction
Conclusions References
Tables Figures
◭ ◮
◭ ◮
Back Close
Full Screen / Esc
Printer-friendly Version Interactive Discussion
Discussion
P
a
per
|
Dis
cussion
P
a
per
|
Discussion
P
a
per
|
Discussio
n
P
a
per
|
2 Case study: historic water level fluctuations and wetland loss in the Lake Balaton catchment
2.1 Study area: Lake Balaton 2.1.1 General description
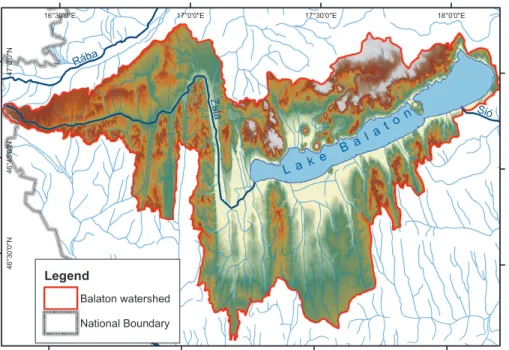
The largest lake in Central Europe, Lake Balaton is located in Western Hungary (Fig. 1).
5
The lake has a surface area of 597 km2at the current mean service water level, which is 105 m a.s.l. (throughout this case study, “sea level” refers to the Adriatic elevation benchmark). The Eastern basin of the lake is drained by the Si ´o River to the Danube, and most of the tributaries enter the Western basins. The long-term water balance of the lake is strongly controlled by evaporation, with annually approximately 900 mm of
10
water evaporating from the surface, 600 mm drained through the outflow, 900 mm of water inflow from the tributaries and 600 mm of precipitation on the lake surface (Vir ´ag, 1998). The 5700 km2 catchment is located in a landscape of rolling hills to the West and South of the lake, and dolomite and volcanic mountains reaching 599 m a.s.l. to the North. Most valleys leading to the lake have gentle slopes and wide floors, and held
15
large wetland systems in historic times.
On a geological timescale, Lake Balaton is a very young formation, existing since 15 000 YBP as separate sub-basins with a maximum water level of 112 m a.s.l. (Cserny and Nagy-Bodor, 2000) but permanently joined since 5000–7000 YBP (S ¨umegi et al., 2008). Several hypotheses exist for the formation of the lake, detailed especially in
20
Horv ´ath and Dombr ´adi (2010), but the general view is that the lake was formed by neo-tectonic processes changing the previously established drainage network and creating a series of depressions (S´ıkhegyi, 2002; Fodor et al., 2005). The strong seiche- and wave-induced abrasion, which occurred during the periods when these were joined, eroded the ridges between the sub-basins and finalized their connection. The area still
25
HESSD
10, 7733–7781, 2013Historic maps as a data source for
socio-hydrology
A. Zlinszky and G. Tim ´ar
Title Page
Abstract Introduction
Conclusions References
Tables Figures
◭ ◮
◭ ◮
Back Close
Full Screen / Esc
Printer-friendly Version Interactive Discussion
Discussion
P
a
per
|
Dis
cussion
P
a
per
|
Discussion
P
a
per
|
Discussio
n
P
a
per
|
2.2 Socio-hydrology of Lake Balaton
The establishment of a single permanent lake basin instead of the periodically con-nected sub-basins is dated to the late Neolithic, so human presence in the area actu-ally pre-dates the formation of Lake Balaton in its current state. In historic documents, there are many discussed cases of artificial manipulations of the water level (Bendefy
5
and Nagy, 1969; Vir ´ag, 1998, 2005).
Records from the last few centuries suggest at least 1 m of annual water level fluctu-ation, and 2–3 m on a decadal scale. According to archaeological evidence, the mean water levels were relatively close to the present-day situation throughout history, con-trolled by the sandbank across the outlet of the Si ´o river, which probably resulted in
10
periodic floods and outflow events (Vir ´ag, 1998).
During the 18th century, the idea of draining Lake Balaton was raised together with the plan to link the agricultural areas of the Hungarian Plain to the grain market in the city of Graz by means of shipping canals (Bendefy and Nagy, 1969). However, this was not realized due to financial reasons for more than a century. The railway
15
line along the southern shore was built during an extremely dry period in the mid-19th century. It was sited along the sandbar between the lake and the agricultural areas of the shore. The highest previously recorded water level was 106.73 m a.s.l., therefore the elevation of the railway tracks was fixed at 107.61 m and considered as a sufficient safety margin. However, during the winter of 1860–1861 and 1861–1862, blocks of ice
20
were deposited on the tracks by storms. Regulating the water level was estimated to be cheaper than relocating the track, so the expansion of the Si ´o canal was funded by the railway company on the condition that the water of Lake Balaton had to be lowered by at least a meter. The sluice and lock system at the outflow of the Si ´o river from the lake was opened in 1863, introducing an artificial water regime of the lake (Meissner, 1867).
25
HESSD
10, 7733–7781, 2013Historic maps as a data source for
socio-hydrology
A. Zlinszky and G. Tim ´ar
Title Page
Abstract Introduction
Conclusions References
Tables Figures
◭ ◮
◭ ◮
Back Close
Full Screen / Esc
Printer-friendly Version Interactive Discussion
Discussion
P
a
per
|
Dis
cussion
P
a
per
|
Discussion
P
a
per
|
Discussio
n
P
a
per
|
sluice, the water level of the lake decreased temporarily by about a meter, but returned to its previous elevation during the next decade.
2.2.1 State of the art concerning Lake Balaton and wetland water levels
Bendefy (1969) describes water levels around 110 m a.s.l. between the 13th and 18th century, based on investigations of historic maps, documents and archaeological data.
5
This is a well-established concept in Hungarian hydrology and water management (Padis ´ak, 2005). Such a high water level would have been sufficient for the lake to flood most of its historic tributary wetlands completely, covering about 900 km2. This surface was calculated to approximately represent equilibrium between evaporation and inflow (Nov ´aky, 2005). The theory that the tributary wetlands around the lake were lost to the
10
artificial drainage of Balaton is also widely accepted: as the water level shifted from 110 m to 105 m the valleys are assumed to have ran dry and their wetlands are sup-posed to have been reduced (Moln ´ar and Kutics, 2013; Padis ´ak, 2005). This concept has widespread implications on the lake: one of the objectives of present-day water level management on Lake Balaton is to raise the water levels, while the protection of
15
the historic tributary wetlands is deemed impossible due to the changed water level situation in the lake. In the following case study, this paradigm is investigated based on quantitative analysis of historic maps.
3 Methods
3.1 Historic maps of Lake Balaton: contents and properties
20
3.1.1 Surveying and content of the Krieger map (1776)
HESSD
10, 7733–7781, 2013Historic maps as a data source for
socio-hydrology
A. Zlinszky and G. Tim ´ar
Title Page
Abstract Introduction
Conclusions References
Tables Figures
◭ ◮
◭ ◮
Back Close
Full Screen / Esc
Printer-friendly Version Interactive Discussion
Discussion
P
a
per
|
Dis
cussion
P
a
per
|
Discussion
P
a
per
|
Discussio
n
P
a
per
|
Gumpendorf: optical levelling, measuring table triangulation and astronomical geodesy (Bendefy, 1972). The most prominent landmarks were sighted with a telescope rule and marked on the draft of the map, with the details of the landscape filled in by free hand. The scale is 1 : 34 560 and is based on the standard measurement units of the time and area: 500 viennese fathoms in the terrain were mapped to 1 viennese inch on the map
5
sheet. 1 viennese fathom corresponds to 1.89 m. Krieger also described the lake in text (Krieger, 1776; Zlinszky and Moln ´ar, 2009), including measured water discharges and mill dam heights on the tributaries, water level fluctuations, shore characteristics and agricultural land use. The map contains bathymetric lines that correspond to different drainage scenarios, together with the planned canal system.
10
3.1.2 Surveying and content of the Habsburg Military Surveys
The second half of the 18th century was also the time of the first countrywide large-scale surveys. This is explained on one side by the increased need for accurate terrain data for artillery and cavalry-based warfare, and on the other side by the possibility of creating map systems of accurately conjoined sheets due to the precision of
triangula-15
tion and the representation of the Earth as a globe.
The First Habsburg Military Survey (Fig. 3) was initiated in 1763 (Jank ´o, 2007), and the surveying (continued over several decades) reached the Lake Balaton area around 1780. This map system is unique for its time in its coverage of six present-day countries with a mapping scale of 1 : 28 800, and is thus an invaluable source for environmental
20
history and conservation. With details even including the size and shape of every sin-gle building, it demonstrates the state of the Austrian Empire before industrialization, modern agriculture or long-distance transport, an important benchmark for hydrology (Petts, 1989).
Wetlands, rivers and fords were of high military importance, and mapped to a
con-25
HESSD
10, 7733–7781, 2013Historic maps as a data source for
socio-hydrology
A. Zlinszky and G. Tim ´ar
Title Page
Abstract Introduction
Conclusions References
Tables Figures
◭ ◮
◭ ◮
Back Close
Full Screen / Esc
Printer-friendly Version Interactive Discussion
Discussion
P
a
per
|
Dis
cussion
P
a
per
|
Discussion
P
a
per
|
Discussio
n
P
a
per
|
different sheets is rather similar and was resolved on the basis of the written documen-tation compiled during the survey (Dobai, 1983). According to the order of the Royal Military Council (Hofkriegsrat), these survey logs were required to contain “whether the swamps and wetlands can be traversed on horseback or foot, whether this is only pos-sible in some seasons, or if they run dry regularly” (Jank ´o, 2007). Areas described as
5
under shallow water the whole year round with vegetation covering the surface were considered wetlands for our study.
The Second Habsburg Military Survey (Fig. 3) was launched in the early 19th cen-tury, immediately after the First Survey was finished, recognizing the evolution of map-ping methods, especially cartographic projections (Hofst ¨atter, 1989; Kretschmer et al.,
10
2004; Tim ´ar et al., 2006). This map system was to have the same scale as the first, but supported by a well defined mathematical projection and a uniform map legend. Since surveying methods were faster with the onset of optical distance measurement, more triangulation points were surveyed and less detail added by hand. Around Lake Balaton, the survey was carried out in the 1830s, therefore providing a benchmark of
15
the hydrological situation of the Lake before the regulation of the water level.
The Third Habsburg Military Survey (Fig. 3) was completed in the 1870s in the Lake Balaton region. This was the first mapping scheme to use the metric system, adjust-ing the scale to 1 : 25 000. The representation of elevation with levelled contours and benchmark heights was introduced, and land cover classes were represented in more
20
detail. Due to historical reasons, some of these map sheets are no longer available in their original coloured format, only in black and white print copies with letters repre-senting the land cover categories.
3.2 Processing of the maps to GIS data
3.2.1 Processing the Krieger Map and the lake water levels
25
HESSD
10, 7733–7781, 2013Historic maps as a data source for
socio-hydrology
A. Zlinszky and G. Tim ´ar
Title Page
Abstract Introduction
Conclusions References
Tables Figures
◭ ◮
◭ ◮
Back Close
Full Screen / Esc
Printer-friendly Version Interactive Discussion
Discussion
P
a
per
|
Dis
cussion
P
a
per
|
Discussion
P
a
per
|
Discussio
n
P
a
per
|
Krieger map with a digital bathymetric model of the lake. The water level derived from the Krieger map was compared with other documented water level records of the pe-riod before the gauge was established. However, it was taken into account that different reconstruction methods produce different accuracies. The large number of points from bathymetric contour tracing allowed for statistical error assessment by comparing two
5
independent point sets. Some water level recordings exist in historical survey docu-ments that refer to an elevation system which can be linked to present-day elevations (Meissner, 1867; Vir ´ag, 1998; Lotz, 1973; S ´agi, 1968). These were also considered accurate representations of historic water level, subject only to measurement error. Some previous authors also analysed other historic maps of the region and compared
10
the shorelines with present-day elevation maps (S ´agi, 1968; Bendefy and Nagy, 1969). The results estimated with this method are less well established and often contradictory within periods or even single maps. Finally, some written records exist of extreme water levels being higher or lower than the water levels in other years (Vir ´ag, 1998, 2005). Since these are not based on documented measurements, they have to be treated with
15
care.
3.2.2 Georeferencing of the First Military Survey
Paper originals of the Military survey maps are preserved at the Austrian Military Archives (Kriegsarchiv), but have been scanned and are commercially available on DVD (Tim ´ar et al., 2006, 2010a; Tim ´ar and Moln ´ar, 2006; Biszak et al., 2007). The map
20
sheets of the First Military Survey probably have a Cassini projection with the tie point near the origin of the current Hungarian mapping system, but since no written evidence of this is known, it was decided to georeference them individually. The fit of the sheet edges creates a problem for georeferencing: if they were stitched to a single image, low-order polynomial transformations would not produce sufficient fitting accuracies.
25
HESSD
10, 7733–7781, 2013Historic maps as a data source for
socio-hydrology
A. Zlinszky and G. Tim ´ar
Title Page
Abstract Introduction
Conclusions References
Tables Figures
◭ ◮
◭ ◮
Back Close
Full Screen / Esc
Printer-friendly Version Interactive Discussion
Discussion
P
a
per
|
Dis
cussion
P
a
per
|
Discussion
P
a
per
|
Discussio
n
P
a
per
|
the georeferenced sheets will not fit together at the edges. This was solved by applying the method of Moln ´ar (2010), which allows individual third order polynomial transfor-mation functions for every map sheet, but introduces and enforces a mathematical constraint that the edges must fit.
In order to gain seamless coverage of the whole Lake Balaton watershed (5700 km2),
5
51 map sheets were georeferenced, each with a minimum of 10 ground control points. Corners of buildings were preferred as such points since they can be accurately local-ized in space provided that the building was unchanged. The Hungarian Art Memorial crowdsourcing database www.muemlekem.hu (Kunszt and Kov ´acs, 2012) was used as a register: almost any building originating from the 18th century is officially
pro-10
tected and listed. The database was queried for each settlement in the study area, the buildings located by street address, and the coordinates read from a current 1 : 10 000 scale digital topographic map of Hungary. After this step, the corresponding point of the Military Survey map sheet was also located, the transformation function calculated, and the map image warped. Reports from the more than 500 control points involved
15
show an average RMS (Root Mean Square) error of 140 m (SD 131 m, min. 3 m, max. 708 m).
The Second and Third Military survey were complied based on a regular mathemat-ical projection with known details (Jank ´o, 2007), however, the geodetic datum of the Third survey has significant internal distortion because of the incomplete adjustment
20
(Moln ´ar and Tim ´ar, 2009). These maps are commercially available in a georeferenced format, reprojected with correction of the internal distortion (Biszak et al., 2007). The catchment area of Lake Balaton was clipped from both of these maps and used for subsequent processing.
3.2.3 Digitizing of the Habsburg Military Survey maps and data analysis
25
HESSD
10, 7733–7781, 2013Historic maps as a data source for
socio-hydrology
A. Zlinszky and G. Tim ´ar
Title Page
Abstract Introduction
Conclusions References
Tables Figures
◭ ◮
◭ ◮
Back Close
Full Screen / Esc
Printer-friendly Version Interactive Discussion
Discussion
P
a
per
|
Dis
cussion
P
a
per
|
Discussion
P
a
per
|
Discussio
n
P
a
per
|
the 18th century elevation profiles of the water level in each tributary wetland were ex-amined in detail (Zlinszky, 2010). Minor errors of the digitized boundary position and fit of coincident edges were corrected using the topology module of the open source GIS software GRASS. As a basis for comparison, the summed present-day area of the wetlands in the watershed was calculated from the CORINE land cover 2000 database
5
(European Environmental Agency, 2000). In the final stage, changes in wetland area were compared with the water levels reconstructed from the Krieger map, other litera-ture and the water gauge records.
4 Results
4.1 Revisited water levels of Lake Balaton
10
Based on measurements from the Krieger map and data published in the literature, the water level trends of Lake Balaton during the last 260 yr were reconstructed (Fig. 4). The pre-regulation data can be regarded as a document of the natural water regime of the lake, not forgetting the fact that this is already influenced by human land use. Water levels fluctuated around 106 m a.s.l., (1 m above the current lake surface), while the
15
earliest confirmed water level (Zlinszky, 2010) is at 107 m. For several decades after 1776, no reconstructions are available, and the water level estimations preceding 1776 are rather uncertain as they are from manual measurements of non-georeferenced maps (S ´agi, 1968). The confirmed lake levels for the early 19th century have a range of 2.3 m, which represents the decadal variation, while according to a contemporary
20
written description by a surveying hydroengineer (Krieger, 1776), the annual fluctuation could reach 1.2 m.
Unfortunately, the water levels of the decades before the opening of the outlet canal are poorly documented, with most estimates based on manual comparison of historic maps with elevation contours. A transition from a mean of 106 m a.s.l. to 105 m can
25
HESSD
10, 7733–7781, 2013Historic maps as a data source for
socio-hydrology
A. Zlinszky and G. Tim ´ar
Title Page
Abstract Introduction
Conclusions References
Tables Figures
◭ ◮
◭ ◮
Back Close
Full Screen / Esc
Printer-friendly Version Interactive Discussion
Discussion
P
a
per
|
Dis
cussion
P
a
per
|
Discussion
P
a
per
|
Discussio
n
P
a
per
|
of the sluice are derived from levellings of Meissner (1867), linked to the Hungarian Geodetic Datum by Bendefy (1958). The regulated water levels of the lake initially show a decadal range of 1.6 m between 104.0 m a.s.l. in 1865 and 105.6 m in 1879, implying that the water balance of the lake was not fundamentally influenced since the drainage capacity of the canal was only 10 m3s−1(Meissner, 1867). During subsequent
5
enlargements of the canal and changes in control strategy, the decadal fluctuations were reduced to 0.6 m (104.6 m a.s.l. in 2003 and 105.2 in 2010) while the mean water level was stabilized around 105 m.
4.2 Changes in wetland area
Meanwhile, the area of wetlands on the watershed also showed transition and
sta-10
bilization (Fig. 4). During the late 18th century, the extent of permanent wetlands (ex-cluding open water and periodically flooded areas) on the Lake Balaton watershed was 361 km2. In this initial stage, three major wetlands existed on the area, North, South and West of the Lake, and the tributary valleys held several smaller swamps. By the early 19th century, large parts of all three major wetlands had been lost, with the
to-15
tal area reduced to 217 km2. Major wetlands lost especially their upstream reaches. During the next decades, some areas were lost, but others regained, especially in the Northern and Western valleys (though in this latter case at the expense of open water). The sum of 186 km2shows minor losses compared to the previous period.
Finally, at the turn of the 20th and 21st century, the area of the wetlands was 130 km2.
20
Most of this final major loss resulted from the drainage of large parts of the Southern wetland area and the flooding of parts of the Western wetland system, while some minor swamps were converted to fishponds. Some gains were also made: drainage was abandoned in most reed areas West of the lake.
At the first glance, this time series shows close connections with the changes in the
25
HESSD
10, 7733–7781, 2013Historic maps as a data source for
socio-hydrology
A. Zlinszky and G. Tim ´ar
Title Page
Abstract Introduction
Conclusions References
Tables Figures
◭ ◮
◭ ◮
Back Close
Full Screen / Esc
Printer-friendly Version Interactive Discussion
Discussion
P
a
per
|
Dis
cussion
P
a
per
|
Discussion
P
a
per
|
Discussio
n
P
a
per
|
attempt to regulate Lake Balaton. The causes of these losses are disputed: climatic ef-fects may have played a role, but the most important factor was probably the deliberate drainage of the wetlands themselves to clear land for agriculture. Comparing the wet-land maps before and after the lake water level was lowered (Second and Third Military Survey), it is again clear that most of the wetland loss is not in the areas immediately
5
adjacent to the lake. Some small patches were probably lost to the lessening demand for water-mills and therefore the demolition of mill-dams.
After 1870, during the intensification of agriculture and tourism, the Balaton region underwent a series of transitions. These included the canalization of some tributary streams with the intention of wetland drainage, especially on the Northern and
South-10
ern side. In the upstream part of the Western (Kis-Balaton) wetland basin, the opposite process started with wetland reconstruction. With a system of dykes on the Zala river, a shallow pond of 18 km2 was created, in the hope that this will be encroached by wetland vegetation.
5 Discussion
15
5.1 Implications of wetland and water level changes on Lake Balaton
The earliest confirmed water level of the lake, from the year 1776, was published by Zlinszky (2010). This is only 2 m above the current water level, and 3 m lower than indicated by previous authors (Bendefy and Nagy, 1969). Inconsistencies of map inter-pretation and fluctuations in water level may explain the previously established results
20
(Vir ´ag, 1998), while contrary to these, the water level of the Krieger map is confirmed to represent an annual mean level (Vir ´ag, 2005).
Neither a comprehensive study of all wetlands on the watershed, nor spatially explicit time series investigations were undertaken on the whole Balaton watershed before this study. The ecological effect of the outlet canal was a continuous source of dispute ever
25
HESSD
10, 7733–7781, 2013Historic maps as a data source for
socio-hydrology
A. Zlinszky and G. Tim ´ar
Title Page
Abstract Introduction
Conclusions References
Tables Figures
◭ ◮
◭ ◮
Back Close
Full Screen / Esc
Printer-friendly Version Interactive Discussion
Discussion
P
a
per
|
Dis
cussion
P
a
per
|
Discussion
P
a
per
|
Discussio
n
P
a
per
|
wetland loss. Our study proved that tributary valley wetlands upstream of Lake Balaton are not directly dependent on the hydrological regime of the lake: most valleys have a well defined slope (Zlinszky, 2010). The aquatic vegetation had a water retention effect until the onset of artificial drainage. The combined water surface extent of the lake and wetland system could have been close to equilibrium of evaporation and inflow,
5
without their water surfaces being at the same elevation. Nearly half of the wetland area on the watershed was lost before the demolition of the mill dam on the outlet of the Lake (1848) which was the first engineering attempt to lower the water level. Some loss clearly happened parallel to the opening of the outlet canal, but this was already after the transition of the wetlands from their “original, natural” extents. In the light of
10
the results, the previously accepted theory of wetland loss due to lake water level drop is improbable.
5.2 Historic maps as a data source for socio-hydrological studies
Historic datasets are a reliable source of information, but the past is not always a good guide to the future. We can not necessarily assume that change in the future will
hap-15
pen in the same way as it has in the past. We can seek evidence from periods in the past which can be used as analogues for future conditions and build scenarios which can be evaluated together with their probability. This is where palaeohydrology and his-toric socio-hydrology have a role (Sear and Arnell, 2006). According to James (1999),
“historical methods should not replace quantitative scientific analyses but should be
20
combined with them in a multi methodological approach to characterize fluvial sys-tems”.
5.2.1 Timespan
One of the most important aspects of historic maps as a data source is the range of time they cover. Most such studies deal with 1–2 centuries, based on surveys with
25
HESSD
10, 7733–7781, 2013Historic maps as a data source for
socio-hydrology
A. Zlinszky and G. Tim ´ar
Title Page
Abstract Introduction
Conclusions References
Tables Figures
◭ ◮
◭ ◮
Back Close
Full Screen / Esc
Printer-friendly Version Interactive Discussion
Discussion
P
a
per
|
Dis
cussion
P
a
per
|
Discussion
P
a
per
|
Discussio
n
P
a
per
|
et al., 2010; Comiti et al., 2011; Bravard, 2010). In some countries where older carto-graphic records are also well preserved, it is possible to span 500 or even 800 yr, with spatial accuracies sufficient for quantitative analysis (Longhitano and Colella, 2007; Bondesan and Furlanetto, 2012; Tim ´ar et al., 2008b; Sz ´ekely, 2009; Armas et al., 2013; Kov ´acs, 2010). This means that it is common for map-based historic hydrology studies
5
to reach back in time to the Little Ice Age, which ended around 1850 AD in Central Eu-rope (Brown, 2003). The aim of long-term investigations is often to map the “original, undisturbed” state of a water body; in many cases this is impossible because human influence started before mapping. However, we have to state again that historic maps allow investigation of hydrological situations long before their time of surveying, if
cor-10
rectly interpreted (Tim ´ar and G ´abris, 2008; Zamolyi et al., 2010; Aston, 1985; Large, 1996; Pisut, 2002). In extreme cases, several cycles of channel evolution or multiple stages of human intervention can be observed from long-term series (Longhitano and Colella, 2007; Braga and Gervasoni, 1989). Even in sites where the available map series only spans a few decades, valid conclusions can be derived, especially about
15
anthropogenic processes (Mossa and McLean, 1997).
5.2.2 Spatial accuracy and level of content detail
One of the main reasons palaeohydrological data are rarely used in management con-texts is their “uncertainty”. This can be understood in terms of spatial position, timing of the situation represented in the survey, or correctness of the map content and its
in-20
terpretation. Positional accuracy depends first and foremost on the accuracy and scale of the modern map used as “ground truth” for georeferencing. The scale of the his-toric original is also important, together with the random positional errors introduced by the mapping method. Typical accuracies are around 200 m for 18–19th century maps with scales around 1 : 25 000 (Podobnikar, 2009; Zimova et al., 2006; D ¨om ¨ot ¨orfy et al.,
25
HESSD
10, 7733–7781, 2013Historic maps as a data source for
socio-hydrology
A. Zlinszky and G. Tim ´ar
Title Page
Abstract Introduction
Conclusions References
Tables Figures
◭ ◮
◭ ◮
Back Close
Full Screen / Esc
Printer-friendly Version Interactive Discussion
Discussion
P
a
per
|
Dis
cussion
P
a
per
|
Discussion
P
a
per
|
Discussio
n
P
a
per
|
(Tim ´ar et al., 2006; Moln ´ar and Tim ´ar, 2009; Tim ´ar and Mugnier, 2010), while the lo-cal features (e.g. creek/river bends, gullies, shoreline details) have much better lolo-cal accuracy (Feier and R ˘adoane, 2007; Tim ´ar, 2009). After WWI, the horizontal accuracy of most topographic maps was increased a lot: the absolute horizontal control is better than 10 m (Tim ´ar et al., 2004). Scale of the map itself limits the possible horizontal
5
resolution; a rule of thumb is that a half a millimetre on the original paper map is the physical limit of the horizontal control.
The timing of the situation depicted on a historic map is often quite certain, since the publication date of most maps is well established. However, this can be misleading: the surveys leading to a map may have taken place during a longer time, or the map
10
can contain details copied from other maps. In most cases, historic datasets can be chronologically constrained within a few years even if not or incorrectly dated.
Finally, accuracy of the content interpreted depends on the map legend, the original level of surveying detail, and the quality in which the map was preserved. Most time series investigations define uniform categories for all studied maps (Ziliani and Surian,
15
2012), while others assign less categories to older maps (Comiti et al., 2011). The most rigorous method is to perform comparative analysis of map content with respect to other maps or data obtained by palaeohydrological methods, and categorize the map sources according to expected reliability (Bondesan and Furlanetto, 2012).
5.2.3 The advantages of historic maps
20
One of the advantages of historic maps over other palaeohydrological datasets is that the uncertainties of spatial, temporal and contextual correctness can be well quantified. Using ground control points, the georeferencing error can be assessed; based on map content, cartographic depiction and historic information, uncertainties in the time of the survey can be constrained, and based on the map legend and mapping process, at
25
least some of the map content can usually be verified.
HESSD
10, 7733–7781, 2013Historic maps as a data source for
socio-hydrology
A. Zlinszky and G. Tim ´ar
Title Page
Abstract Introduction
Conclusions References
Tables Figures
◭ ◮
◭ ◮
Back Close
Full Screen / Esc
Printer-friendly Version Interactive Discussion
Discussion
P
a
per
|
Dis
cussion
P
a
per
|
Discussion
P
a
per
|
Discussio
n
P
a
per
|
records can be pinpointed in time and space, they do not cover large areas; similarly historic text documents might give detailed descriptions of a landscape but are spatially inaccurate; historic maps typically cover large areas, represent snapshots of a given time, but their content is already a product of the cartographer’s interpretation.
Palaeohydrological investigations based on dedicated proxy data can be costly (Sear
5
and Arnell, 2006), while access to map archives is usually free of charge. With the commercialization of GIS technology, processing can also be very cost effective.
5.2.4 Future prospects
Specifically for socio-hydrology, two different research directions have been estab-lished: one is deriving hydrological information from the map and data on human history
10
from other sources. The other is the opposite, with human influence read from old maps and hydrological processes represented with different proxies. The future is probably a combination of these, where spatial coverage of hydrological, ecological and human history data is obtained together from historic maps but verified by reference data from other methods.
15
Studies of locations where historic maps are abundant have shown that georeferenc-ing and interpretgeoreferenc-ing cartographic data creates a positive feedback on itself: as more georeferenced historic maps are available, it becomes easier to process and under-stand additional old maps of the region. The transfer of methodological knowledge to areas where fewer maps are available is also underway. In the near future, this could
20
result in seamless coverage of large areas.
An Achilles‘ heel of local palaeohydrology is that it is difficult to distinguish between natural variability and human influences, according to Gregory and Benito (2003b), since both act at the same place and time. This could at least partially be resolved by comparative analysis of a large number of relatively similar hydro-systems across
25
HESSD
10, 7733–7781, 2013Historic maps as a data source for
socio-hydrology
A. Zlinszky and G. Tim ´ar
Title Page
Abstract Introduction
Conclusions References
Tables Figures
◭ ◮
◭ ◮
Back Close
Full Screen / Esc
Printer-friendly Version Interactive Discussion
Discussion
P
a
per
|
Dis
cussion
P
a
per
|
Discussion
P
a
per
|
Discussio
n
P
a
per
|
6 Conclusions
Socio-hydrology deals with complex feedbacks between water, ecosystems and Man, and relies on comparative case study analysis and historical investigations. Historic maps have been supporting these studies, especially since digital technology allowed accurate georeferencing and GIS integration. Comparison with external data can
pro-5
vide validation or information on causality.
In a case study, it has been shown that the coverage and accuracy of such datasets is sufficient to investigate water level and wetland changes on Lake Balaton in a historic socio-hydrology context. Historic water levels were proven to have been closer to the current situation than previously assumed, and the independence of major wetland loss
10
from changes in water regime of the lake downstream of them has been confirmed.
Appendix A
Using historic maps for hydrology
To our best knowledge, the latest guide to using historic maps for hydrology is Hooke and Redmond (1989), published before the era of digital map processing. In the
fol-15
lowing, we provide a short step-by-step manual for hydrologists with knowledge of GIS and intending to apply historic maps for socio-hydrology.
A1 Where to start
Once a studied site and time period is identified, familiarize yourself with the written history of the area. What were the major political systems and the important events
20
HESSD
10, 7733–7781, 2013Historic maps as a data source for
socio-hydrology
A. Zlinszky and G. Tim ´ar
Title Page
Abstract Introduction
Conclusions References
Tables Figures
◭ ◮
◭ ◮
Back Close
Full Screen / Esc
Printer-friendly Version Interactive Discussion
Discussion
P
a
per
|
Dis
cussion
P
a
per
|
Discussion
P
a
per
|
Discussio
n
P
a
per
|
works all needed their own surveys, and in most cases, these maps survive and are available in archives.
Spatial accuracy is a function of the technology used during the survey and drawing, together with the existence and adjustment of the geodetic network. How relevant the content and legend of historic maps might be for socio-hydrological studies will depend
5
mainly on their original purpose. Hydrographic maps are probably the best for hydro-logical studies: they typically have large scale (in the cartographic sense) and fine de-tail, but might focus only on a single water body and thus have limited spatial coverage. They often ignore features considered irrelevant for hydrology such as land cover types or sometimes even human settlement. Any major hydro-engineering project (wetland
10
drainage, levee building, canalization etc.) would require a baseline map of the original, un-engineered status of the site, which can provide invaluable sources of information on the natural situation before major human intervention. Since most such construc-tions were linked to the industrial revolution, the first hydrographic maps are typically from the 18−19th century.
15
Military topographic maps are also highly valuable in most cases. Their relatively high scale is combined with the aim of full topographic representation to show all terrain details that are important for the military operations of their age. Prior to the end of the 19th century, such maps mostly serve the infantry, which means that waterways were accurately depicted as obstacles, ship transportation (crucial for supplies) and sources
20
of water. Later, maps were mainly used for artillery purposes, which increased the need for accurate coordinate representation and also the depiction of relief (Jank ´o, 2007). The earliest such maps date to the expansion of military cartography in the mid-18th century.
General country maps typically have smaller scale and thus less detail, they deliver
25