Chromosomes
Maria Costantini*, Giorgio Bernardi*
Stazione Zoologica Anton Dohrn, Naples, Italy
Abstract
Background:The very recent availability of fully sequenced individual human genomes is a major revolution in biology which is certainly going to provide new insights into genetic diseases and genomic rearrangements.
Results:We mapped the insertions, deletions and SNPs (single nucleotide polymorphisms) that are present in Craig Venter’s genome, more precisely on chromosomes 17 to 22, and compared them with the human reference genome hg17. Our results show that insertions and deletions are almost absent in L1 and generally scarce in L2 isochore families (GC-poor L1+L2 isochores represent slightly over half of the human genome), whereas they increase in GC-rich isochores, largely paralleling the densities of genes, retroviral integrations andAlusequences. The distributions of insertions/deletions are in striking contrast with those of SNPs which exhibit almost the same density across all isochore families with, however, a trend for lower concentrations in gene-rich regions.
Conclusions:Our study strongly suggests that the distribution of insertions/deletions is due to the structure of chromatin which is mostly open in gene-rich, GC-rich isochores, and largely closed in gene-poor, GC-poor isochores. The different distributions of insertions/deletions and SNPs are clearly related to the two different responsible mechanisms, namely recombination and point mutations.
Citation: Costantini M, Bernardi G (2009) Mapping Insertions, Deletions and SNPs on Venter’s Chromosomes. PLoS ONE 4(6): e5972. doi:10.1371/ journal.pone.0005972
Editor:Mark A. Batzer, Louisiana State University, United States of America
ReceivedMarch 31, 2009;AcceptedMay 19, 2009;PublishedJune 22, 2009
Copyright:ß2009 Costantini, Bernardi. This is an open-access article distributed under the terms of the Creative Commons Attribution License, which permits unrestricted use, distribution, and reproduction in any medium, provided the original author and source are credited.
Funding:The funding that has supported the work came from the author’s Institute. The funders had no role in study design, data collection and analysis, decision to publish, or preparation of the manuscript.
Competing Interests:The authors have declared that no competing interests exist.
* E-mail: [email protected] (MC); [email protected] (GB)
Introduction
The very recent availability of fully sequenced individual human genomes [1–5] is a major revolution in biology which is certainly going to provide new insights into genetic diseases and genomic rearrangements in the near future. In the present work, we looked at the insertions, deletions and SNPs that are present in Craig Venter’s genome [1], more precisely on chromosomes 17 to 22 (334 megabases, about 10% of the human genome), and compared them with the human reference genome hg17 from UCSC website.
The three main reasons for carrying out this investigation were the following: (i) to localize insertions, deletions and SNPs on chromosomes 17 to 22, in connection with the compartmental-ization of the human genome into isochores [6,7]; this was done at two levels, namely localization in isochore families (L1, L2, H1, H2, H3, in order of increasing GC and gene density) and mapping within the isochores; (ii) to correlate insertions, deletions and SNPs with the densities of genes, interspersed repeats and retroviral insertions, since these densities are correlated, in turn, with isochore GC levels [8–12,6], and since they may provide indications for the preference of insertions/deletions for different isochore families; (iii) to prepare the ground for exploring the expression of genes located in the neighborhood of deletions and insertions; indeed it has been postulated [7] that compositional changes due to the accumulation of AT-biased point mutations or
to deletions/insertions may be associated with alterations of chromatin structure that, in turn, may affect gene expression.
the time of our investigations, because the human reference genome, as already mentioned, is a composite genome. Obviously, a comparison of full individual genomes will be of interest as soon as this will be possible.
Results
The choice of chromosomes 17 to 22 was due to the fact that while these chromosomes exhibit wide differences in their isochore patterns, they cumulatively show an overall similarity with the
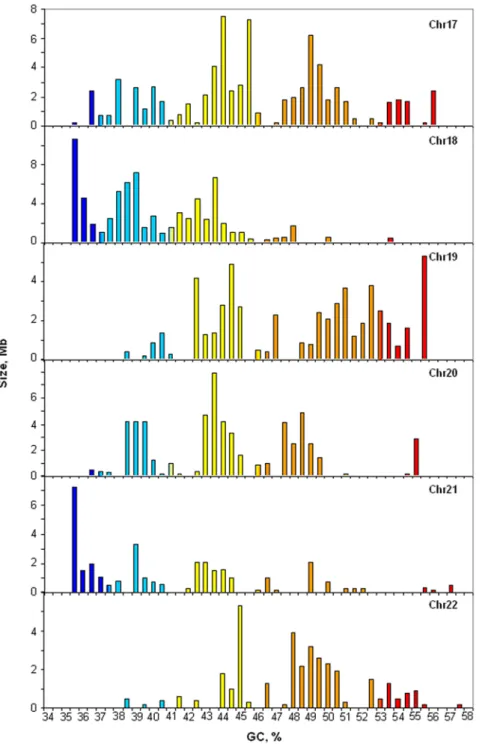
isochore patterns of the whole human genome [15]. Indeed, as shown in Figure 1, chromosomes 17 and 20 are characterized by a predominance of H1 and H2 isochores, whereas L1 isochores are poorly represented. In contrast, chromosomes 18 and 21 are characterized by abundant L1 isochores (as well as L2 isochores in the case of chromosome 18, which lacks H3 isochores altogether). Chromosomes 19 and 22 completely lack isochore family L1, are very scarce in L2 isochores, and show a great abundance of H1 and, especially, of H2 isochores. It should be noted that while Figure 1 reports the isochore patterns of chromosomes from
Figure 1. Distribution of isochores on chromosomes 17 to 22 from the human reference genome.The histograms show the distribution (by weight) of isochores as pooled in bins of 0.5% GC for chromosomes 17 to 22 from hg17. Colors represent the five isochore families. The color code spans the spectrum of GC level in five steps, indicated by broken horizontal lines: ultramarine blue (L1), light blue (L2), yellow (H1), orange (H2) and red (H3). Note the different scales on the ordinate axis.
release hg17, the isochore profiles of hg17 and hg18, the most recent release, are identical as far as chromosomes 17 to 22 are concerned, the only exceptions being three small gaps in hg17 of chromosome 22 which were filled in the hg18 version (see Figure S1).
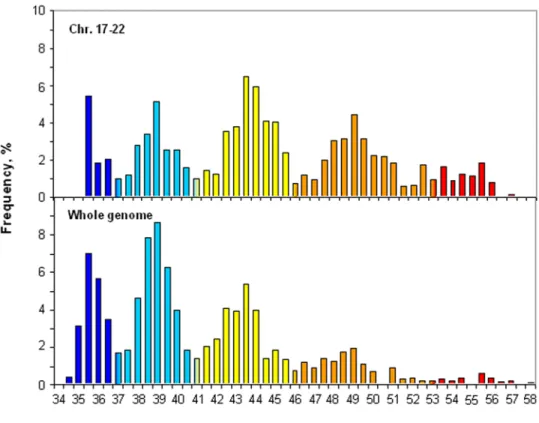
Figure 2 compares the cumulative isochore pattern of chromosomes 17 to 22 with that of the whole human genome. The former one is characterized by an under-representation of GC-poor isochore families L1 and L2 and by an over-representation of GC-rich isochore families H1, H2 and H3. Chromosomes 17 to 22 still provide, however, a fair representation of the isochore pattern of the whole human genome, which is satisfactory for the purpose of this investigation. In addition, these differences are take care of the fact that our data on insertions/ deletions are presented as densities.
The locations of insertions and deletions, respectively, in the isochore families of Venter’s chromosomes 17 to 22 are summarized in Figure 3 A,B. The correlation between the number of indels and proportion of sequence in isochors were determined using the Pearson correlation coefficient: very significant values (P,0.0001) were found. Densities of insertions and deletions in the three size ranges explored were extremely low in L1 isochores. While this is hardly surprising for chromosomes 19 and 22, which comprise few or no L1 isochores, this is also true for chromosomes 18 and 21, which are rich in L1 isochores. The density of insertions/deletions increased with increasing GC of isochore families, essentially paralleling the densities of genes and Alu sequences, except for the lower values of the longest (.1000 bp, base pairs) insertions/deletions in H3 isochores. In addition, in the
latter case deletions and insertions showed a parallel behaviour, whereas insertions in Venter’s chromosomes were more abundant than deletions in H1 to H3 families for the 10–100 and 100– 1000 bp classes. The points made above expectedly appear more clearly on the cumulative plots of Figure 4.
It should be pointed out that (i) if the Venter genome contains two contiguous Alu elements (,600 bp), while the human reference genome contains one Alu element (,300 bp) at the orthologous locus, this locus will be assessed as a Venter genome insertion; and (ii) Alu-Alu recombination-mediated deletions (ARMDs) have been shown to occur frequently throughout primate evolution [16,17]. Therefore, if this locus was created by an ARMD event in the human reference genome, one should discard this locus in the Venter insertion category. While this is correct in our case, ARMD’s could only represent 50 human specific deletions (10% of the 492 found by Sen et al., 2006, for the whole genome since Venter’s chromosomes 17 to 22 that represent 10% of the human genome). This is, however, a negligible number compared to the 3468 insertions in Venter found by us and would therefore not change our conclusions.
The results in terms of numbers of insertions/deletions located in different isochore families are reported in Table S1, which also presents the corresponding amounts of DNA. The data show (i) that the predominant weight contribution (.90%) expectedly is that of the largest insertions/deletions; (ii) that the total amounts of both insertions and deletions represent 0.6–2.7% of chromosome sizes, except for the much larger levels in the case of chromosome 19 (3.9% and 12.1%, respectively, for insertions and deletions in Venter); and (iii) that, in general, the patterns of deletions and
Figure 2. Comparison of the cumulative isochore distribution on chromosomes 17 to 22 and on the whole human genome.The isochore distribution of the whole human genome is from ref. 15. In order to compare the two histograms, isochore frequencies were calculated as percentages of the total. The color code spans the spectrum of GC level in five steps, indicated by broken horizontal lines: ultramarine blue (L1), light blue (L2), yellow (H1), orange (H2) and red (H3).
insertions tend to parallel each other, with the exception of the very abundant deletions in Venter’s chromosome 19.
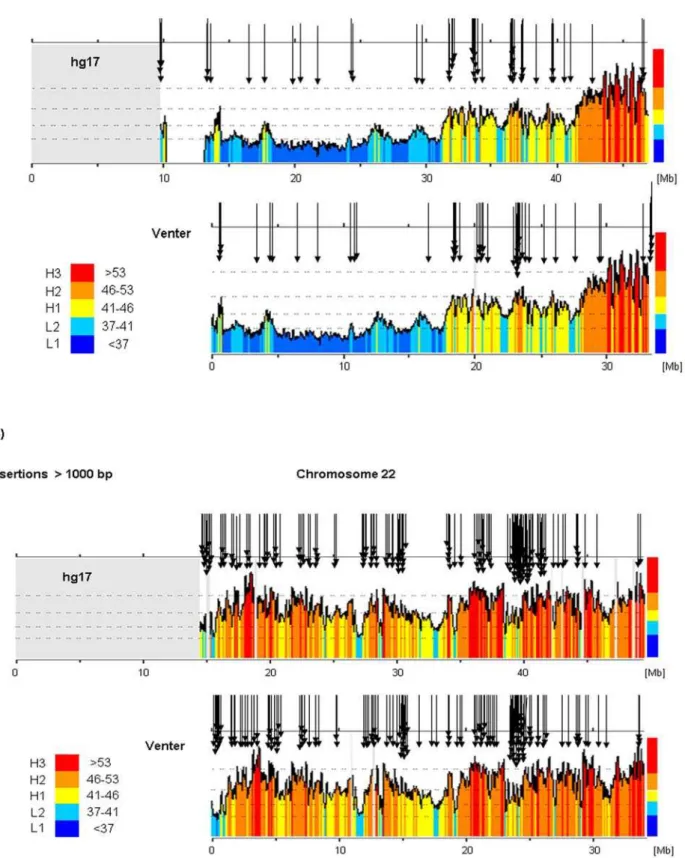
The localizations of insertions/deletions larger than 1000 bp in chromosomes 21 and 22 are showed in Figure 5. Two features are outstanding (i) the practical absence of insertions and deletions in sub-telomeric regions (e.g. positions 40 to 47 megabases on chromosome 21 of hg17), in spite of the fact that these regions are very GC-rich; and (ii) the highest concentrations of insertions/ deletions in regions about position 37 megabase in chromosome 21 of hg17, and about position 39 megabase in chromosome 22 of hg17. These regions do not show any noticeable difference, in the present state of knowledge, when compared with compositionally similar regions located elsewhere on the chromosomes. The localizations of insertions/deletions of 10–100 bp and 100– 1000 bp on chromosomes 21 and 22 are reported in Figures S2 and S3.
The parallelism between the densities of insertions and Alu sequences prompted a search forAlusequences in the insertions of the reference human chromosomes that correspond to deletions in Venter’s chromosomes. The results, presented in Table 1, indicate that all or mostAlusequences were present at the ends of 10–100 and 100–1000 bp insertions, respectively, whereas only about 30% of the.1000 bp insertions hadAlusequences at their ends, the majority ofAlus being located in internal positions.
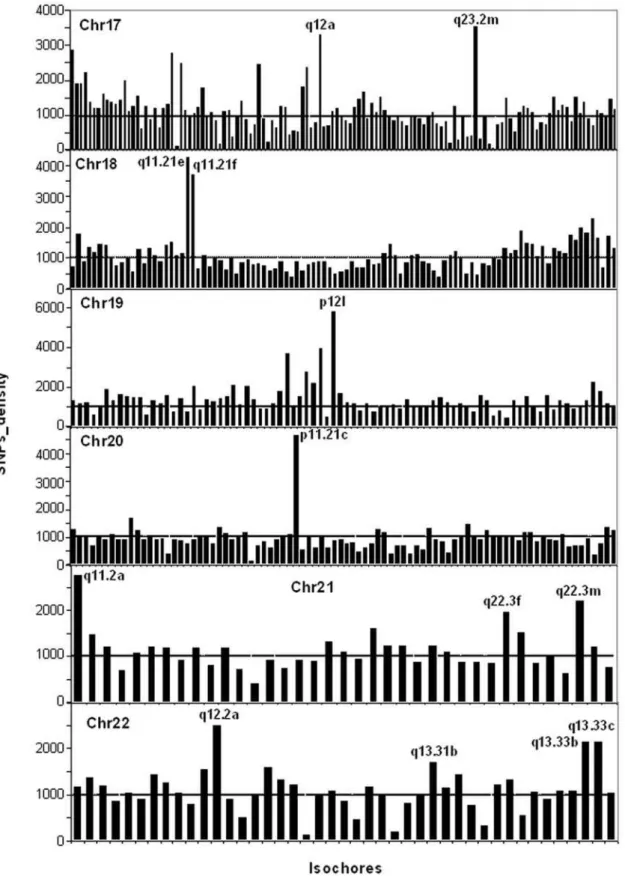
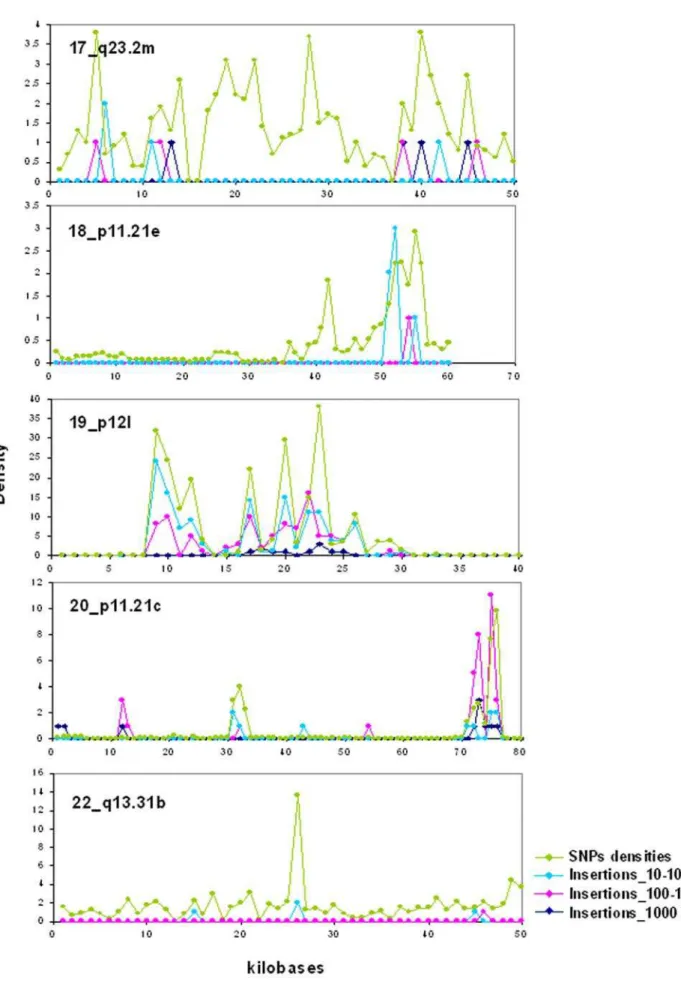
In sharp contrast with insertions/deletions, the densities of SNPs were largely uniform over all isochore families (Figure 6; see also Table S2; Figure S4 presents the numbers of SNPs on chromosomes). Even if the vast majority of isochores showed relatively constant concentrations of SNPs, which did not vary with the different GC levels of isochores, a small number of them showed very high or very low concentrations (see Figure 6). When these isochores were analyzed individually (see Table S3), the high SNPs concentrations were found to be either distributed over most of the isochore length (as is the case for isochores having the average SNPs concentration) or present in limited regions (see Figure 7, in which five isochores are reported; for the other isochores see Figure S5). Insertions, being much less numerous than SNPs, were expectedly less widespread in their distribution and tended to coincide with SNPs spikes.
Finally, a trend to avoid gene dense regions was evident when comparing gene density and SNPs density (Figure 8). P values ,0.0001 were found for the correlation between gene density and SNPs density.
Discussion
in GC-rich isochores, especially in the H2 and H3 families, which only represent together 15% of the human genome.
The increase in insertions and deletions in the H1-H3 isochore families, parallels the increase in the concentration of both Alu sequences and genes (see Introduction), as well as in the degree of ‘‘openness’’ of chromatin [18–20] and in the frequency of recombination [21–25]. The question should therefore be asked which one(s) of these factors is (are) the most biologically significant as an explanation for the distribution of insertions/deletions.
The correlation between the densities of insertions/deletions and Alusequences is indicated in the most evident way by the terminal distribution ofAlusequences in insertions in the reference human genome (see Table 1). While such terminal distribution is perfect for the 10–100 bp insertions and still predominant for the 100–1000 bp class, this is not, however, the case for the largest insertions, whereAlusequences are in terminal positions of only about 30% insertions. The distribution of insertions/deletions in GC-rich isochores is, however, not simply due to their richness in repeated sequences such asAlusequences. Indeed, if this were the case, one would expect to have high levels of insertions/deletions
also in GC-poor isochores, which are very rich in the other major family of interspersed repeats, the LINE-1 (long interspersed element-1) family, whereas this is not the case.
An overall positive correlation also exists between insertions/ deletions and gene density but the longest insertions/deletions decrease in the most gene-dense isochores of the H3 family, as if this process were not allowed because of its deleterious impact on genes; and (ii) the insertions/deletions of the other size classes are scarce in telomeric regions, which are very gene-rich, as compared with similarly GC-rich, but less gene-rich isochores located elsewhere on chromosomes. At this point, one should conclude that the correlation between insertions/deletions and gene density is only a consequence of the correlation between gene density and GC level [6].
Having ruled out gene concentration as a factor favoring insertions/deletions (in fact, the opposite being true), and considering thatAlusequences are simply used in the recombina-tion process (LINE-1 not favoring inserrecombina-tions/delerecombina-tions in GC-poor isochores), the possibility remains that the real reason for the distribution of insertions/deletions reported here is the different Figure 4. Density of insertions and deletions in isochore families from chromosomes 17 to 22.The densities of insertions/deletions in chromosomes 17 to 22 are reported for the five isochore families. For the sake of comparison, Alu and gene densities (divided by 100 and by 4, respectively) in hg17 are also reported.
Figure 5. The largest insertions/deletions in chromosomes 21 and 22.Localizations of insertions and deletions larger than 1000 bp in chromosomes (A) 21 and (B) 22, are represented by the black arrows. The large gray blocks present in the hg17 diagrams are due to calculating the GC level using the program draw_chromosome_gc.pl (http://genomat.img.cas.cz; [49,50]) that inserts grey lines or blocks where there are gaps. The telomere regions were presented as gaps in hg17 but eliminated in the Venter genome.
chromatin structure of GC-poor vs GC-rich isochores [18–20]. This possibility is strongly supported by previous work on retroviral integration.
Indeed, Bovine Leukemia Virus (BLV; [26]), Human Hepatitis B (HBV a DNA virus with some retroviral features; [27]), Rous Sarcoma Virus (RSV; [28]), Human T-cell Leukemia Virus [29]), Murine Leukemia Virus (MuLV; [30]) were all shown to integrate in GC-rich isochores (see [6] for a review). One might, however, argue that, since all the retroviral sequences mentioned so far are GC-rich [31], integration into GC-rich isochores could depend upon the requirement for a compositional match between the retroviral sequence and the isochores of the host genome without being related to chromatin ‘‘openness’’. Integration into GC-rich isochores was also found, however, for exogenous Mouse Mammary Tumor Virus (MMTV; [32]) and Human Immunode-ficiency Virus (HIV-I; [6,33–36]) which are GC-poor. This obviously favors the idea of an integration into open chromatin structures. Moreover, using different approaches, several authors [37–42] found high frequencies of RSV, Avian Leukosis Virus (ALV), and MuLV near DNase-hypersensitive sites, transcription-ally active regions and CpG islands. These results are in agreement with our conclusion since GC-rich isochores correspond to open chromatin regions [23] and since DNase-hypersensitive sites are concentrated in GC-rich isochores [24,25] which are rich in genes and in CpG islands and are transcriptionally active. In conclusion, the results available indicate that the initial integration of retroviral sequences takes place in open chromatin regions (such as those corresponding to GC-rich isochores), whereas stability of integra-tion and transcripintegra-tion requires a matching composiintegra-tion of retroviral and host sequences [6,18]. Another result in favor of the open chromatin interpretation is that ‘‘new’’ Alu sequences integrate essentially at random in the genome, but this happens in the paternal germ line [43–45], where open chromatin is much more widespread over chromosomes.
At this point one should recall that the pattern of insertions/ deletions follows the general pattern of chromosomal rearrange-ments [18] and recombination [20–22]. This might be an alternative possible explanation for the pattern of insertions/ deletions. It seems, however, much more plausible that the pattern of recombination itself is dependent upon the distribution of open chromatin regions over the genome. Indeed, DNA duplications also occur more frequently in GC-rich compared to GC-poor isochores [44] and chromosomal fission takes place frequently within regions elevated in GC [46]. As already mentioned, in several cases the localizations of insertions/deletions in chromo-somes indicate some specific preferences, such as those shown in Figure 5 and Table S1, which correspond to hot spots of recombination.
These observations are important because structural genome variations, such as insertions/deletions, may be involved in genetic diseases. We have already suggested that this may occur not so much through a direct impact on genes, but rather through local changes in chromatin structure that affect gene expression at a distance [7]. This explanation is supported by the fact that non-coding sequences are so overwhelmingly abundant compared to coding sequences in the human genome (98–99% vs 1–2%; [6]).
In sharp contrast with insertions/deletions, SNPs are rather uniformly distributed over all isochore families. The distribution of SNP is understandable because the main cause of SNPs are point mutations due to errors during DNA replication, which are apparently not very sensitive to the compositional context. Still, even if this applies to the vast majority of isochores, a small number of them showed very high or very low concentrations. Needless to say, the latter isochores deserve further investigation, also because of the coincidence of recombination hot spots and high SNP densities as shown by Figure 7 and Figure S6.
Methods
Venter’s chromosomes were downloaded from GenBank (http://www.ncbi.nlm.nih.gov/GenBank; accession number ABBA01000000; [1] and were aligned with the human reference genome hg17 [47,48] on the UCSC website http://genome.ucsc. edu). This release, used for the mapping of isochores by Costantini et al. [15] was compared with the most recent release hg18, and found to be identical as far as chromosomes 17 to 21 are concerned, whereas chromosome 22 showed three small gaps, which were filled in the hg18 version. A script implemented by us was used to align the sequences and to extract the insertions/deletions in Venter’s chromosomes, considering three size classes (10–100, 100–1000,.1000 bp), as well as the single nucleotide polymorphisms (SNPs). Insertions/deletions of single nucleotides in Venter’s genome were also estimated and represented less than 5% of SNPs. Alu sequences coordinates for human genome reference were downloaded from UCSC website.
The correlations between the number of indels and proportion of sequence in isochores and between gene density and SNPs density were determined using the Pearson correlation coefficient by the statistical program Prism 4 (GraphPad Software San Diego, CA, USA). A value of P,0.05 was considered to be statistically significant.
Supporting Information
Figure S1
Found at: doi:10.1371/journal.pone.0005972.s001 (0.02 MB PDF)
Figure S2
Found at: doi:10.1371/journal.pone.0005972.s002 (0.05 MB PDF)
Figure S3
Found at: doi:10.1371/journal.pone.0005972.s003 (0.07 MB PDF)
Figure S4
Found at: doi:10.1371/journal.pone.0005972.s004 (0.04 MB PDF)
Figure S5
Found at: doi:10.1371/journal.pone.0005972.s005 (0.08 MB PDF)
Table 1.The number and locations of Alu sequences are
reported for three classes of insertions (10–100 bp, 100– 1000 bp and.1000 bp) in the human reference genome(a).
Number Locations of Alu sequences
Ends Internal
10–100 bp 299 298 1
100–1000 bp 1734 1629 105
.1000 bp 888 246 642
Figure 6. SNPs densities in isochores of chromosomes 17–22.Each bar corresponds to an isochore. The names of isochores with high densities of SNPs are reported. For the coordinates and the nomenclature of the other isochores see Supplementary Table S1 of ref. 15. The horizontal broken line at a density of 1000 corresponds to the average density of SNPs per megabase (see also Table S2). Supplementary Figure S6 presents the numbers of SNPs on the same chromosomes.
Figure 7. Insertions and SNPs in individual isochores of chromosomes.Numbers of insertions (in the three size classes 10–100 bp, 100– 1000 bp,.1000 bp indicated by light blue, pink and dark blue, respectively) and densities of SNPs are reported for some of the isochores that show high densities of SNPs (see also legend of Figure 6).
Table S1
Found at: doi:10.1371/journal.pone.0005972.s006 (0.03 MB XLS)
Table S2
Found at: doi:10.1371/journal.pone.0005972.s007 (0.02 MB XLS)
Table S3
Found at: doi:10.1371/journal.pone.0005972.s008 (0.02 MB XLS)
Acknowledgments
We thank Fabio Auletta for bioinformatic support. We also thank Mark Batzer for communicating to us unpublished data on structural variations
Figure 8. SNPs and gene densitites.Each point corresponds to an isochore. SNPs density (pink line) is compared with gene density (blu line) for chromosomes 17–22. Arrows show some of the opposite trends of densities. For the coordinates and the nomenclature of isochores on x-axes see Supplementary Table S1 of ref. 15 (see also legend to Figure 6).
in Venter’s genome, and to an anonymous Referee for a specific comment
on Alu-Alu recombination-mediated deletions (ARMDs). Author Contributions
Conceived and designed the experiments: MC GB. Analyzed the data: MC. Wrote the paper: GB.
References
1. Levy S, Sutton G, Ng PC, Feuk L, Halpern AL, et al. (2007) The diploid genome sequence of an individual human. PloS Biology 5: e254.
2. Bentley DR, Balasubramanian S, Swerdlow HP, Smith GP, Milton J, et al. (2008) Accurate whole human genome sequencing using reversible terminator chemistry. Nature 456: 53–59.
3. Ley TJ, Mardis ER, Ding L, Fulton B, McLellan MD, et al. (2008) DNA sequencing of a cytogenetically normal acute myeloid leukaemia genome. Nature 456: 66–72.
4. Wang J, Wang W, Li R, Li Y, Tian G, et al. (2008) The diploid genome sequence of an Asian individual. Nature 456: 60–66.
5. Wheeler DA, Srinivasan M, Egholm M, Shen Y, Chen L, et al. (2008) The complete genome of an individual by massively parallel DNA sequencing. Nature 452: 872–877.
6. Bernardi G (2004, reprinted in 2005)Structural and Evolutionary Genomics. Natural Selection in Genome Evolution. Amsterdam, The Netherlands: Elsevier.
7. Bernardi G (2007) The neo-selectionist theory of genome evolution. Proc Natl Acad Sci USA 104: 8385–8390.
8. Meunier-Rotival M, Soriano P, Cuny G, Strauss F, Bernardi G (1982) Sequence organization and genomic distribution of the major family of interspersed repeats of mouse DNA. Proc Natl Acad Sci USA 79: 355–359.
9. Soriano P, Meunier-Rotival M, Bernardi G (1983) The distribution of interspersed repeats is non-uniform and conserved in the mouse and human genome. Proc Natl Acad Sci USA 80: 1816–1820.
10. Bernardi G, Olofsson B, Filipski J, Zerial M, Salinas J, et al. (1985) The mosaic genome of warm-blooded vertebrates. Science 228: 953–958.
11. Mouchiroud D, D’Onofrio G, Aı¨ssani B, Macaya G, Gautier C, Bernardi G (1991) The distribution of genes in the human genome. Gene 100: 181–187. 12. Zoubak S, Clay O, Bernardi G (1996) The gene distribution of the human
genome. Gene 174: 95–102.
13. Bailey JA, Eichler EE (2006) Primate segmental duplications: crucibles of evolution, diversity and desease. Nature 7: 552–564.
14. Korbel JO, Urban AE, Affourtit JP, Godwin B, Gribert F, et al. (2007) Paired-end mapping reveals extensive structural variation in the human genome. Science 318: 420–426.
15. Costantini M, Clay O, Auletta F, Bernardi G (2006) An isochore map of human chromosomes. Genome Res 16: 536–541.
16. Sen SK, Han K, Wang J, Lee J, Wang H, et al. (2006) Human genomic deletions mediated by recombination betweenAluelements. The American Journal of Human Genetics 79: 41–53.
17. Han K, Lee J, Meyer TJ, Wang J, Sen SK, et al. (2007) Alu Recombination-Mediated Structural Deletions in the chimpanzee genome. PLoS Genetics 3: e184.
18. Saccone S, Federico C, Bernardi G (2002) Localization of the gene-richest and the gene-poorest isochores in the interphase nuclei of mammals and birds. Gene 300: 169–78.
19. Di Filippo M, Bernardi G (2008) Mapping DNase-I hypersensitive sites on human isochores. Gene 419: 62–65.
20. Di Filippo M, Bernardi G (2009) The early apoptotic DNA fragmentation targets a small number of open chromatin regions. PLoS ONE 4: e5010. 21. Bernardi G (1989) The isochore organization of the human genome. Ann Rev
Genet 23: 637–661.
22. Holmquist GP (1992) Chromosome bands, their chromatin flavors, and their functional features. Am J Hum Genet 51: 17–37.
23. Fullerton SM, Carvalho AB, Clark AG (2001) Local rates of recombination are positively correlated with GC content in the human genome. Mol Biol Evol 18: 1139–1142.
24. Kong A, Gudbjartsson DF, Sainz J, Jonsdottir GM, Gudjonsson SA, et al. (2002) A high-resolution recombination map of the human genome. Nature Genet 31: 241–247.
25. Nachman MW (2002) Variation in recombination rate across the genome: evidene and implications. Curr Opin Genet Dev 12: 657–663.
26. Kettman R, Meunier-Rotival M, Cortadas J, Cuny G, Ghysdael J, Mammerickx M, Burny A, Bernardi G (1979) Integration of bovine leukemia virus DNA in the bovine genome. Proc Natl Acad Sci USA 76: 4822–4826.
27. Zerial M, Salinas J, Filipski J, Bernardi G (1986) Genomic localization of hepatitis B virus in a human hepatoma cell line. Nucleic Acid Res 14: 8373–8386.
28. Rynditch A, Kadi F, Geryk J, Zoubak S, Svoboda J, Bernardi G (1991) The isopycnic, compartmentalized integration of Rous sarcoma virus sequences. Gene 106: 165–172.
29. Zoubak S, Richardson J, Rynditch A, Ho¨llsberg P, Hafler D, Boeri E, Lever AML, Bernardi G (1994) Regional specificity of HTLV-I proviral integration in the human genome. Gene 143: 155–163.
30. Rynditch A, Zoubak S, Tsyba L, Tryapitsina-Guley N, Bernardi G (1998) The regional integration of retroviral sequences into the mosaic genomes of mammals. Gene 222: 1–16.
31. Zoubak S, Rynditch A, Bernardi G (1992) Compositional bimodality and evolution of retroviral genomes. Gene 119: 207–213.
32. Salinas J, Zerial M, Filipski J, Bernardi G (1986) Gene distribution and nucleotide sequence organization in the mouse genome. Eur J Biochem 160: 469–478.
33. Glukhova LA, Zoubak SV, Rynditch A, Miller GG, Titova IV (1999) Localization of HTLV-1 and HIV-1 proviral sequences in chromosomes of persistently infected cells. Chromosome Res 7: 177–183.
34. Elleder D, Pavliceck A, Paces J, Hejnar J (2002) Preferential integration of human immunodeficiency virus type 1 into genes, cytogenetic R bands and GC-rich DNA regions:insight from the human genome sequence. FEBS Lett 517: 285–286.
35. Tsyba L, Rynditch A, Boeri E, Jabbari K, Bernardi G (2004) Distribution of HIV-1 in the genomes of AIDS patients. Cell Mol Life Sci 61: 721–726. 36. Mok HP, Lever AML (2005) Location, location, location. Gene Therapy 12:
1–2.
37. Schubach W, Groudine M (1984) Alteration of c-myc chromatin structure by avian leucosis virus integration. Nature 307: 702–708.
38. Vijaya S, Steffen DL, Kozak C, Robinson HL (1986) Acceptor sites for retroviral integrations map near DNA I-hypersensitive sites in chromatin. J Virol 60: 683–692.
39. Rohdewhold H, Weinher H, Reik W, Jaenisch R, Breindl M (1987) Retrovirus integration and chromatin structure: Moloney murine leukemia proviral integration sites map near DNase I-hypersensitive sites. J Virol 61: 336–343. 40. Mooslehner K, Karl U, Harbers K (1990) Retroviral sites in transgenic Mov
mice frequently map in the vicinity of transcribed DNA region. J Virol 64: 3056–3058.
41. Scherdin V, Rhodes K, Brendl M (1990) Trancriptionally active genome regions and preferred targets for retrovirus integration. J Virol 64: 907–912. 42. Finchman VJ, Wyke JA (1991) Differences between cellular integration sites of
transcribed and non transcribed Rous sarcoma proviruses. J Virol 65: 461–463. 43. Jurka J (2004) Evolutionary impact of human Alu repetitive elements. Current
Opinion in Genetics and Development 14: 603–608.
44. Jurka J, Kohany O, Pavliceck A, Kapitonov VV, Jurka MV (2004) Duplication, coclustering and selection of human Alu retrotrasposons. Proc Natl Acad Sci USA 101: 1268–1272.
45. Jurka J, Kohany O, Pavliceck A, Kapitonov VV, Jurka MV (2005) Clustering, duplication and chromosomal distribution of mouse SINE retrotrasposons. Cytogenet. Genome Res 110: 117–123.
46. Webber C, Ponting C (2005) Hotspots of mutation and breakage in dog and human chromosomes. Genome Research 15: 1787–1797.
47. International Human Genome Sequencing Consortium (2004) Finishing the euchromatic sequence of the human genome. Nature 431: 931–945. 48. Kent WJ, Sugnet CW, Furey TS, Roskin KM, Pringle TH, et al. (2002) The
human genome browser at UCSC. Genome Res 12: 996–1006.
49. Pacˇes J, Zika R, Pavlicˇek A, Clay O, Bernardi G (2004) Representing GC variation along eukaryotic chromosomes. Gene 333: 135–141.