www.atmos-chem-phys.net/11/3495/2011/ doi:10.5194/acp-11-3495-2011
© Author(s) 2011. CC Attribution 3.0 License.
Chemistry
and Physics
The response of precipitation to aerosol through riming and melting
in deep convective clouds
Z. Cui1, S. Davies1, K. S. Carslaw1, and A. M. Blyth1,2
1Institute for Climate and Atmospheric Science, School of Earth and Environment, University of Leeds, UK 2National Centre for Atmospheric Science, UK
Received: 12 November 2010 – Published in Atmos. Chem. Phys. Discuss.: 25 November 2010 Revised: 25 March 2011 – Accepted: 4 April 2011 – Published: 15 April 2011
Abstract. We have used a 2-D axisymmetric,
non-hydrostatic, bin-resolved cloud model to examine the im-pact of aerosol changes on the development of mixed-phase convective clouds. We have simulated convective clouds from four different sites (three continental and one tropi-cal marine) with a wide range of realistic aerosol loadings and initial thermodynamic conditions (a total of 93 differ-ent clouds). It is found that the accumulated precipitation responds very differently to changing aerosol in the marine and continental environments. For the continental clouds, the scaled total precipitation reaches a maximum for aerosol that produce drop numbers at cloud base between 180–430 cm−3
when other conditions are the same. In contrast, all the trop-ical marine clouds show an increase in accumulated precip-itation and deeper convection with increasing aerosol load-ing. For continental clouds, drops are rapidly depleted by ice particles shortly after the onset of precipitation. The pre-cipitation is dominantly produced by melting ice particles. The riming rate increases with aerosol when the loading is very low, and decreases when the loading is high. Peak pre-cipitation intensities tend to increase with aerosol up to drop concentrations (at cloud base) of∼500 cm−3then decrease with further aerosol increases. This behaviour is caused by the initial transition from warm to mixed-phase rain followed by reduced efficiency of mixed-phase rain at very high drop concentrations. The response of tropical marine clouds to in-creasing aerosol is different to, and larger than, that of conti-nental clouds. In the more humid tropical marine environ-ment with low cloud bases we find that accumulated pre-cipitation increases with increasing aerosol. The increase is driven by the transition from warm to mixed-phase rain. Our study suggests that the response of deep convective clouds to aerosol will be an important contribution to the spatial and temporal variability in cloud microphysics and precipitation.
Correspondence to:Z. Cui (z.cui@leeds.ac.uk)
1 Introduction
The response of precipitation to aerosol attracts much atten-tion and remains uncertain (IPCC, 2007). It is unclear that a systematic reduction in precipitation is the demonstrated re-sult of particle pollution that enhances CCN levels (Levin and Cotton, 2009). The uncertainty stems from complex scales and processes involved.
The effect of aerosol can vary regionally and depend strongly on the type of cloud. For example, Rotstayn et al. (2007) showed that anthropogenic aerosol over Asia af-fects meridional temperature gradients and atmospheric cir-culation, and may have caused an increase in rainfall over north-western Australia. Aerosol may or may not affect pre-cipitation over orographic terrain. On one hand, Givati and Rosenfeld (2004) found that downwind of pollution sources, on the upslope of mountains and mountain tops, orographic precipitation is reduced by increases in aerosol. On the other hand, Alpert et al. (2008) concluded that other factors be-side aerosol pollution dominate the precipitation amount in orographic clouds. Aerosol may affect precipitation inten-sity rather than total amount. Chen et al. (2008) found that the total rain hours decreased significantly, and the precipi-tation intensity increased significantly during five decades in Taiwan, i.e., the rainfall intensity distribution shifted. Rosen-feld et al. (2008) reviewed the aerosol impact on precipitation in deep convective cloud and they concluded that the conse-quences of enhanced aerosol concentration are nonlinear and depend strongly on meteorological parameters.
paper, we focus on deep convective clouds at continental and tropical oceanic locations.
A major difference between warm and deep convective clouds is that deep convective clouds contain ice particles. Ice formation mechanisms include homogeneous and het-erogeneous freezing modes. Homogeneous freezing occurs at temperatures below about −38◦C depending on cloud
drop size, whilst heterogeneous freezing (contact and im-mersion freezing) at higher temperatures. Aerosols affect ice particles in different ways in those modes. Hence, the influence of aerosol on ice particles is more complex than on cloud drops. Increasing aerosol number concentration over the whole spectrum or the accumulation mode leads to a narrower cloud drop size distribution (e.g., Rosenfeld et al., 2001; Andreae et al., 2004; Koren et al., 2005). As a result, warm rain is suppressed (Rosenfeld and Ulbrich, 2003; Andreae et al., 2004; Lin et al., 2006). Therefore, more condensates can reach the freezing level, allowing more drops to freeze as ice particles, releasing more latent heat, and enhancing cold rain processes (e.g., Orville et al., 2001; Williams et al., 2002; Andreae et al., 2004; Lin et al., 2006; Bell et al., 2008). However, Cui et al. (2006) found that high aerosol loading tends to have stronger cooling through the Bergeron mechanism. This is due to the coexistence of ice particles and more numerous but smaller drops in the upper part of the cloud.
There are different views on how enhanced CCN concen-trations will impact precipitation in deep convective clouds. In their simulations, Khain et al. (2005) found drizzle de-pleted the cloud liquid water in a clean cloud so that less latent heat was released when the cloud glaciated, resulting in less vigorous convection. Thus, a squall line did not form under clean conditions, whereas a squall line developed un-der continental aerosol conditions and produced more pre-cipitation. Rosenfeld and Woodley (2000) found that precip-itation increases with enhanced aerosol loadings in convec-tive clouds with tops above the homogeneous freezing level. Phillips et al. (2002) studied a multi-thermal, continental convective cloud using an explicit microphysical model with the dynamics prescribed by a 2-D cloud-resolving model. For the shallow storm, an increase in CCN led to a reduc-tion in precipitareduc-tion rate due to a reducreduc-tion in mean droplet size in the autoconversion scheme, while in the deep storm scenario, precipitation was found to be much less sensitive to changing aerosol.
Seifert and Beheng (2005) showed that the effect of changes in CCN on mixed phase convective clouds is de-pendent on cloud type. They found a negative effect on to-tal precipitation and maximum updraft velocity for ordinary single cells and supercell storms and a positive effect for multicell cloud systems. Langmann (2007) studied the in-fluence of smoke-haze on warm precipitation formation in Indonesia during El Ni˜no years. In the haze-affected regions of Indonesia, aerosol-cloud interactions induce events with both precipitation suppression and enhancement compared
to a reference simulation without aerosol-cloud interactions. Fan et al. (2007) simulated the effects of aerosols and rela-tive humidity on cumulus clouds. They found that the mar-itime aerosol case results in more intensive radar reflectiv-ity in both developing and mature stages than the continen-tal aerosol cases, because of enhanced warm rain by colli-sions and ice processes by deposition growth due to larger droplet sizes and higher supersaturation, respectively. They also found that more latent heat release from increasing con-densation results in stronger convection and more melting precipitation in polluted continental aerosol concentrations. Yu et al. (2007) studied the interannual variability of smoke and warm cloud relationships in the Amazon using MODIS retrievals. They found smoke aerosols are associated with either an increase or a decrease of cloud fraction. They sug-gested that the aerosol-cloud relation can be influenced by atmospheric structure and convective motions, in addition to changes in aerosols properties.
Recently, researchers have extended the method of two-scenario comparisons (i.e., clean and polluted aerosol en-vironments) to a realistic range of aerosol loadings. Cui et al. (2006) studied the aerosol effect on deep convective clouds with the aerosol concentrations varying in a realistic range. The importance of using a range of CCN concentra-tions was supported by Ekman et al. (2007), who investigated the effect of aerosol composition and concentration on the development and anvil properties of a continental deep con-vective cloud. They found that the response is non-linear and for low increments of CCN, coalescence and graupel forma-tion becomes more efficient, which increases the total pre-cipitation.
The properties of convective clouds depend on the atmo-spheric conditions and aerosol concentration and distribu-tion. Since both of these change with geographical location it is clear that there is a need for a systematic study of aerosol effects on deep convective clouds at various geographic loca-tions when aerosol loading and atmospheric stratification and humidity change. Khain et al. (2008) attempted to classify the impact of aerosols on surface precipitation. By analyz-ing the mass, heat, and moisture budgets, they proposed that the freezing level height could be used to classify the aerosol effects on precipitation from clouds of different types.
2 Model description
The model used for this study is a 2-D axisymmetric, non-hydrostatic cloud model (Yin et al., 2005). The model has been used to study interactions between aerosol and phase clouds: the redistribution of trace gases by mixed-phase convective clouds (Yin et al., 2002), transport and pro-cessing of aerosols (Yin et al., 2005), aerosol effects on cloud microphysics (Cui et al., 2006), aerosol transport efficiency (Cui and Carslaw, 2006), and ice production (Huang et al., 2008, 2011).
The model is based on that of Reisin et al. (1996a) and contains a detailed dynamically coupled representation of the following microphysical processes: drop nucleation, con-densation/evaporation, collision-coalescence, binary break-up, drop sedimentation, ice nucleation, ice multiplication, ice-ice and ice-drop interactions, melting of ice particles, and sedimentation of ice particles. Four hydrometeors (wa-ter, ice, rimed particles and snow) are represented by 34 mass-doubling size bins for both mass and number concen-tration (Yin et al., 2005). Immersion freezing is obtained from Bigg (1953). The number of ice crystals produced by contact nucleation due to thermophoresis, diffusiophore-sis, and Brownian motion is from Cotton et al. (1986). The model parameterisation of the number of aerosols available for deposition freezing is obtained from Meyers et al. (1992). Contact freezing is also parameterised following Meyers et al. (1992). The model also contains a description of ice mul-tiplication, which is active in the range−3 to−8◦C (Hallett
and Mossop, 1974).
Aerosol particles are represented using 43 size bins from 0.001 to 15.75 µm. Activation of aerosol to cloud drops is determined by the supersaturation, assuming a K¨ohler curve for particles composed of ammonium sulfate for continen-tal clouds and sodium chloride for marine clouds (Yin et al., 2000). The model contains a description of the scavenging of aerosol by hydrometeor impaction and aerosol regenera-tion following hydrometeor evaporaregenera-tion (Yin et al., 2005). An initial aerosol vertical profile is defined for each experi-ment (see Sect. 3). This profile is allowed to evolve across the model domain through interaction with the growing and precipitating cloud.
In previous studies we have shown the effect of cloud pro-cessing of SO2 to sulfate to be negligible (about 10%
in-crease in sulfate mass) for a single convective cloud with a duration of 1 h (Yin et al., 2000). Although the sulphate formation has been shown to be small, the coating of min-eral dust with sulphuric acid could change the properties of ice nuclei and the coated dust particles could be served as GCCN. However, the effect of coatings on heterogeneous ice nucleation needs further study (e.g., Sullivan et al., 2010). In these simulations we have therefore switched off the gas and aqueous phase chemistry scheme.
In these simulations we use a grid resolution of 60×120 m over horizontal domains of 6000 m and a vertical domain of
15 000 m. In cases where the cloud top heights approached 15 000 m, the vertical domain was extended to 18 000 m. The time step is 1 s for condensation/evaporation of drops or de-position/sublimation of ice particles, and 2 s for all other pro-cesses. The duration of the simulations is 65 min, except for the Montana clouds, which is 80 min because of the late on-set of precipitation. For initialization, a thermal perturba-tion is imposed for one time step att=0. The thermal size,
amplitude, and location do not change for aerosol sensitivity runs. A typical thermal has a 2◦C perturbation placed
be-tween 0.84 and 1.32 km within 120–180 m of the centre. The values were different for different geographical locations.
3 Model experiments
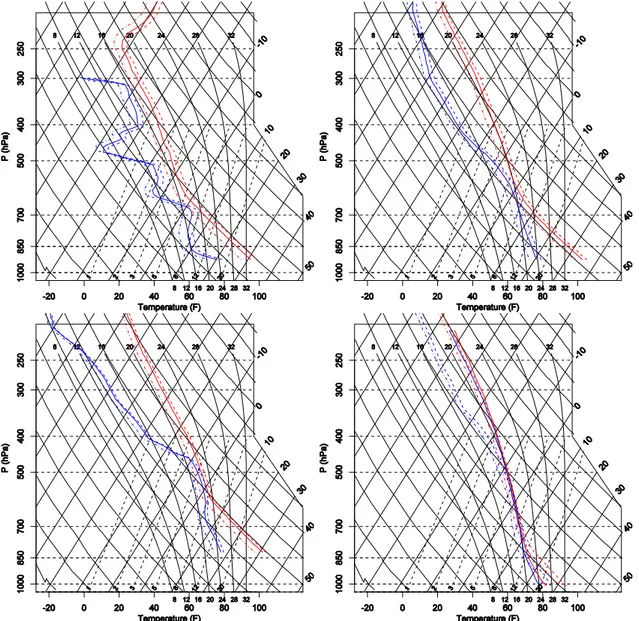
We have conducted a series of model runs to examine the im-pact of aerosol loading on the development of deep convec-tive clouds in two distinct environments – continental North America and the Tropical Pacific. Four thermodynamic pro-files were used (Fig. 1), based on observations from Mon-tana (e.g., Hobbs et al., 1985; Respondek et al., 1995; Yin et al., 2005); New Mexico (Blyth and Latham, 1993, 1997); Midland, Texas (Rosenfeld and Woodley, 2000; Khain et al., 2008); and the tropical Pacific TOGA-COARE region (Mon-crieff et al., 1997; Devine et al., 2006). In each location, 3 clouds with different vigour were produced by slightly modifying each profile in such a way as to change the ini-tial updraught speed. Each of the 9 continental clouds was then simulated using 8 different aerosol loadings, resulting in a total of 72 different continental clouds. The 3 marine clouds were simulated using 7 different aerosol loadings. We have therefore simulated 93 different clouds covering a wide range of thermodynamic initial conditions and aerosol load-ings (CCN concentrations).
The initial continental aerosol size distribution is de-scribed in Yin et al. (2005) and based upon Hobbs et al. (1985) and Respondek et al. (1995). To produce a range of input aerosol size distributions for the continental runs, the accumulation mode number concentration was scaled (by a factor of 40 between minimum and maximum aerosol runs), see Fig. 2 and Table 1. For the three lowest aerosol loadings in the continental environment we used the distribution from the marine runs, appropriately scaled so as to produce low drop numbers at cloud base. A representative tropical marine aerosol size distribution was obtained from a global aerosol model (Spracklen et al., 2005), which produces size distribu-tions in good agreement with observadistribu-tions (Spracklen et al., 2007). It differs from the continental distribution by hav-ing a larger concentration of particles in the coarse mode (>500 nm). A range of marine aerosol loadings (by a factor
Fig. 1.Initial profiles used in model simulations: Montana (MO, top left), Texas (TX, top right), New Mexico (NM, bottom left) and Tropical Pacific (TP, bottom right).
We focus on changes in CCN rather than giant CCN (aerosol particles larger than 1 µm). Previous studies have shown that an increased concentration of giant CCN (GCCN) enhances rainfall in warm-phase clouds through collection (Johnson, 1982) as well as through the hygroscopic seed-ing process (e.g., Tzivion et al., 1994; Cooper et al., 1997). Teller and Levin (2006) found that the increased rainfall due to GCCN is mainly a result of the increased graupel mass in the cloud, which partially offsets the decrease in rainfall due to pollution (increased CCN). To avoid the entangled offset effect caused by increasing CCN and GCCN, we restrict the meaning of increasing aerosol to increasing aerosol in the lower troposphere without increasing GCCN.
The aerosol loading was assumed to fall in the vertical di-rection with a scale height of 2 km in all simulations,
assum-ing that the size of the particles remain constant (i.e., that both particle concentration and mass remain in proportion). Previous studies have examined the effect of elevated aerosol layers. For example, Yin and Chen (2007) showed that pre-cipitation can be either suppressed or intensified by dust lay-ers depending on the height of the laylay-ers. We do not examine such height effects here.
Table 1. Naming convention used in this paper. For example, NM-v3-aerC1 is a run using the New Mexico profile adjusted to give high CAPE and using the lowest continental aerosol loading. Aerosol loading refers to the relative number concentration of particles in the accumulation mode for continental simulations or in the accumulation and coarse modes in marine runs.
Location/Environment Cloud vigour Aerosol loading Aerosol loading
(contenental type) (marine type)
Code Location Code CAPE Code Relative Code Relative
adjustment abundance abundance
MO Montana v1 Low C1 0.1 M1 0.1
TX Texas v2 Medium C2 0.5 M2 0.25
NM New Mexico v3 High C3 1.0 M3 0.5
TP Tropical Pacific C4 2.0 M4 1.0
C5 4.0 M5 2.0
M6 5.0
M7 10.0
Table 2.Maximum cloud base drop number attained for different thermodynamic environment and aerosol loadings for the medium CAPE runs (v2). C = aerosol distributions based on continental profile (Fig. 2a), M = aerosol distributions based on maritime distributions (Fig. 2b).
Aerosol Loading
Location-vigour M1 M2 M3 M4 M5 M6 M7 C1 C2 C3 C4 C5
TP-v2 50 100 180 280 470 920 1900
MO-v2 70 190 320 380 450 650 900 1300
TX-v2 50 180 290 430 500 670 1100 1800
NM-v2 50 185 300 420 520 680 1050 1850
1e−03 1e−01 1e+01
1e−04
1e−02
1e+00
1e+02
Diameter (µm)
dN/dlnr(cm
−
3)
C1 C2 C3 C4 C5 (a) Continental Aerosol
1e−03 1e−01 1e+01
1e−04
1e−02
1e+00
1e+02
Diameter (µm)
dN/dlnr(cm
−
3)
M1 M2 M3 M4 M5 M6 M7 (b) Maritime Aerosol
Fig. 2.Aerosol size distributions used in the model simulations for
(a)continental clouds and(b)tropical marine clouds.
4 Results
4.1 Range of cloud properties
Table 2 summarises how the cloud drop number concentra-tion (CDNC) at cloud base varies with the aerosol distribu-tion used and Table 3 summarises the range of cloud prop-erties for each of the model runs undertaken. The range
of cloud base CDNC of 50–1900 cm−3 for marine tropical
clouds and 50–1850 cm−3for continental clouds more than
covers typically observed concentrations. We use these cloud base CDNC, rather than the properties of the aerosol, to in-tercompare the various model runs. The resulting continen-tal (tropical marine) clouds have maximum updraught ve-locities in the range 13–40 (9–21) ms−1, cloud top heights
ranging from∼6–15 (6–13) km, and maximum cloud liquid water contents in the range 4–13 (5–21) gkg−1. The
max-imum precipitation intensities span the range 10–530 (105– 550) mmh−1. In the following sections we examine the effect
of changing aerosol loadings on the bulk properties of these convective clouds and the microphysical processes which control the cloud responses to aerosol perturbations.
4.2 Accumulated precipitation
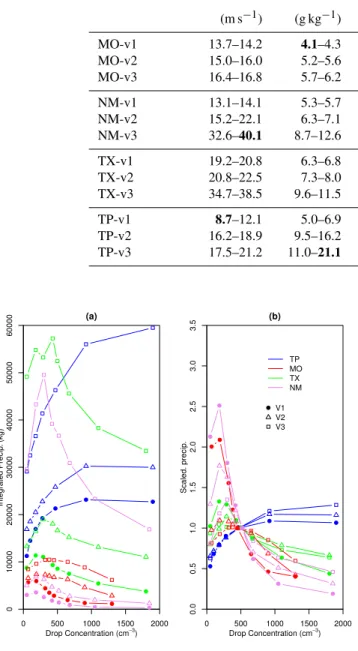
Figure 3 shows how the accumulated precipitation changes with aerosol loading for the complete range of thermody-namic profiles. Results are shown as absolute precipitation amounts (Fig. 3a) and relative to the runs with CDNC closest to 500 cm−3(Fig. 3b). It is clear from Fig. 3 that the
Table 3.Variation of updraught speed, liquid water content, cloud top height, accumulated and peak rainfall in the simulated clouds. The ranges show the response to changes in aerosol given in Table 1. Accumulated precipitation is area-weighted. Bold indicates maxima and minima across all experiments.
Simulations Max updraught Max. LWC Max cloud Accumulated rainfall Peak rain rate
top height Precipitation Intensity
(m s−1) (g kg−1) (km) (mm) (mm hr−1)
MO-v1 13.7–14.2 4.1–4.3 6.1–7.0 0.3–1.7 55–115
MO-v2 15.0–16.0 5.2–5.6 7.5–8.8 0.6–2.1 85–165
MO-v3 16.4–16.8 5.7–6.2 10.0–10.5 1.6–2.9 155–220
NM-v1 13.1–14.1 5.3–5.7 6.4–9.6 0.06–0.9 10–55
NM-v2 15.2–22.1 6.3–7.1 11.1–11.8 0.2–1.5 40–140
NM-v3 32.6–40.1 8.7–12.6 12.2–14.6 2.4–7.6 235–530
TX-v1 19.2–20.8 6.3–6.8 7.3–8.5 0.6–2.3 90–135
TX-v2 20.8–22.5 7.3–8.0 10.3–10.7 1.4–2.7 120–185
TX-v3 34.7–38.5 9.6–11.5 12.0–14.7 4.0–7.2 155–210
TP-v1 8.7–12.1 5.0–6.9 6.0–6.7 3.2–6.9 105–175
TP-v2 16.2–18.9 9.5–16.2 8.0–8.3 3.6–6.7 180–390
TP-v3 17.5–21.2 11.0–21.1 10.2–12.7 5.0–11.0 210–550
0 500 1000 1500 2000
0
10000
20000
30000
40000
50000
60000
Drop Concentration (cm−3
)
Integr
ated Precip
. (kg)
(a)
0 500 1000 1500 2000
0.0
0.5
1.0
1.5
2.0
2.5
3.0
3.5
Drop Concentration (cm−3
)
Scaled. precip
.
(b)
TP MO TX NM V1 V2 V3
Fig. 3. (a)Change in total accumulated precipitation as a func-tion of the maximum initial cloud drop number for a range of sim-ulated convective clouds due to changes in aerosol from Table 1. Three separate sets of simulations with storm intensities were per-formed in each environment: high (v3), medium (v2) and low (v1).
In(b)rainfall is normalised by the model run with a droplet
con-centration of 500 cm−3.
For the continental clouds, the total precipitation reaches a maximum for cloud base CDNC between 180 and 430 cm−3,
as shown in the scaled total precipitation in Fig. 3 and Ta-ble 2. In contrast, all the tropical marine clouds show an in-crease in accumulated precipitation with increasing aerosol
loading for cloud base CDNC between 50 and 1900 cm−3
(Fig. 3b). Our simulations show that these responses to aerosol are consistent across a very wide range of cloud en-vironments and updraughts.
Previous studies of convective clouds (e.g., Khain et al., 2005) found that precipitation increased with aerosol parti-cle concentration under moist environmental conditions (e.g., tropical oceans), but decreased in dry unstable conditions (e.g., continental sites). This response was attributed to the competition for available moisture: high aerosol load-ing in dry environments leads to inefficient coalescence of small droplets. Lee et al. (2008) examined the dependence of aerosol effects on clouds and precipitation on cloud-system organization, shear and stability. Recently, Khain et al. (2008) proposed that the height of convective cloud base could be used to classify the impact of aerosol on precipi-tation. In clouds with a low freezing height, warm rain is negligibly small, and cold precipitation is dominant within a wide range of aerosol concentrations. They also stressed the importance of available depth for warm rain processes. In our simulations, precipitation increases with aerosol in the moist tropical ocean environment (TP clouds) where the freezing level is also high (∼4 km). In continental clouds, which have low freezing level, precipitation first increases with aerosol when concentrations are very low (and the competition for water vapour is not very intense) but it decreases when the aerosol loading is high. We will discuss these responses in more detail in Sect. 4.4.
results in a decrease in accumulated precipitation by a fac-tor 2 to 4 for most of the simulated continental clouds but a similar change in drop number results in only a 50% increase in precipitation for the marine clouds (Fig. 3b). The strong response in the case of continental clouds is probably due to the sharp decrease in precipitation efficiency with aerosol loading (Cui and Carslaw, 2006). We also note that, in gen-eral, the sensitivity of accumulated precipitation to aerosol is least pronounced for the most vigorous clouds and most pronounced for the clouds producing least precipitation (e.g., NM-v1 and MO-v1).
The precipitation produced from the NM clouds is more sensitive to changes in cloud base CDNC than other conti-nental clouds simulated. In contrast to other clouds, the max-imum vertical velocity in the cloud is particularly sensitive to the rate of glaciation.
4.3 Precipitation onset and intensity
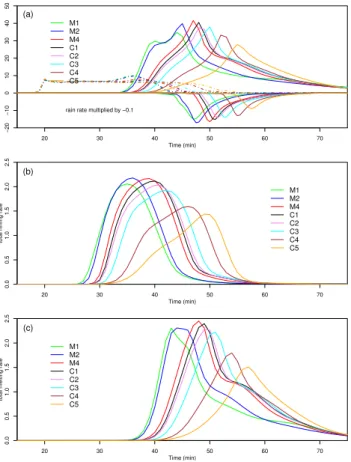
Figure 4 shows the temporal evolution of the instantaneous maximum precipitation intensity for the intermediate vigour cloud from each of the environments from Fig. 1: MO-v2, TX-v2, NM-v2 and TP-v2.
In the continental environments an increase in aerosol gen-erally leads to a delay in the onset of precipitation. Increas-ing aerosol loadIncreas-ing produces more numerous but smaller cloud drops and suppresses the collision-coalescence effi-ciency. The suppressed warm rain process, in turn, permits more drops transported to higher levels. The dominant ice production in our study is immersion freezing although other processes may be important in other cases. The smaller drops are less efficient in becoming graupel particles through the immersion mode. The precipitation, mainly from the melting graupel particles (see discussion of Fig. 7 for detail), there-fore, delays (Teller and Levin, 2006; Yin et al., 2000). How-ever, the peak precipitation intensities appear for moderate aerosol loadings albeit with differences in the three conti-nental cases. The peaks are related to aerosol loadings of M2, C1, and M4 for MO, TX, and NM clouds, respectively. A seemingly optimal aerosol loading for peak precipitation is discussed in detail in Sect. 4.4.1. For the maritime clouds (Fig. 4d), the onset of precipitation is delayed with increas-ing aerosol, and the precipitation intensity increases with aerosol loading.
The dependence of the maximum intensity of precipi-tation with aerosol is less straightforward (Fig. 5). For a given aerosol concentration, the intensity increases with cloud vigour. For a given vigour, the maximum precipita-tion rates approach peak values when the maximum drop number concentrations near cloud bases are between 200 and 500 cm−3for most cases. There are some exceptions.
MO-v1 has the peak precipitation intensity with the lowest aerosol loading. In the marine environment the maximum precipita-tion intensity tends to increase with aerosol until cloud-base
20 30 40 50 60 70
0 50 100 150 200 250 Time (min) Rain−rate (mm/h) M1 M2 M4 C1 C2 C3 C4 C5 (a) MO
20 30 40 50 60 70
0 50 100 150 200 250 Time (min) Rain−rate (mm/h) M1 M2 M4 C1 C2 C3 C4 C5 (b) TX
20 30 40 50 60 70
0 50 100 150 200 250 Time (min) Rain−rate (mm/h) M1 M2 M4 C1 C2 C3 C4 C5 (c) NM
20 30 40 50 60 70
0 50 100 150 200 250 Time (min) Rain−rate (mm/h) M1 M2 M3 M4 M5 M6 M7 (d) TP
Fig. 4.Temporal evolution of precipitation intensity at cloud centre
for(a)MO-v2,(b)TX-v2,(c)NM-v2 and(d)TP-v2. Timet=0
refers to the start of simulation.
0 500 1000 1500 2000
0 100 200 300 400 500 600
Drop Concentration (cm−3
)
Max. precip. rate
(m m h − 1) TP MO TX NM V1 V2 V3 (a)
0 500 1000 1500 2000
0
1
2
3
4
Drop Concentration (cm−3
)
Scaled precip. rate
TP MO TX NM V1 V2 V3 (b)
Fig. 5.Dependence of maximum precipitation intensity on location,
cloud vigor and aerosol (cloud drop number).(a)Absolute
precip-itation rates.(b)Precipitation rates scaled to values at 500 cm−3to
show relative changes.
0.0 0.4 0.8
0
2
4
6
8
S. drop (gkg−1 )
Altitude (km)
a
0.00 0.04 0.08
0
2
4
6
8
M. drop (gkg−1 ) b
0.00 0.02 0.04
0
2
4
6
8
L. drop (gkg−1 ) c
0.0 1.0 2.0 3.0
0
2
4
6
8
Graupel (gkg−1 ) d
0 2 4 6
0
2
4
6
8
Graupel (litre−1 ) e
M1 M2 M4 C1 C2 C3 C4 C5
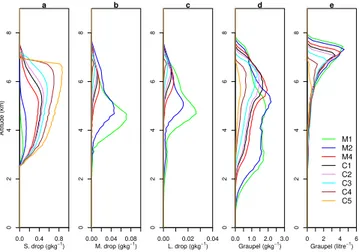
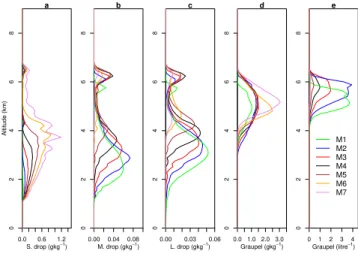
Fig. 6.Drop masses at the cloud centre for(a)small drops
(diame-ter<50 µm),(b)medium-drops (50 µm<diameter<1000 µm), and
(c)large drops (diameter>1000 µm). Also shown are(d) mean
graupel specific mass, and (e) graupel number concentration at
40 min from MO-v2. See text for definitions. The mass and con-centration of graupel are averaged over grid points where there is graupel.
The large range of cloud thermodynamics that we have im-posed by simulating different regions and different values of warm bubble results in changes in precipitation intensity that range between a factor 1.5 and 23.5, with a mean change of 5.8. The response to large changes in aerosol ranges between 1.3 and 5.5, with a mean response over all simulations of a factor 2.2 increase. Thus, although the imposed changes in aerosol and thermodynamics need to be viewed in the context of the real environment, our simulations suggest that peak precipitation intensity is more sensitive to thermodynamics than aerosol. Aerosol loading alone affects the collision-coalescence of drops, the formation of ice particles via drop freezing, the partitioning of the contribution from the cold and warm precipitation processes, the intensity of precipita-tion rate, and the precipitaprecipita-tion onset. The atmospheric tem-perature and moisture profiles not only affect those, but also other microphysical processes. For example, a warmer envi-ronment effectively increases the depth of the warm rain pro-cesses and allows drops to grow to larger sizes. Therefore, it enhances graupel particles via immersion freezing and pro-duces more precipitation once the graupel particles sediment below the elevated melting level. As a result, both precipita-tion intensity and duraprecipita-tion increase.
4.4 Microphysical responses
In this section we explore how the microphysical processes in the different clouds respond to changes in aerosol, and how these changes explain the changes in precipitation.
4.4.1 Response of continental clouds
We focus first on the microphysical response of the Montana (MO) clouds. Figure 6 shows the mass of small, medium and large drops as well as the graupel mass and number concen-trations at the cloud centre at 40 min with continental aerosol (MO-v2-aerC3). The small, medium, and large drops are de-fined as those with diameter less than 50 µm, between 50– 1000 µm, and larger than 1000 µm, respectively. Clearly, in-creasing aerosol leads to a reduced population of large drops, an increase in the mass of small drops and a suppression of graupel. With increasing aerosol the smaller drops penetrate higher into the cloud top and the height of the maximum of medium and large drops increases. The masses of medium and large drops are higher for lower aerosol loadings, and the height where the maximum values of drop mass appear are lower. The maximum graupel mass (Fig. 6d) increases with aerosol when the aerosol loading is low (M1 and M2), but de-creases again with higher aerosol loading (M4 and C1–C5). This response can be explained by examining the growth rate of graupel particles by riming, which is determined by the size of the graupel, the concentration and size distribution of drops, and the collision kernel. Large graupel has a large collision kernel, and the size range over which the graupel collects drops is wide. When the aerosol concentration is very low, the concentration of drops is low and the graupel particles are large. On the other hand, when the aerosol con-centration is high, the concon-centration of drops is high but the graupel particles are small and the graupel-drop collision ker-nel is low. For intermediate initial aerosol loadings (M2 and M4), the continental clouds produce reasonably high concen-tration of large graupel particles.
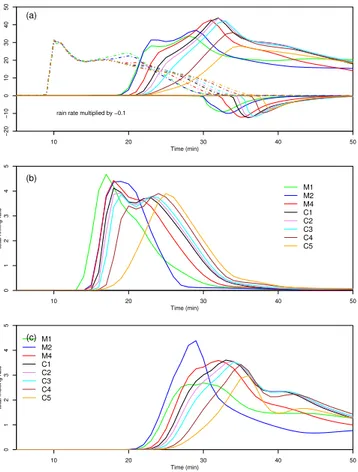
To see clearly the relationship between precipitation, drops and graupel in this Montana cloud, Fig. 7a shows the tempo-ral change of precipitation rate together with drop and grau-pel masses at the melting level. When precipitation starts, the mass of graupel particles is much larger than the mass of drops and the remaining drops are rapidly depleted by riming shortly after the onset of precipitation. The precipitation is therefore mainly produced by melting graupel particles. Fig-ure 7b and c shows that melting lags riming by about 8–9 min and that the temporal development of melting is strikingly similar to that of precipitation, which lags melting by a fur-ther 2–4 min. The time-lag correlation of 2 min between the precipitation rate and melting rate for each aerosol loading is consistently∼0.84. The highest correlation is 4 min time-lag for aerosol M1, and it is 0.91. The correlation coefficients are plotted in Fig. 8. The strong correlation demonstrates that precipitation is mostly from melting of highly rimed parti-cles, graupel.
20 30 40 50 60 70
−
2
0
−
1
0
0
1
02
03
04
05
0
Time (min)
M1 M2 M4 C1 C2 C3 C4 C5
(a)
rain rate multiplied by −0.1
20 30 40 50 60 70
0.0
0.5
1.0
1.5
2.0
2.5
Time (min)
total riming rate
M1 M2 M4 C1 C2 C3 C4 C5
(b)
20 30 40 50 60 70
0.0
0.5
1.0
1.5
2.0
2.5
Time (min)
total melting rate
M1 M2 M4 C1 C2 C3 C4 C5
(c)
Fig. 7. (a)The sum of drop mass (g kg−1 in dash-dotted lines),
graupel mass (g kg−1in solid lines) at the level just above 0◦C. The
precipitation rate in Fig. 4 is also added in the figure for reference.
Note that the precipitation rate is multiplied by−0.1 to avoid
con-gestion in the figure. Temporal variation of total riming rate(b)and
total melting rate(c)from MO-v2 cases. The units are g kg−1s−1.
of riming rate curves than the MO and TX clouds. The spread is reflected in the accumulated precipitation in Fig. 3a, the temporal variation of precipitation rate in Fig. 4c, and the maximum precipitation rate in Fig. 5a.
The TX clouds are similar to MO clouds in terms of rim-ing and meltrim-ing features. The vertical variations of rimrim-ing rate (Fig. 9a, c) are similar, and both the MO and TX clouds are less spreading than the NM clouds. The origins of pre-cipitation are similar, and it is mainly from melting graupel particles in both MO and TX clouds (Fig. 10). The drops are almost depleted shortly after the onset of precipitation. The melting rate and the precipitation rate are highly correlated in both MO and TX clouds (Fig. 8). For TX-v2, the corre-lations of 3 min time lag are between 0.67 and 0.72, and the mean value of correlation for the 8 aerosol loadings is 0.68.
For NM clouds, the drop mass and graupel mass at the melting level behave slightly differently to the MO and TX clouds, suggesting a different balance of warm and cold rain processes. Drops still exist after the onset of precipitation (Fig. 11) (although the drop mass is much smaller than the graupel mass) so precipitation from warm rain contributes a
M1 M3 M5 M7 C2 C4 M1 M3 M5 M7 C2 C4
0.1
0.3
0.5
0.7
0.9
0.1
0.3
0.5
0.7
0.9
MO (Montana) TX (Texas)
MN (New Mexico) TP (Tropical Pacific) correlation coefficient
Fig. 8.Summary of the correlation between the melting rate and the precipitation rate for the mid-CAPE cases. For MO and NM clouds, the correlation is 2 min time-lagged; for TX clouds, it is 3 min; and for TP clouds, it is not time-lagged.
0.0000 0.00050.0010 0.00150.0020
2
4
6
8
10
riming rate
Altitude (km)
M1 M2 M4 C1 C2 C3 C4 C5 (a) MO
0.0000 0.0004 0.0008 0.0012
2
4
6
8
10
riming rate
(b) NM
0.0000 0.0010 0.0020 0.0030
2
4
6
8
10
riming rate
(c) TX
Fig. 9. Vertical variation of the mean riming rate for (a)MO,
(b)NM and(c)TX clouds. The averages were taken horizontally
10 20 30 40 50
−
2
0
−
1
0
0
1
02
03
04
05
0
Time (min)
(a)
rain rate multiplied by −0.1
10 20 30 40 50
012345
Time (min)
total riming rate
M1 M2 M4 C1 C2 C3 C4 C5
(b)
10 20 30 40 50
012345
Time (min)
total melting rate
M1 M2 M4 C1 C2 C3 C4 C5
(c)
Fig. 10.Texas clouds:(a)The sum of drop mass (g kg−1in
dash-dotted lines), graupel mass (g kg−1in solid lines) at the level just
above 0◦C. The precipitation rate in Fig. 4 is also added in the figure
for reference. Note that the precipitation rate is multiplied by−0.1
to avoid congestion in the figure. Temporal variation of total riming
rate(b)and total melting rate(c)from TX-v2 cases. The units are
g kg−1s−1.
small amount to the total precipitation. Another different fea-ture of NM clouds is the large change in the vertical profile of riming rate and stronger decrease in graupel mass with aerosol loading (Fig. 9b). In Sect. 4.2, we showed that the precipitation produced from the NM clouds is more sensitive to changes in aerosol than the other continental clouds sim-ulated. The above analysis demonstrates that this sensitivity is caused by the response of riming and melting to aerosol. The correlation coefficient between melting rate and precip-itation rate are calculated for NM clouds (Fig. 8). For NM-v2, the time-lag correlations of 2 min between the melting rate and precipitation rate for each aerosol loading are calcu-lated. They are between 0.83 and 0.91, and the mean value of correlation for the 8 aerosol loadings is 0.86.
Freud et al. (2008) investigated the relation between cloud base drop concentration and the height for onset of warm rain in young growing convective clouds in the Amazon. They found that the increased depth for warm rain with greater number concentration of drops at cloud base and hence of
10 20 30 40 50 60
−
2
0
−
1
0
0
1
02
03
04
05
0
Time (min)
(a)
rain rate multiplied by −0.1
10 20 30 40 50 60
012345
Time (min)
total riming rate
M1 M2 M4 C1 C2 C3 C4 C5
(b)
10 20 30 40 50 60
0.0
0.5
1.0
1.5
2.0
2.5
3.0
Time (min)
total melting rate
M1 M2 M4 C1 C2 C3 C4 C5
(c)
Fig. 11.New Mexico clouds:(a)The sum of drop mass (g kg−1in
dash-dotted lines), graupel mass (g kg−1in solid lines) at the level
just above 0◦C. The precipitation rate in Fig. 4 is also added in the
figure for reference. Note that the precipitation rate is multiplied by
−0.1 to avoid congestion in the figure. Temporal variation of total
riming rate(b)and total melting rate(c)from NM-v2 cases. The
units are g kg−1s−1.
CCN concentration. In the continental clouds simulated in this paper, the high cloud bases (2.5–3 km above the surface) and strong updrafts greatly suppress warm rain even at very low cloud drop numbers.
In summary, for the continental clouds studied here, the riming rate increases with aerosol when the loading is very low, and decreases when the loading is high. Melted grau-pel particles below the melting level precipitate. The relative unimportance of warm rain means that the precipitation rate depends primarily on the melting rate.
4.4.2 Response of maritime clouds
10 20 30 40 50 60
−20
0
20
40
60
80
100
120
Time (min)
(a)
rain rate multiplied by −0.1
10 20 30 40 50 60
0
1
2
3
4
5
Time (min)
total riming rate
M1 M2 M3 M4 M5 M6 M7
(b)
10 20 30 40 50 60
0.0
0.5
1.0
1.5
2.0
2.5
3.0
Time (min)
total melting rate
M1 M2 M3 M4 M5 M6 M7
(c)
Fig. 12.Tropical Pacific clouds:(a)The sum of drop mass (g kg−1
in dash-dotted lines), graupel mass (g kg−1 in solid lines) at the
level just above 0◦C. The precipitation rate in Fig. 4 is also added in
the figure for reference. Note that the precipitation rate is multiplied
by−0.1 to avoid congestion in the figure. Temporal variation of
total riming rate(b) and total melting rate(c)from TP-v2 cases.
The units are g kg−1s−1.
fraction of graupel mass at the melting level, even after pre-cipitation starts. Figure 12a therefore suggests that this TP cloud is not rapidly glaciated after the onset of precipitation and that precipitation results from both warm and cold rain processes. The vertical variation of drop mass (Figs. 13–15) also shows that raindrops develop below the melting level.
The total riming rate (Fig. 12b) generally increases with aerosol, an opposite response to the continental clouds. Like-wise, the total melting rate generally increases with aerosol before 30 min, covering the period of peak rainfall intensity (Fig. 12c). However, the correlation between the melting rate and precipitation rate is not as clear as for the continental clouds (Fig. 8): they are generally well correlated for high aerosol cases (aerM3-aerM7) with correlation coefficients of 0.67–0.72, but poorly correlated for the lower aerosol cases (0.05 for aerM1 and 0.51 for aerM2). This increase in cor-relation between melting and precipitation with increasing aerosol reflects the shift from warm rain to cold (graupel-induced) rain.
0.0 0.6 1.2
0
2
4
6
8
S. drop (gkg−1 )
Altitude (km)
a
0.00 0.04 0.08
0
2
4
6
8
M. drop (gkg−1 ) b
0.00 0.03 0.06
0
2
4
6
8
L. drop (gkg−1 ) c
0.0 1.0 2.0 3.0
0
2
4
6
8
Graupel (gkg−1 ) d
0 1 2 3 4
0
2
4
6
8
Graupel (litre−1 )
M1 M2 M3 M4 M5 M6 M7
e
Fig. 13.Drop masses at the cloud centre for(a)small drops
(diam-eter<50 µm), (b) medium-drops (50 µm<diameter<1000 µm),
and(c)large drops (diameter>1000 µm), Also shown are(d)mean
graupel specific mass, and (e) graupel number concentration at
20 min from TP-v2. See text for definitions. The mass and con-centration of graupel are averaged over grid points where there is graupel.
Figures 13–15 show how the relative contributions of warm rain and melted graupel to precipitation change dur-ing the cloud evolution (again for the TP-v2-aerM1 simula-tion). At 20 min (the onset of precipitation) warm rain dom-inates in the low aerosol clouds (note the abundance of large drops from 2–4 km) but there is a clear suppression of these large drops as the aerosol loading increases (Fig. 13). At this time, the total drop mass at the melting level (∼4 km) is much greater than the total graupel mass. At 25 min (Fig. 14) medium-sized and large drops reach the ground. At this time, graupel particles are also falling below the melting level and contribute to the precipitation. Therefore, the precipitation comes from both warm rain and mixed-phase processes, with warm rain contributing more. As at 20 min, clouds with lower aerosol loading have larger drop masses and a larger contribution from warm rain. At 30 min (Fig. 15) the masses of medium-sized and large drops vary with aerosol loading in an opposite way to 20 and 25 min: drop masses are greater at higher aerosol loadings below 2 km (Fig. 15b–c). The grau-pel mass shows the same trend below 4 km (Fig. 15d). Thus at 30 min the precipitation becomes dominated by melted graupel particles and the dependence of precipitation rate on aerosol reverses.
0.0 0.2 0.4 0.6 0 2 4 6 8
S. drop (gkg−1 )
Altitude (km)
a
0.00 0.02 0.04
0
2
4
6
8
M. drop (gkg−1 ) b
0.000 0.015 0.030
0
2
4
6
8
L. drop (gkg−1 ) c
0.0 1.0 2.0 3.0
0
2
4
6
8
Graupel (gkg−1 ) d
0 1 2 3 4 5
0
2
4
6
8
Graupel (litre−1 ) M1 M2 M3 M4 M5 M6 M7 e
Fig. 14.As Fig. 13, but at 25 min.
0.0 0.2 0.4 0.6
0
2
4
6
8
S. drop (gkg−1)
Altitude (km)
a
0.00 0.02 0.04
0
2
4
6
8
M. drop (gkg−1) b
0.00 0.02 0.04
0
2
4
6
8
L. drop (gkg−1) c
0.0 0.6 1.2
0
2
4
6
8
Graupel (gkg−1) d
0.0 1.0 2.0 3.0
0
2
4
6
8
Graupel (litre−1 ) M1 M2 M3 M4 M5 M6 M7 e
Fig. 15.As Fig. 13, but at 30 min.
the ratio of melt water to rainfall increases significantly as aerosol load (and drop number) increases. Interestingly, in the least intense cloud (TP-v1) there is no contribution to precipitation from mixed phase processes yet the response of precipitation to aerosol is strikingly similar to the more in-tense simulations in which mixed-phase precipitation occurs. For TP-v2, it is similar to the correlation coefficient.
The explanation for these different responses of marine and continental clouds lies with the importance of warm rain formation in the marine clouds, where the low cloud base height and high freezing level provide enough depth for warm rain to operate. The strong warm rain process in low aerosol cases reduces the amount of liquid water pass-ing above the freezpass-ing level (and therefore immersion freez-ing rates) higher in the cloud. The smaller number of large frozen drops in these low aerosol clouds in turn reduces the rate of riming. Khain et al. (2008) also proposed to use the freezing level height to classify the impact of aerosol on sur-face precipitation.
Table 4.Ratio of accumulated melt water to accumulated precipita-tion (%) at the time of peak precipitaprecipita-tion intensity for tropical marin simulations. Values greater than 100% indicate that a greater mass of melt water has been produced in the cloud than has reached the surface as precipitation.
Simulations M1 M2 M3 M4 M5 M6 M7
TP-v1 0.0 0.0 0.0 0.0 0.0 0.0 0.0
TP-v2 0.046 0.37 0.44 0.57 1.23 2.40 5.70
TP-v3 0.40 0.61 0.67 0.76 0.91 1.40 3.69
These simulations of continental and marine clouds (TX-v2 and TP-(TX-v2) show how the glaciation process responds in opposite ways to changes in aerosol. In the continental clouds there is very little warm rain and substantial water penetration to high cloud levels. The effect of higher aerosol loading is to suppress the immersion freezing and subsequent riming process. In the marine tropical clouds warm rain is ac-tive and reduces water penetration to high cloud levels, but the warm rain is suppressed at high aerosol loading, so more water reaches higher levels and freezes through the immer-sion process. The enhanced riming leads to more melt wa-ter below the freezing level and more precipitation on the ground.
5 Summary and discussion
We have used a detailed microphysics model to study the response of mixed phase convective clouds to changes in aerosol. Our objective has been to quantify cloud response over a wide range of thermodynamic conditions and for aerosol ranging between marine (with very low drop concen-trations) and extreme continental (with very high drop con-centrations).
We have found that the microphysical and dynamical re-sponses are substantially different in marine and continental environments, but that within each of these environments the nature of the response is broadly the same for a wide range of thermodynamic conditions.
We studied 9 different continental conditions (3 locations and 3 different initializing warm bubbles each) for 8 different aerosol loadings (producing cloud base droplet concentra-tions between 50 and 1850 cm−3). For tropical marine
con-ditions we simulated clouds with 3 intensities and 7 aerosol loadings.
We conclude: In continental clouds, there are optimal aerosol concentrations at which the accumulated precipita-tion peaks. The corresponding optimal values of cloud drop concentration at cloud base are between 180 and 430 cm−3
melting of graupel particles. The growth rate of a graupel particle is proportional to the difference in the terminal ve-locities of the graupel and the drop, the swept volume of the falling graupel, and the number of collectible drops per unit volume of cloud. High aerosol loadings result in a larger con-centration of smaller drops which undergo less rapid immer-sion freezing and produce smaller graupel particles through freezing. Small graupel particles have a small swept-out vol-ume and a low value of the collision kernel, so the growth of graupel is suppressed. With low aerosol loadings, the con-tinental clouds produce less numerous but larger drops and larger graupel particles through immersion freezing, which are more efficient to rime. However, the concentration of collectible drops is low, so riming is again suppressed. At in-termediate drop concentrations and sizes, the moderate rim-ing growth rate and reasonably high drop concentration are optimum for the formation, growth of large graupel particles and maximum amount of rain when melted.
The response of tropical marine clouds to increasing aerosol is different to, and larger than, that of continental clouds. In the more humid tropical marine environment, with low cloud bases we find that accumulated precipitation in-creases with increasing aerosol, an opposite response to con-tinental clouds. The increase is driven by the transition from warm to mixed-phase rain. Peak precipitation intensities tend to increase with aerosol up to drop concentrations (at cloud base) of ∼500 cm−3 then decrease with further aerosol
in-creases. This behaviour is caused by the initial transition from warm to mixed-phase rain followed by reduced effi-ciency of mixed-phase rain at very high drop concentrations. This transition to mixed-phase rain shows very clearly in the budget of rainwater derived from melted particles.
The changes in cloud properties caused by changes in aerosol were compared with changes caused by location and imposed cloud intensity (broadly termed here cloud thermo-dynamics). The peak precipitation intensity is much more sensitive to changes in cloud thermodynamics than even very large changes in aerosol. We also find that the thermody-namic contrast between the tropical marine region and the continental regions has a much larger influence on precipita-tion intensity and accumulated rain than any of the changes in aerosol we imposed. But the response of the marine clouds themselves to changes in aerosol is as large as that due to changes in thermodynamics of the marine regions.
In general, the sensitivity of accumulated precipitation, peak precipitation rate and peak ice mass to aerosol tends to be greater in the less vigorous clouds. This holds for the con-tinental clouds we have simulated, but the smaller number of marine cloud simulations limits what we can conclude.
A major source of uncertainty in our understanding of the microphysics of mixed-phase clouds is the heterogeneous formation of ice. Initial formation of ice via the volume-dependent immersion freezing parameterisation (Bigg, 1953) is crucial in determining the intensity, timing and quantity of precipitation produced from continental convective clouds.
Recent efforts are towards new ice nucleation schemes (e.g., Diehl and Wurzler, 2004; Khvorostyanov and Curry, 2004; Phillips et al., 2008). An exploration of the sensitivity of the impact of aerosol variations on convective clouds to the model ice microphysics parameterisations is beyond the scope of this paper. The latest review by Stevens and Fein-gold (2009) indicated that clouds react to aerosols in a very complex way and the reaction is strongly dependent on the type and state of the cloud. The aerosol impact on cloud and precipitation in the context of climate change has much to do in the future.
The use of the axi-symmetric model imposes limitations on the generality of the results, as with any study. The ef-fect of the vertical shear of the horizontal wind is the most obvious. For example, Weisman and Klemp (1986) dis-cussed how wind shears and buoyancy can be used to esti-mate storm type and storm lifetime. Jorgensen and Weck-werth (2003) showed convection as a function of shear and convective available potential energy for individual convec-tive storms and mesoscale convecconvec-tive systems. In weak wind shear environments, convection tends to produce single cells rather than long-lasting severe storms. In reality, convective clouds occur under low wind shear conditions (e.g., Wilson and Megenhardt, 1997; Ahijevych et al., 2000; Tompkins, 2001; Rangno and Hobbs, 2005; Steiger et al., 2009). Our simulations only investigate the response of the microphysi-cal processes to aerosol without wind shear. Our results can-not be generalized to severe storms.
Asymmetric features in and around clouds may develop in a 3-D model with wind shear even if the initial perturbation is symmetric (Khain and Lynn, 2009). For example, cloud par-ticle size sorting results from wind shear, which could affect the interaction between drops and ice particles. Other obser-vations found that there is no direct evidence of size sorting in some cases (e.g., Szumowski et al., 1998). Nevertheless, the asymmetric features cannot be captured with our axisym-metric model. Lopez et al. (2009) performed 3-D simulations and found that shear is not capable of creating realistic anvil clouds, unless they also modify the cloud physics. Their re-sults indicate that cloud physics is not less important than wind shear.
We have been aware that further model improvements are required. As a next step in the future, we will conduct sim-ulations with wind shear with a new large eddy simulation model with the bin-resolved cloud microphysics.
Acknowledgements. The work was funded by the Natural
Environ-ment Research Council, UK.
References
Ahijevych, D. A., Rutledge, S. A., and Carey, L. D.: Radar and electrical characteristics of convection observed during MCTEX, Aust. Meteorol. Mag., 49, 165–180, 2000.
Alpert, P., Halfon, N., and Levin, Z.: Does pollution really suppress precipitation in Israel?, J. Appl. Meteorol. and Climat., 47, 933– 943, 2008.
Andreae, M. O., Rosenfeld, D., Artaxo, P., Costa, A. A., Frank, G. P., Longo, K. M., and Silva-Dias, M. A. F.: Smoking rain clouds over the Amazon, Science, 303, 1337–1342, 2004.
Bell, T. L., Rosenfeld, D., Kim, K.-M., Yoo, J.-M., Lee, M.-I., and Hahnenberger, M.: Midweek increase in US summer rain and storm heights suggests air pollution invigorates rainstorms, J. Geophys. Res., 113, D02209, doi:10.1029/2007JD008623, 2008. Bigg, E. K.: The formation of atmospheric ice crystals by the
freez-ing of droplets, Q. J. Roy. Meteor. Soc., 79, 510–519, 1953. Blyth, A. M. and Latham, J.: Development of ice and precipitation
in New Mexican summertime cumulus clouds, Q. J. Roy. Meteor. Soc., 119, 91–120, 1993.
Blyth, A. M. and Latham, J.: A multi-thermal model of cumulus glaciation via the Hallett-Mossop process, Q. J. Roy. Meteor. Soc., 123, 1185–1198, 1997.
Chen, J.-P., Liu, S.-C., Hsu, C.-J., Hazra, A., and Tang, P.-Y.: Rain Intensity Spectral Shift: An Aerosol Effect? The 15th Interna-tional Conferenc e on Clouds and Precipitation, 7–11 July 2008, Cancn, Mexico, 2008.
Cooper, A. C., Bruintjes, R. T., and Mather, G. K.: Calculation Per-taining to Hygroscopic Seeding with Flares, J. Appl. Meteorol., 36, 1449–1469, 1997.
Cotton, W. R., Tripoli, G. J., Rauber, R. M., and Mulvihill, E. A.: Numerical simulation of the effects of varying ice crystal nucle-ation rates and aggregnucle-ation processes on orographic snowfall, J. Climate Appl. Meteor., 25, 1658–1680, 1986.
Cui, Z. and Carslaw, K. S.: Enhanced vertical transport effi-ciency of aerosol in convective clouds due to increases in tro-pospheric aerosol abundance, J. Geophys. Res., 111, D15212, doi:10.1029/2005JD006781, 2006.
Cui, Z., Carslaw, K. S., Yin, Y., and Davies, S.: A numerical study of aerosol effects on the dynamics and microphysics of a deep convective cloud in a continental environment, J. Geophys. Res., 111, D05201, doi:10.1029/2005JD005981, 2006.
Devine, G. M., Carslaw, K. S., Parker, D. J., and Petch, J. C.: The influence of subgrid surface-layer variability on vertical trans-port of a chemical species in a convective environment, Geophys. Res. Lett., 33, L15807, doi:10.1029/2006GL025986, 2006. Diehl, K. and Wurtzler, S.: Heterogeneous drop freezing in the
immersion mode: Model calculations considering soluble and insoluble particles in the drop, J. Atmos. Sci., 61, 2063–2072, 2004.
Ekman, A. M. L., Engtrom, A., and Wang, C.: The effect of aerosol composition and concentration on the development and anvil properties of a deep convective cloud, Q. J. Roy. Meteor. Soc., 133, 1439–1452, 2007.
Fan, J., Zhang, R., Li, G., and Tao, W.-K.: Effects of aerosols and relative humidity on cumulus clouds, J. Geophys. Res., 112, D14204, doi:10.1029/2006JD008136, 2007.
Freud, E., Rosenfeld, D., Andreae, M. O., Costa, A. A., and Ar-taxo, P.: Robust relations between CCN and the vertical evolu-tion of cloud drop size distribuevolu-tion in deep convective clouds,
At-mos. Chem. Phys., 8, 1661–1675, doi:10.5194/acp-8-1661-2008, 2008.
Givati, A. and Rosenfeld, D.: Quantifying precipitation suppression due to air pollution, J. Appl. Meteorol., 43, 1038–1056, 2004. Hallett, J. and Mossop, S. C.: Production of secondary ice particles
during the riming process, Nature, 249, 26–28, 1974.
Hobbs, P. V., Bowdle, D. A., and Radke, L. F.: Particles in the lower troposphere over the high plains of the United States. Part I: Size distributions, elemental composition and morphologies, J. Clim. Appl. Meteorol., 24, 1344–1356, 1985.
Huang, H., Blyth, A., Brown, P. R. A., Choularton, T., Connolly, P., Gadian, A., Jones, H., Latham, J., Cui, Z., and Carslaw, K.: The development of ice in a cumulus cloud over South-west England, New J. Phys., 10, 105021, doi:10.1088/1367-2630/10/10/105021, 2008.
Huang, H., Blyth, A., Brown, P. R. A., Cotton, R., Crosier, J., Bower, K. N., Gallagher, M. W., Jones, H., Gadian, A. M., Choularton, T. W., Cardwell, J., Coe, H., Mobbs, S. D., and Ha-gen, M.: Development of ice particles in convective clouds ob-served over the Black Forest mountains during COPS, Q. J. Roy. Meteorol. Soc., 137, 275–286, 2011.
IPCC (Intergovernmental Panel on Climate Change): Climate
Change 2007, in: The Physical Science Basis, Contribution of Working Group I to the Fourth Assessment Report of the Inter-governmental Panel on Climate Change, edited by: Solomon, S., Qin, D., Manning, M., Chen, Z., Marquis, M., Averyt, K. B., Tig-nor, M., and Miller H. L., ISBN 978 0521 88009-1, Cambridge University Press, Cambridge, United Kingdom and New York, NY, USA, 996 pp., 2007.
Johnson, D. B.: The role of giant and ultragiant aerosol particles in warm rain initiation, J. Atmos. Sci., 39, 448–460, 1982. Jorgensen, D. P. and Weckwerth, T. M.: Forcing and organization
of convective systems. In Radar and Atmospheric Science: A Collection of Essays in Honour of David Atlas. Meteor. Monogr., No. 52, Amer. Meteor. Soc., 75–113, 2003.
Khain, A. and Lynn, B.: Simulation of a supercell storm in clean and dirty atmosphere using weather research and forecasting model with spectral bin microphysics, J. Geophys. Res., 114, D19209, doi:10.1029/2009JD011827, 2009.
Khain, A., Rosenfeld, D., and Pokrovsky, A.: Aerosol impact on the dynamics and microphysics of deep convective clouds, Q. J. Roy. Meteorol. Soc., 131, 2639–2663, 2005.
Khain, A. P., BenMoshe, N., and Pokrovsky, A.: Factors determin-ing the impact of aerosols on surface precipitation from clouds: an attempt at classification, J. Atmos. Sci., 65, 1721–1748, 2008. Khvorostyanov, V. I. and Curry, J. A.: The theory of ice nucleation by heterogeneous freezing of deliquescent mixed CCN, Part 1: critical radius, energy and nucleation rate, J. Atmos. Sci., 61, 2676–2691, 2004.
Koren I., Kaufman, Y. J., Rosenfeld, D., Remer, L. A., and
Rudich, Y.: Aerosol invigoration and restructuring of
At-lantic convective clouds, Geophys. Res. Lett., 32, L14828, doi:10.1029/2005GL023187, 2005.
Langmann, B.: A model study of the smoke-haze influence
on clouds and warm precipitation formation in Indonesia 1997/1998, Atmos. Environ., 41, 6838–6852, 2007.
D16202, doi:10.1029/2007JD009224, 2008.
Levin, Z. and Cotton, W. R.(eds.): Aerosol Pollution Impact on Pre-cipitation: A Scientific Review, Springer Press, 382 pp., 2009. Lin, J. C., Matsui, T., Pielke Sr., R. A., and Kummerow, C.: Effects
of biomass burning-derived aerosols on precipitation and clouds in the Amazon Basin: a satellite based empirical study, J. Geo-phys. Res., 111, D19204, doi:10.1029/2005JD006884, 2006. Lopez, M. A., Hartmann, D. L., Blossey, P. N., Wood, R.,
Brether-ton, C. S., and Kubar, T. L.: A Test of the Simulation of Tropical Convective Cloudiness by a Cloud-Resolving Model. J. Climate, 22, 2834–2849, 2009.
Moncrieff, M. W., Krueger, S. K., Gregory, D., Redelsperger, J.-L., and Tao, W.-K.: GEWEX Cloud System Study (GCSS) Working Group 4: Precipitating convective cloud systems, B. Am. Mete-orol. Soc., 78, 831–845, 1997.
Meyers, M. P., DeMott, P. J., and Cotton, W. R.: New primary ice-nucleation paramererizations in an explicit cloud model, J. Appl. Meteorol., 31, 708–721, 1992.
Orville, R. E., Huffines, G. R., Nielsen-Gammon, J., Zhang, R., Ely, B., Steiger, S., Phillips, S., Allen, S., and Read, W.: En-hancement of cloud-to-ground lightning activity over Houston, Texas, Geophys. Res. Lett., 28, 2597–2600, 2001.
Phillips, V. T. J., Choularton, T., Blyth, A. M., and Latham, J.: The influence of aerosol concentrations on the glaciation and precipi-tation of a cumulus cloud, Q. J. Roy. Meteor. Soc., 128, 951–971, 2002.
Phillips, V. T. J., DeMott, P., and Andronache, C.: An Empirical Parameterization of Heterogeneous Ice Nucleation for Multiple Chemical Species of Aerosol, J. Atmos Sci., 65, 2757–2783, 2008.
Rangno, A. L. and Hobbs, P. V.: Microstructures and precipitation development in cumulus and small cumulonimbus clouds over the warm pool of the tropical Pacific Ocean, Q. J. Roy. Meteor. Soc., 131, 639–673, 2005.
Reisin, T., Levin, Z., and Tzivion, S.: Rain production in convective clouds as simulated in an axisymmetric model with detailed mi-crophysics, Part I: Description of the model, J. Atmos. Sci., 53, 497–519, 1996a.
Reisin, T., Levin, Z., and Tzivion, S.: Rain production in convec-tive clouds as simulated in an axisymmetric model with detailed microphysics, Part II: Effects of varying drops and ice initiation, J. Atmos. Sci., 53, 1815–1837, 1996b.
Rosenfeld, D. and Ulbrich, C. W.: Cloud microphysical proper-ties, processes, and rainfall estimation opportuniproper-ties, Meteorol. Monogr., 52, 237–258, 2003.
Rosenfeld, D. and Woodley, W. L.: Deep convective clouds with
sustained supercooled liquid water down to 37.5◦C, Nature, 405,
440–442, 2000.
Rosenfeld, D., Rudich, Y., and Lahav, R.: Desert dust suppressing precipitation – a possible desertification feedback loop, P. Natl. Acad. Sci., 98, 5975–5980, 2001.
Rosenfeld, D., Lohmann, U., Raga, G. B., O’Dowd, C. D., Kul-mala, M., Fuzzi, S., Reissell, A., and Andreae, M. O.: Flood or drought: How do aerosols affect precipitation?, Science, 321, 1309–1313, 2008.
Respondek, P. S., Alheit, R. R., and Pruppacher, H. R.: A theo-retical study of the wet removal of atmospheric pollutants, V,
The uptake, redistribution, and deposition of (NH4)2SO4by a
convective cloud containing ice, J. Atmos. Sci., 52, 2121–2132,
1995.
Rotstayn, L., Cai, W., Dix, M., Farquhar, G., Feng, Y., Ginoux, P., Herzog, M., Ito, A., Penner, J., Roderick, M., and Wang, M.: Have Australian rainfall and cloudiness increased due to the re-mote effects of Asian anthropogenic aerosols?, J. Geophys. Res., 112, D09202, doi:10.1029/2006JD007712, 2007.
Seifert, A. and Beheng, K. D.: A two-moment cloud micro-physics parameterization for mixed-phase clouds, Part II : Mar-itime vs. continental deep convective storms, Meteorol. Atmos. Phys., 92, 67–82, 2005.
Spracklen, D. V., Pringle, K. J., Carslaw, K. S., Chipperfield, M. P., and Mann, G. W.: A global off-line model of size-resolved aerosol microphysics: I. Model development and pre-diction of aerosol properties, Atmos. Chem. Phys., 5, 2227– 2252, doi:10.5194/acp-5-2227-2005, 2005.
Spracklen, D. V., Pringle, K. J., Carslaw, K. S., Mann, G. W., Manktelow, P., and Heintzenberg, J.: Evaluation of a global aerosol microphysics model against size-resolved particle statis-tics in the marine atmosphere, Atmos. Chem. Phys., 7, 2073– 2090, doi:10.5194/acp-7-2073-2007, 2007.
Steiger, S. M., Hamilton, R., Keeler, J., and Orville, R. E.: Lake-Effect Thunderstorms in the Lower Great Lakes, J. Applied Me-teorol. Clim., 48, 889–902, 2009.
Stevens, B. and Feingold, G.: Untangling aerosol effects on clouds and precipitation in a buffered system, Nature, 461, 607–613, doi:10.1038/nature08281, 2009.
Sullivan, R. C., Petters, M. D., DeMott, P. J., Kreidenweis, S. M., Wex, H., Niedermeier, D., Hartmann, S., Clauss, T., Stratmann, F., Reitz, P., Schneider, J., and Sierau, B.: Irreversible loss of ice nucleation active sites in mineral dust particles caused by sulphuric acid condensation, Atmos. Chem. Phys., 10, 11471– 11487, doi:10.5194/acp-10-11471-2010, 2010.
Szumowski, M. J., Rauber, R. M., Ochs, H. T., Beard, K. V.: The Microphysical Structure and Evolution of Hawaiian Rainband Clouds. Part II: Aircraft Measurements within Rainbands Con-taining High Reflectivity Cores, J. Atmos. Sci., 55, 208–226, 1998.
Teller, A. and Levin, Z.: The effects of aerosols on precipitation and dimensions of subtropical clouds: a sensitivity study us-ing a numerical cloud model, Atmos. Chem. Phys., 6, 67–80, doi:10.5194/acp-6-67-2006, 2006.
Tompkins, A. M.: Organization of tropical convection in low ver-tical wind shears: The role of water vapor, J. Atmos. Sci., 58, 529–545, 2001.
Tzivion, S. H., Reisin, T., and Levin, Z.: Numerical simulation of hygroscopic seeding in a convective cloud, J. Appl. Meteorol., 33, 252–267, 1994.
Weisman, M. L. and Klemp, J. B.: Characteristics of isolated con-vective storms. Mesoscale Meteorology and Forecasting, P. S. Ray, Ed., Amer. Meteor. Soc., 331–358, 1986.
doi:10.1029/2001JD000380, 2002.
Wilson, J. W. and Megenhardt, D. L.: Thunderstorm Initiation, Organization, and Lifetime Associated with Florida Boundary Layer Convergence Lines, Mon. Weather. Rev., 125, 1507–1525, 1997.
Yin, Y. and Chen, L.: The effects of heating by transported dust lay-ers on cloud and precipitation: a numerical study, Atmos. Chem. Phys., 7, 3497–3505, doi:10.5194/acp-7-3497-2007, 2007. Yin, Y., Levin, Z., Reisin, T., and Tzivion, S.: The effects of giant
cloud condensational nuclei on the development of precipitation in convective clouds: a numerical study, Atmos. Res., 53, 91– 116, 2000.
Yin, Y., Carslaw, K. S., and Parker, D. J.: Redistribution of trace gases by convective clouds – mixed-phase processes, Atmos. Chem. Phys., 2, 293–306, doi:10.5194/acp-2-293-2002, 2002. Yin, Y., Carslaw, K. S., and Feingold, G.: Vertical transport and
processing of aerosols in a mixed-phase convective cloud and the feedback on cloud development, Q. J. Roy. Meteor. Soc., 131, 221–245, 2005.