FUNDAÇÃO GETULIO VARGAS
ESCOLA DE ADMINISTRAÇÃO DE EMPRESAS DE SÃO PAULO
OCTAVE SERGE CHRISTIAN MARIE LAPEYRONIE
THE BRAZILIAN REAL ESTATE MARKET IN 2012: ROBUST GROWTH OR SPECULATIVE BUBBLE?
2 OCTAVE SERGE CHRISTIAN MARIE LAPEYRONIE
THE BRAZILIAN REAL ESTATE MARKET IN 2012: ROBUST GROWTH OR SPECULATIVE BUBBLE?
SÃO PAULO 2012
Dissertação apresentada à Escola de Administração de Empresas de São Paulo da Fundação Getulio Vargas como requisito para obtenção do título de Mestre Profissional em Gestão Internacional
Campo do conhecimento:
GESTÃO E COMPETITIVIDADE EM EMPRESAS GLOBAIS
3
Lapeyronie, Octave Serge Christian Marie.
The brazilian real state market in 2012: robust growth or speculative bubble? / Octave Serge Christian Marie Lapeyronie. - 2012.
78 f.
Orientador: Tales Adreassi
Dissertação (MPGI) - Escola de Administração de Empresas de São Paulo.
1. Mercado imobiliário - Brasil. 2. Bens imóveis - Preços. 3. Investimentos imobiliários - Brasil. I. Andreassi, Tales. II. Dissertação (MPGI) - Escola de Administração de Empresas de São Paulo. III. Título.
4 OCTAVE SERGE CHRISTIAN MARIE LAPEYRONIE
THE BRAZILIAN REAL ESTATE MARKET IN 2012: ROBUST GROWTH OR SPECULATIVE BUBBLE?
Dissertação apresentada à Escola de
Administração de Empresas de São Paulo da Fundação Getulio Vargas como requisito para obtenção do título de Mestre
Profissional em Gestão Internacional
Campo do conhecimento: GESTÃO E COMPETITIVIDADE EM EMPRESAS GLOBAIS
Data de aprovação:
06 / 12 / 2012
Banca Examinadora:
___________________________
Prof. Dr. Tales Andreassi
___________________________
Prof. Dr. William Eid Junior
___________________________
5 ABSTRACT
Rising home prices in Brazil have sparked debate on a possible housing bubble. In light of the credit and housing crisis in the United States, it is fair to question whether or not Brazil’s situation is analogous. Looking at both quantitative and fundamental arguments, we examine the context of the Brazilian housing boom and question its sustainability in the near term. First, home prices tested with basic rental yields and affordability ratios as well an imputed rent model to assess their relative to equilibrium levels. Second, we examine some fundamental factors affecting housing prices – supply and demand, credit and regulation, cultural factors – to find evidence justifying the rising home prices. From these observations, we attempt to draw rational inferences on the likely near future evolution of the Brazilian housing market. While data suggests that home prices are overvalued in comparison to rent levels, there is an evidence of legitimate new housing demand in the rising middle class. A more serious risk may lie in the credit markets in that the Brazilian consumer is already highly leveraged. Nevertheless, we find no evidence suggesting more than a temporary slowdown or correction of home prices.
6 RESUMO
A forte alta dos imóveis no Brasil nos últimos anos iniciou um debate sobre a possível existência de uma bolha especulativa. Dada a recente crise do crédito nos Estados Unidos, é factível questionar se a situação atual no Brasil pode ser comparada à crise americana. Considerando argumentos quantitativos e fundamentais, examina-se o contexto imobiliário brasileiro e questiona-se a sustentabilidade em um futuro próximo. Primeiramente, analisou-se a taxa de aluguel e o nível de acesso aos imóveis e também utilizou-se um modelo do custo real para ver se o mercado está em equilíbrio o não. Depois examinou-se alguns fatores fundamentais que afetam o preço dos imóveis – oferta e demanda, crédito e regulação, fatores culturais – para encontrar evidências que justificam o aumento dos preços dos imóveis. A partir dessas observações tentou-se chegar a uma conclusão sobre a evolução dos preços no mercado imobiliário brasileiro. Enquanto os dados sugerem que os preços dos imóveis estão supervalorizados em comparação ao preço dos aluguéis, há evidências de uma legítima demanda por novos imóveis na emergente classe média brasileira. Um risco maior pode estar no mercado de crédito, altamente alavancado em relação ao consumidor brasileiro. No entanto, não se encontrou evidências que sugerem mais do que uma temporária estabilização ou correção no preço dos imóveis.
7 TABLE OF FIGURES AND TABLES
Figure 1 - The Stages of a Bubble (Rodrigue, 2008) ... 21
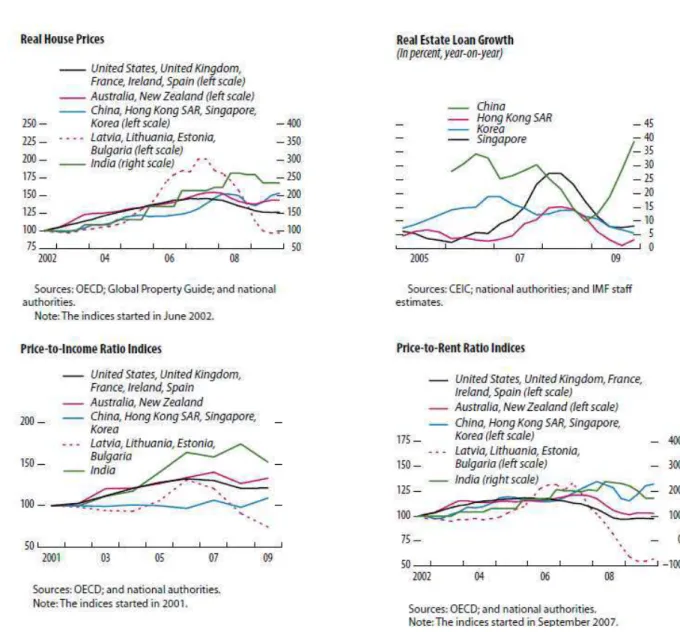
Figure 2 - IMF GFSR Real Estate Indicators (International Monetary Fund, 2010) ... 22
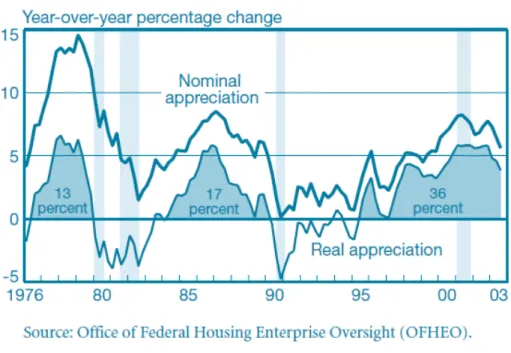
Figure 3 - Real Home Price Appreciation in the US (McCarthy & Peach, 2004) ... 23
Figure 4 - Housing Price Ratios (Himmelberg, Mayer, & Sinai, 2005) ... 24
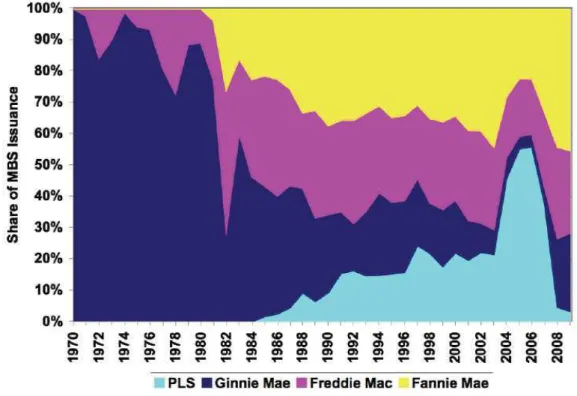
Figure 5 - Share of MBS issuance by securitization type (Levitin & Wachter, 2010) ... 29
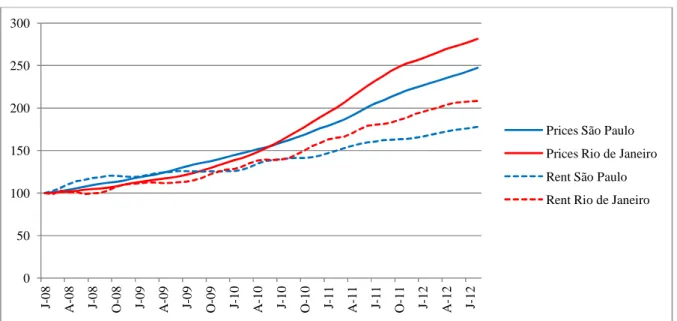
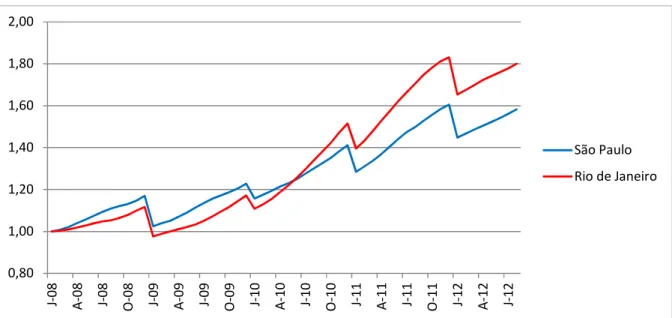
Figure 6 - Home-price index for São Paulo and Rio de Janeiro (base 100 in January 2008), Source: Fipezap ... 35
Figure 7 - Rental yield for São Paulo and Rio de Janeiro (Price/Yearly Rent), Source: Fipezap .. 36
Figure 8 - Price-income ratio using household spending (normalized to January 2008), Source: Fipezap, IBGE ... 37
Figure 9 - Model "imputed rent" versus rental yields, Source: Fipezap, IBGE ... 41
Figure 10 - Implied and actual growth rate in São Paulo and Rio de Janeiro ... 43
Figure 11 - Breakdown of housing deficit by income (number of minimum wages earned) (Fundação João Pinheiro, 2011), Source: FJP ... 49
Figure 12 - Construction in Brazil since 2006 in billions BRL (Barbosa, 2011) ... 51
Figure 13 – Cumulative 12 month housing starts vs. sales since 2004 in São Paulo (SECOVI-SP, 2012) ... 53
Figure 14 - Real Estate credit in Brazil as % of GDP (Banco Central do Brasil, 2012), Source: BACEN ... 54
8 Figure 16 - SBPE saving and real estate financing projections (Barbosa, 2011), Source: ABECIP
... 57
Figure 17 - Progression of average LTV ratios in Brazil (SECOVI-SP, 2012), Source: ABECIP 59 Figure 18 - Credit as a percentage of Brazilian GDP (Banco Central do Brasil, 2011)... 61
Figure 19 - Total Credit as a % of GDP (Badkar, 2012) ... 61
Figure 20 - CRIs issued in Brazil in R$ millions (Uqbar, 2011) ... 62
Figure 21 - Real Estate Financing in Brazil by Source (Banco Central do Brasil, 2012) ... 63
Figure 22 - Deceleration of Brazilian Housing Market (Dana, Desaceleração do Mercado Imobiliário, 2012) ... 67
9 TABLE OF CONTENTS
1. Introduction ... 11
2. Literature Review ... 15
2.1 On asset bubbles ... 15
2.1.1 The definition of a bubble ... 15
2.1.2 Why real estate markets are particularly prone to speculative bubbles ... 17
2.2 Identifying housing bubbles ... 18
2.2.1 The stages of a bubble ... 19
2.2.2 Basic Analysis: prices and ratios ... 21
2.2.3 More sophisticated tests ... 25
2.3 The role of credit and mortgage securitization ... 26
2.3.1 The role of mortgage securitization in the US housing bubble ... 27
3. Methodology ... 30
3.1 Approach ... 30
3.2 Data sources ... 30
4. Analysis ... 33
4.1 Quantitative Approach ... 33
4.1.1 Basic Analysis ... 33
10
4.2 Fundemental Approach ... 46
4.2.1 Supply and demand ... 47
4.2.2 Housing credit and regulation ... 54
4.2.3 Cultural factors ... 65
4.2.4 Speculation ... 66
4.2.5 Joint consideration of all factors ... 67
5. Conclusion ... 69
11
1.
Introduction
In recent years, the value of real estate in Brazil has soared at an astounding rate. Since 2008, as far as Brazil’s sole public housing index1 allows us to look back, prices in Rio de Janeiro and São Paulo have grown at respective compound average rates of 24% and 21% per annum. At a
national level, the increase in value is no less impressive. The national composite index, recorded since August 2010, shows an average growth of 22%per annum. In recent history however, growth rates of this magnitude have only been observed in the Japan and the United States housing bubbles of the late 1980s and early 2000s, respectively. It therefore seems fair to question the sustainability of the Brazilian housing boom. Indeed, despite the many differences between Brazil and these two countries, one can reasonably fear that the current situation might result similarly. Experts in the field and government officials have argued both in favor of and against this hypothesis, with some compelling arguments, making the equation harder yet to solve. While it is difficult to believe that such strong growth could be sustainable even in the short run, it must be recognized that the Brazilian economy and financial system are vastly different than their North American counterparts. Drawing a syllogism from these two potentially analogous situations is tempting but further analysis is needed to draw any conclusions.
Current investment opportunities in Brazil are plentiful, making it a prized destination for foreign capital. Parsing through the different investment options however is difficult, particularly to non-Brazilian investors. I personally have wondered what would be the ideal investment to capture high growth rates. By far, real estate the most appealing sector: it is rather liquid, available to private, individual investors and has outperformed the BOVESPA index significantly2 since 2008. Nevertheless, given the recent economic history and applying standard principles of
1 FipeZap
12 investor prudence, it seems crucial to first understand the intricacies of the Brazilian real estate market, so as not to become the “greater fool”.
The objective of this paper is therefore to reach a greater level of understanding of the Brazilian housing market and to attempt to make sense of the recent growth rates in order to better
conjecture on what its future evolution might be.
Reaching this objective implies answering the following research question: is the housing boom aligned with current, fundamental economic factors?
A first obvious challenge to answering this question is the overwhelming lack of data on
Brazilian real estate. Fipezap, the only public – local and national – housing index is both recent and flawed. Its data lacks the reliability and the hindsight that we need to reach robust answers to our question. Conversely, entirely discounting the value of this data seems unreasonable. The most thorough approach therefore implies taking advantage of the data but not entirely relying upon it. In an attempt to provide the best possible answers to our research question, the thesis will be structured in the following manner. After a literature review, a first quantitative analysis will seek to confirm the existence of a problem, using the limited data available to us. The second part of the analysis will seek to make sense of the results of the quantitative test by studying the fundamental factors that affect the Brazilian housing market. Precisely, the various steps of the thesis will be the following.
13 United States housing crisis of 2007 and understand what provoked them. In particular, it will be important to understand the roles that may have played credit and mortgage markets in the crash. While it may seem unreasonable to focus only on this single housing bubble to draw conclusions on Brazil, it is also the most recent and documented example of the phenomenon. The
imperfection of this analogy will certainly be considered in mitigating our conclusions
After consideration of the academic material detailed in the literature review, we will be able to address the core of the issue. A rudimentary quantitative analysis will be performed to provide evidence of the phenomenon followed by a more elaborate one, based on a model utilized by Himmelberg et al. (2005) of the Federal Reserve Bank of New York, in order to determine whether or not the Brazilian real estate market is in equilibrium. Unfortunately, as the data on the Brazilian real estate market is both sparse and shoddy, a quantitative analysis will not suffice to provide robust answers to our research question, nor does it have that ambition. At the very least, the quantitative analysis will be the opportunity to confirm (or not) the existence of a problem.
Having accomplished this, we will attempt to make sense out the observed situation. We will therefore have recourse to a more fundamental approach that will parse through the basic
underlying factors that affect a housing market, such as supply and demand, credit, regulation and cultural factors. It will be important to study how these factors interact and their relative leverage on market real estate prices. Bringing them all together should provide a clearer picture what is provoking the current situation and whether or not it is sustainable.
15
2.
Literature Review
Before attempting to answer the research question, it is imperative to turn to academic references and see what has already been written on the subject. This is important as it will provide some important analysis tools and perhaps some direction for our analysis. First and foremost, we will look at literature on asset bubbles in general and try to understand how they come to form and why real estate markets are often subject to them. Next we will look at the various methods, some basic, some more sophisticated, that have been used to try to detect housing bubbles in the past. Finally, we will look to past bubbles, specifically the United States 2007 housing crisis, and understand the role that credit markets and securitization played in it. Because the topic of this research is very current, there is very little literature, Brazilian or foreign, on the specific housing boom we are studying. Rather, there is a considerable amount of non-academic, economic press, opinion and research available, which will be referred to in our fundamental analysis.
2.1On asset bubbles
Before anything else, it is important to understand how academic literature has defined asset bubbles since the first occurrences in modern economic history. Further, we will look for
explanations for why real estate markets seem to be particularly likely to be subject to bubbles in recent history.
2.1.1 The definition of a bubble
16 to know for sure what dividends an asset will yield in the future (Krainer & Wei, 2004). The subject of price bubbles in the fields of Finance and Economics is usually the cause of much debate, their mystique revolving around the fact that their existence can only really be observed
ex post, i.e. after they have burst. What’s more, a considerable amount of academic attention has
been dedicated to their study, usually with the objective of providing explanations as well as methods of detection, identification and prevention. While many economists have long relegated the study of bubbles to the margins of economic theory, recent events – Dot-com and housing bubbles of the 2000s – have brought the topic back in the spotlight. The study of bubbles is difficult in that their social-psychological nature does not lend itself to the traditional Economics tool bag (Shiller, 2008). The core of the problem remains demonstrating their existence – or non-existence – ex ante, i.e. before the burst.
Joseph Stiglitz provides a general intuition on bubbles in this journal article: “If the reason that the price is high today is only because investors believe that the selling price is high tomorrow – when ‘fundamental’ factors do not seem to justify such a price – then a bubble exists“ (Stiglitz, 1990). In sum, if such a phenomenon occurs, it is at odds with the efficient market theory according to which, the market price of an asset reflects all the publicly available information at that point in time.
cost-17 based prices (Garber, 1990). Regardless of whether or not these events should technically be classified as bubbles, they are the first occurrences in history of organized markets spinning out of control due to speculative behavior.
2.1.2 Why real estate markets are particularly prone to speculative bubbles
Until the 1990s, known real estate bubbles had been rather small, local and the result of speculation on land rather than on construction. In certain settings such as a gold rush for
example, a piece of land could be seen as having the potential to increase in value; the value of a house however was conventionally tied to construction costs. It is only in recent history– in the past few decades – that physical houses have been the target of speculation (Shiller, 2011).
From the mid-1990s to the mid-2000s, global real estate markets boomed at incredible rates. The end result was a violent crash, the magnitude and global reach of which had never before been seen. The epicenter of this collapse was the United States housing market in 2007, coincidentally at the height of the subprime mortgage era. Today still, economists are at odds on exactly what caused real house prices to boom before crashing catastrophically and bringing the American and global financial systems to their knees. Some economists, such as Shiller (2008), cite demand-side factors, suggesting “irrational exuberance” drove the price hike – an expression originally used by Fed Chairman Alan Greenspan to describe the Dot-com bubble. Others, such as Levitin & Wachter (2010), insist that demand-side factors alone cannot explain the crisis and cite excessively easy monetary policy as well as the deterioration of lending standards as the main culprits.
18 the public observes price increases and draws from them expectations of future price increases, thus raising bid prices and synthetically pulling house prices up. Invoking principles of sociology and psychology, Shiller considers these feedback loops that fuel speculative bubbles to be a “social epidemic” which deviate prices from their efficient market equilibriums (Shiller, 2008). Others suggest that consumers are unable to anticipate inflation and cannot discern nominal from real, inflation-adjusted interest rates and therefore not only underestimate the cost of taking a mortgage but overestimate future appreciations of real estate prices (Brunnermeier & Julliard, 2008). Finally, others suggest that certain local real estate markets have inelastic housing supply and thus are prone to more violent price bubbles, whereas markets with elastic demand meet excess demand with new constructions (Glaeser, Gyourko, & Saiz, 2008).
On the supply side, Levitin & Wachter (2010) blame both excessively easy monetary policy – the early 2000s were a period of extremely low interest rates – which led to artificially cheap credit and made it available to less credit-worthy consumers and the lowering of underwriting standards for mortgages. In their eyes, the main culprit in the United States was the private-label mortgage-back securities (MBS) industry, the advent of which was a response to high buy-side demand (see section on mortgage securitization and credit). The overall consequence was new access to credit for borrowers who in turn artificially bid up prices and fueled the housing boom (Levitin & Wachter, 2010).
Both side of the debate make compelling points and it is difficult to discredit one or the other. For the purpose of this paper, it seems appropriate to give credit to both demand- and supply-side explanations for housing booms.
19 When a market is booming and prices soar, it attracts attention and all parties involved want to know if the growth is sustainable or actually a bubble. If it is in fact a bubble, how soon is the selloff likely to occur? Sticking to Stiglitz’s definition, the key question becomes: are real estate prices in line with economic fundamentals? The answer to this question has serious implications. Central banks need to know in order to take measures that mitigate the odds of a bubble forming and bursting. Investors want to know in what stage the boom currently is and if it is the right moment to buy. In fact, there are a number of tools, some basic and some complex to test whether a market is in-line with economic fundamentals as well as academic literature on more complex models.
2.2.1 The stages of a bubble
Rodrigue (2008) of Hofstra University, usually known for his work on Transportation
Geography, drew attention to himself by publishing a model on the different phases that compose a speculative bubble, which he calls “financial mania” (Figure 1). While he argues that each mania is unique, he identifies some similarities. According to him, the first phase of a bubble is the stealth phase, the phase during which “smart” investors detect a potential for substantial, fundamental appreciation of the asset’s value. Original investments are rather small and cautious and often go unnoticed by the general public. With time, as the price of the underlying asset appreciates, investments become larger and larger. The second phase is that of awareness, during which institutional investors notice the asset’s momentum and invest in large volumes, further driving prices up. A small sell-off can be experienced as the early investors might close their positions in order to cash in on realized profits.
20 claims this phase answers rather to psychology than to logic. He makes the same argument
described earlier in Shiller’s views on the public’s irrational expectations of future profit. Investors extrapolate linearly from past price appreciation and tend to consider the investment a “sure bet” on that sole basis. Consequently, new buyers flood the market and the prices soar. Rodrigue makes an important point that if the price bubble coincides with easy access to credit – as was the case with mortgages in the mid-2000s – then the theoretically “unsustainable”
situation last a lot longer than can be rationally expected.
The final phase of the bubble is the burst, or blow-off phase. Rodrigue describes this moment as a “paradigm shift”, a collective epiphany where everyone realizes the change in situation. The sell-off usually violent and prices drop much faster than they went up. Everyone wants to sell and no-one wants to buy; investors are left with quickly depreciating assets. Prices often drop to below initial levels, at which point, the “smart money” is back to snatch up the undervalued assets.
21
Figure 1 - The Stages of a Bubble (Rodrigue, 2008)
2.2.2 Basic Analysis: prices and ratios
Financial institutions, investors and central banks, among others, are keen to keep an eye on real estate markets and try to detect harmful speculative behavior. To do so, some key, basic
indicators are available. In its 2010 Global Financial Stability Report, the IMF takes a look at global real estate markets and use four traditional indicators (Figure 2) to track the rationality of home prices:
• Real house prices (inflation adjusted)
22
Figure 2 - IMF GFSR Real Estate Indicators (International Monetary Fund, 2010)
Real house prices, not to be confused with nominal prices, are quite straight-forwardly average
23
Figure 3 - Real Home Price Appreciation in the US (McCarthy & Peach, 2004)
Price-to-income ratio is a traditional measure the affordability of homes in a particular geography
by relating median real home prices to median disposal incomes (Figure 4). These measures of home affordability can have various other forms such as monthly housing expenditure as a percentage of disposable income or the ratio of the minimum required down payment to disposable income. While this tool can help identify strong trends when ratios diverge from historical averages, its utility has been contested in determining whether or not a bubble exists as decisions to buy a home can revolve on more complex economic and behavioral factors –
24 The price-to-rent ratio is another form of housing market indicator that relates the price of homes to the cost of renting (Figure 4) and can be compared to price-to-earnings ratio in stock markets. Its premise is that the choice between owning and renting is regulated by the no-arbitrage theory. If the cost of renting is low (high) compared to home prices, then homes should be overvalued (undervalued) and the market will adjust. Conventionally, if the price-to-rent ratio of a real estate market is high for a long period of time, then it is likely that high home prices are excessively high due to unrealistic expectations of future price appreciation, and a bubble could therefore exist. Such a conclusion however is very difficult to reach with reasonable certainty (Krainer & Wei, 2004). For the same reasons evoked for price-to-income ratios, price-to-rent ratios are often seen as in ineffective indicator of a housing market “overheating” (Himmelberg, Mayer, & Sinai, 2005).
25
2.2.3 More sophisticated tests
Himmelberg et al. (2005) make the case that conventional price-to-income and price-to rent ratios are inefficient because they fail to account for several key factors that affect the cost of owning a home and that vary in time. A first observation is that home prices are more sensitive to real interest rate fluctuations once real interest rates are already low and in cities with high appreciation rates. In fact these conventional ratios also do not account for tax rates and real interest rate levels. Another model is proposed that encompasses all the costs of homeownership and provides an equilibrium price-to-rent ratio at a point in time, so that it can be compared to actual price-to-rent ratios.
The formula for the cost of ownership contains the following components. The first the foregone interest – at the risk free rate r – that the homeowner could have received had he not invested the value P into the house. The second is the property tax paid by the owner, at the rate ω . The third term is a negative cost and corresponds to the tax deductibility of mortgage payments – at rate r – and property tax payments against an income tax rate τ . The fourth term accounts for the maintenance costs, a yearly rate of δ of the house’s value. The fifth term is the expected appreciation of the house’s value during that year – another negative cost. The final term is risk premium paid by the homeowner for the added risk of owning versus renting.
Annual cost of ownership P r P ω P τ r ω P δ P g P γ
26 determining an objective criterion for the degree and the amount of time the homeownership costs and rental prices are misaligned.
R P r ω τ r ω δ g γ
The price-to-rent ratio should therefore be the following:
P R
1 u
Where:
u r ω τ r ω δ g γ
Observations of real house prices and rental prices as well as the various other parameters
involved will allow us to confront real data to the equilibrium suggested by the model and have a better idea about the existence of a speculative bubble on real estate markets (Himmelberg, Mayer, & Sinai, 2005).
2.3The role of credit and mortgage securitization
Supporters of demand-side factors as causes for housing bubbles such as Shiller (2008) find an explanation in irrational buying frenzies and unrealistic expectations of future price
27
2.3.1 The role of mortgage securitization in the US housing bubble
The National Housing Act passed in 1934 after the Great Depression created the government agency known as the Federal Housing Administration (FHA), whose mission was to “assist the construction, acquisition and rehabilitation of residential properties”. Among other things, the FHA standardized long-term, fully amortized, fixed-rate mortgages (FRMs) by insuring them, replacing the old standard of balloon payment mortgages – regular interest payments with full repayment of principal at the end of the loan period. The creation by the FHA of the Government Sponsored Enterprises (GSEs) Fannie Mae, Ginnie Mae and Freddie Mac to support
FHA-insured mortgages played a great role in providing access to credit to new homeowners across the United States (Fabozzi & Modigliani, 1992).
28 In the early 2000s however, private institutions entered the profitable MBS business to capture a share of the market. These private label securitization (PLS) institutions functioned identically to GSE securitization with the exception that the deal sponsors did not guarantee the repayment of interest and principal. These sponsors therefore had much less of an incentive than GSEs to uphold underwriting standards – low loan-to-income ratios, low LTVs – on the loans they purchased and pooled. The sole incentive was to sell as many MBSs as possible in order to collect fees and the only real constraint was to find buyers. At first PLS easily responded to investor demand for investment grade securities by purchasing mainly prime, “jumbo”
mortgages, which made obtaining a AAA-rated senior tranche rather easy. Only later did the sub-prime MBS market see the light of day. Sub-sub-prime MBS used highly complex tranche structures to achieve investment grade status despite the lower quality of the underlying assets.
29
Figure 5 - Share of MBS issuance by securitization type (Levitin & Wachter, 2010)
While the housing boom surely has some demand-side explanations, it is undeniable that
30
3.
Methodology
3.1Approach
As described in the introduction, our analysis will have two parts. The first part will be
quantitative: using basic indicators and a more sophisticated model, we will attempt to determine if the current prices observed on the Brazilian housing market make sense, in other words, if or not the market is in equilibrium, just from looking at data. The second part will be a fundamental analysis with the goal to make sense of what has been observed quantitatively. To do so, we will draw from non-academic, economic press, opinion and research on the fundamental factors that affect the housing market. Assembling all of the results, we will attempt to draw conclusion on the nature of the Brazilian housing boom and its foreseeable future.
3.2Data sources
The quantitative and fundamental parts of this analysis each will draw on various data sources, detailed below:
• A major hurdle to his analysis is the extremely limited amount of real estate data compiled on
Brazil. Although it has been contested, the only real source of data available today on the Brazilian residential real estate market is FipeZap index, the fruit of collaboration between FIPE3 and Zap, the largest online real estate classifieds service in Brazil. This index collects rent and price data by geographic area in select Brazilian cities. The methodology as
described by FIPE is rather straightforward. Listings are compartmentalized by geographic area – as per the ones defined by the IBGE4 during the 2000 national census – and by number of bedrooms. The listings are also filtered to rid the data of outliers, such as listing with
31 irrationally low or high prices. The resulting cells are then aggregated into weighting areas, which in turn are weighted by household income and aggregated into regional indices (Fundação Instituto de Pesquisas Econômicas (FIPE), 2011). Unfortunately, the Fipezap index has some shortcomings: mainly, the data is limited and very recent; it has only been collected since January 2008 for São Paulo and Rio de Janeiro. Data for other cities5 is even more recent since a minimum number of classified ads are required for the index to be calculated. For the sake of this analysis, we will therefore only consider residential price and rent data from São Paulo and Rio de Janeiro. The accuracy of this index has been criticized for some shortcomings (Selvanayagam, 2012) but is considered to be relatively accurate. To clarify, there exists another source for real estate indices in Brazil. Since 2011, Fundação Getulio Vargas’ IBRE6 has published its IGMI-C, a commercial real estate price index with data going back to 2000. The institute is in the process of developing the IGMI-R, a
residential real estate price index, but it has not been published yet. Both of these indices are intended for professionals and are only accessible via paid subscription.
• The SELIC7 rate – the Brazilian inter-bank overnight rate – is published by the Banco Central
do Brasil (BCB) and is easily accessible on its website. The COPOM8 sets this rate at irregular intervals. The COPOM latest meeting on October 10th 2012, the 170th of its kind resulted in a SELIC target of 7.25%, the lowest since 1997.
• Mortgage rates in Brazil have historically been very high but have been progressively
decreasing. A 2011 HSBC Brazil reports that average market mortgage rates went down from 15% to 11% per annum between 2002 and 2012 (Barbosa, 2011). No data series being
5 Belo Horizonte, Brasilia DF, Fortaleza, Salvador and Recife 6 Instituto Brasileiro de Economia
32 available, a linear regression will be applied should monthly mortgage rates be needed. Regardless, mortgage payments are not regarded as deductible expenses by the Brazilian
Receita Federal9.
• Brazil’s urban real estate property tax is the IPTU10; it changes from city to city and varies
between 0.3-1.0%. As a conservative measure and because it is impossible to get exact data, we will use the rate of 1% for both São Paulo and Rio de Janeiro. The IPTU, however, is also not considered a deductible expense from income tax.
• The IBGE publishes data on the despesa de consumo das famílias in Brazil, which is
equivalent to household spending. Adjusted for inflation, this data can serve as an estimate for the yearly increase in household income. For example in 2011, household spending grew by approximately 6.74% after inflation.
33
4.
Analysis
The analysis will be approached from two angles. The first section will be quantitative, the goal being to show that Brazilian housing, specifically in the cities of São Paulo and Rio de Janeiro, is in fact fundamentally overpriced. In order to so, we will apply Brazilian data to the “imputed rent” model (Himmelberg, Mayer, & Sinai, 2005) described in the literature review, which relates the annual cost of ownership to rent levels. The second section of the analysis will be an attempt to relate fundamental factors in real estate markets such as credit and consumer behavior to the qualitative results seen previously.
4.1Quantitative Approach
Even with troves of data available, it is an ambitious task to attempt to determine whether or not an asset bubble is forming. Therefore with the limited amount of data available for Brazil, it is unrealistic to expect to arrive at any sort of scientifically sound and formal conclusion on the question. Nevertheless, using the basic indicators described earlier as well as a more elaborate model, we will be able to draw some initial conclusions and provide direction to the subsequent qualitative analysis.
4.1.1 Basic Analysis
As described in the literature, there are several basic tests one can perform on real estate data to test for the potential existence of a bubble. While these tests are almost trivial and in no way can be considered an exhaustive grocery list of the analyses required to answer the bubble question, they are a good start and can help point to some key discrepancies and provide direction. As a first step, we will therefore look at three variables:
34 • Price-rent ratios
• Price-income ratios
Regardless of whether or not the Fipezap is an optimal estimation of property value in Brazil, the data is staggering (Figure 6). Since January 2008, the average value of property went up 147% in São Paulo and 181% in Rio de Janeiro before inflation -- approximately 5% in those years
according to the Banco Central do Brasil – adding up to a CAGR11 of 21% and 24% respectively. These growth rates are high by any standard. At the height of the United States housing boom, according to both the OFHEO12 and Case-Shiller home-price indices, real house prices never grew at a rate above 5% CAGR (Figure 6). Rent levels however, despite high growth, have not kept up with home prices. In the same time span, they grew at 13% and 17% CAGR respectively. The face that home prices have grown faster than rent prices suggests that the market is out of equilibrium and that real estate is overpriced.
There are a number of fundamental economic factors that can drive real estate prices up, but in this situation, it is difficult to come up with a rational explanation for such high growth rates in São Paulo and Rio de Janeiro. Factors such as GDP growth, real income growth or housing are not enough to account for “double-digit” growth rates in home prices. The fact that home prices have outpaced rent levels in the last several years suggests a shift away from equilibrium price-rent ratios and that it is curprice-rently more advantageous for an individual to price-rent rather than own. The rent of a home is essentially the rate of return that the asset generates per year. The lower the rent in comparison to the price, the lower the return this asset yields. A more in-depth focus on price-rent ratios should shed some light on this question.
11 Compound Annual Growth Rate
35
Figure 6 - Home-price index for São Paulo and Rio de Janeiro (base 100 in January 2008), Source: Fipezap
Using the ZAP database, FIPE also computes a “rental rate”, which is the ratio of home prices to rent levels (Figure 7). As the graph shows, this ratio has significantly increased in the last 4 years, with home prices reaching levels of 21 times yearly rent in São Paulo and 17 times in Brazil. These ratios however seem to have leveled since late 2011. In the United States, a rule of thumb says that a ratio of 20, i.e. 5% rental rate, is considered high and that at that level that renting is advantageous over owning (Leonhardt, 2010). At the height of the US housing boom in 2005, some major cities such as Miami and Las Vegas – two of the most affected cities by the
subsequent crisis – had price-rent ratios just above 30 and the highest ratio was found in Oakland at just above 47. At first glance, the Brazilian ratios, although high, can therefore be seen
reasonable or at least not catastrophic. The abovementioned rule of thumb, however, can only truly be applied to the specific financial and fiscal conditions of the United States, which are not comparable to the ones in Brazil. Interest rates have historically been much lower in the United States than in Brazil – mortgage rates as well – which means credit is cheaper and more
accessible. In addition, the United States fiscal code has long promoted homeownership through
0 50 100 150 200 250 300 J-0 8 A -0 8 J-0 8 O -0 8 J-0 9 A -0 9 J-0 9 O -0 9 J-1 0 A -1 0 J-1 0 O -1 0 J-1 1 A -1 1 J-1 1 O -1 1 J-1 2 A -1 2 J-1 2
Prices São Paulo
Prices Rio de Janeiro
Rent São Paulo
36 incentives and deductions, an American staple and the epitome of success. As a result, property taxes and mortgage rates are deductible from income tax. In Brazil no such financial and fiscal advantages exist, thereby making the cost of homeownership theoretically higher than in the United States. Therefore, the fact that the Brazilian ratios are not outrageous cannot discard the existence of a housing bubble, especially because these ratios have rapidly increased in short periods of time. To further delve into this issue in the next section, we will apply the model put forth by Himmelberg et al. (2005) of the Federal Reserve Bank of New York, which takes into account financial and fiscal factors in the cost of ownership.
Figure 7 - Rental yield for São Paulo and Rio de Janeiro (Price/Yearly Rent), Source: Fipezap
First however, it is important to ask ourselves the question of the affordability of housing. Affordability of a home is considered a crucial fundamental indicator of a housing bubble. If home prices grow more rapidly than household incomes, then it is usually evidence to suggest that real property is fundamentally overvalued. The best way to do so is to use the data provided by the IBGE on household spending, which is a good indicator of household income. In doing so,
0 5 10 15 20 25 J-0 8 A -0 8 J-0 8 O -0 8 J-0 9 A -0 9 J-0 9 O -0 9 J-1 0 A -1 0 J-1 0 O -1 0 J-1 1 A -1 1 J-1 1 O -1 1 J-1 2 A -1 2 J-1 2 São Paulo
37 however, there is a caveat: the IBGE data is national and the housing prices we have are local. Given the discrepancies in income distribution in Brazil, it is a stretch to say that national household income will behave the same way as household income in Rio de Janeiro.
Nevertheless, the data shows that it is difficult to explain the recent rise in home prices in Brazil with household income. Figure 8 shows that the ratio of prices to household spending increased by 80% in Rio de Janeiro a nearly 60% in São Paulo in the last 4 years. It should be noted that the staggered progression is due to the fact that the spending data is taken on a yearly basis, whereas the house prices are monthly. The actual progression is likely to be smoother than the one displayed here.
Figure 8 - Price-income ratio using household spending (normalized to January 2008), Source: Fipezap, IBGE
While not entirely conclusive, the three basic indicators we have used all point to the fact that home-prices are excessively high and have detached themselves from their fundamental value. Price-rent ratios are on a sharp rise and the increase in household income is not enough to explain the strong increase in real estate prices observed via the Fipezap index. To push the analysis
0,80 1,00 1,20 1,40 1,60 1,80 2,00 J-0 8 A -0 8 J-0 8 O -0 8 J-0 9 A -0 9 J-0 9 O -0 9 J-1 0 A -1 0 J-1 0 O -1 0 J-1 1 A -1 1 J-1 1 O -1 1 J-1 2 A -1 2 J-1 2 São Paulo
38 further, we need to perform some sort of formal test of the price-rent equilibrium, one that takes into account the financial and fiscal particularities of Brazil.
4.1.2 Model Application
As mentioned above, the basic indicators we have used so far are not sufficient to come to a formal conclusion on Brazilian home prices. A better analysis would include financial and fiscal specifics of the Brazilian real estate market. As described in the literature review, the model put forth by Himmelberg et al. (2005) uses a measure called “imputed rent”, in essence the annual cost of homeownership, which takes into account fiscal and financial parameters such as interest, mortgage and property tax rates, among others. This model will allow us to tailor the analysis to the specifics of Brazilian real estate. Specifically we will test the equilibrium between renting and ownership, applying the right costs to ownership.
39 however, we obtain an interesting result is that resulting “imputed rent” -- the annual cost of ownership of a property – is extremely low for both cities. In fact, it is often negative. In January 2010, for example, the imputed rent was -7.2% in São Paulo and -5.5% in Rio de Janeiro, while the respective rent ratios were 7.4% and 5.9%. The reason for this is that the data set begins in the midst of the housing boom and therefore using the 1-year historical CAGR yields very high expected growth rates. This proves particularly problematic because this high “negative cost” or benefit of owning property results in negative imputed rents, which is rather counter-intuitive. This would mean that owning a house is seen as having a negative cost.
Since housing prices, as in all markets, are based on supply and demand mechanisms, a better, more rational proxy for homeowner’s growth expectations would be the growth of average household income, i.e. a measure of the increase in individuals’ ability to purchase a home. As in the first part of our quantitative analysis, a good proxy for this measure is household spending, which is measured yearly by the IBGE. Since 2008, it has increased at about 4-5 percent per annum after inflation. For matters of degrees of freedom in this analysis, it is important that we use a rational investor’s expectation for this metric rather than the very delusional expectations that are already factored the high home prices. Otherwise the calculations would be redundant.
40
41
Figure 9 - Model "imputed rent" versus rental yields, Source: Fipezap, IBGE
First and foremost, the results of this analysis show that cost of owning real estate in Brazil is high. The “imputed rent” has fluctuated between 8% and 16% since early 2008. There are two important factors explaining this high cost. The first and most important reason is that interest rates are high in Brazil – the SELIC rate was 11.25% at the beginning of 2008 and is still relatively high at 7.25%. Borrowing money is costly in Brazil, which increases the cost of owning a home. Second, Brazil does not offer any fiscal incentives to become a homeowner. In the United States, where such incentives exist, mortgage payments and property taxes are tax deductible and therefore reduce the overall cost of owning property. Another important fact to note is that because of declining interest rates in Brazil, the model’s imputed rent value is decreasing – from about 13% in January 2008 to less than 8% today. To sum up, the results of this calculation is that according to the model, the “natural” rent yield of real estate property is currently about 8% and is decreasing.
Despite this decrease however, Fipezap data shows us that the actual rent yields observed in the two largest Brazilian cities are lower than the value implied by the model. Actual rent yields are
0% 2% 4% 6% 8% 10% 12% 14% 16% 18% J-0 8 A -0 8 J-0 8 O -0 8 J-0 9 A -0 9 J-0 9 O -0 9 J-1 0 A -1 0 J-1 0 O -1 0 J-1 1 A -1 1 J-1 1 O -1 1 J-1 2 A -1 2 J-1 2 Imputed Rent São Paulo
42 currently around 6% in São Paulo and as low as 5% in Rio. Such levels are considered “normal” in economies such as that of the United States; recall the rule of thumb that a price-rent ratio of 20 – i.e. a rent yield of 5% – means that renting is cheaper than buying. However, in high interest rate environments such as Brazil, such levels of rent yields are very low. In fact, since January 2008, the rent yields in both cities have always well below the imputed rent. In November 2008, the imputed rent was 6 and 9 percentage points above the rent yields in São Paulo and Rio de Janeiro respectively. Intuition would lead us to think that such a disequilibrium between the costs of owning and renting would not be sustainable in the long run. In fact, the spreads have
significantly decreased since 2008 to 1% and 3%. Since rent yields are still decreasing in both cities, meaning home prices are growing faster than rent levels, the only explanation for the reduction of this spread is the interest rate drop. Two caveats to this conclusion are important to point out. First, as described in the “Data” section, mortgage rates have not dropped nearly as much as the SELIC rate has been lowered. Second, we are once again comparing local data to national data, which may cause a slightly biased result in the analysis.
To go further in the analysis, we look at the expected rate of growth that is implied by the current market levels. In other words, we look at the rate of growth gt+1 that makes the imputed rent equal
to the observed price-to-rent ratio. We do this for both Rio de Janeiro and São Paulo using the “conservative” risk premium γ of 2%. A higher risk premium implies a higher imputed rent and therefore a further distance from current levels if the market is already overpriced. The results (Figure 10) show that the growth rate implied by the model is actually significantly lower than the actual growth13, especially since 2009 in Rio de Janeiro. This result leads us to two distinct conclusions. First, it could mean that the other factors we used to compute the imputed are too
43 low. For example, the risk premium which was chosen rather arbitrarily could be too low. The second, more plausible one is that that expectation of high growth is not the only factor
explaining high home prices. This conclusion would mitigate the theory according to which the housing boom in Brazil is purely speculative.
Figure 10 - Implied and actual growth rate in São Paulo and Rio de Janeiro
To sum up, applying the model devised by Himmelberg et al. (2005), we can arrive at the conclusion that renting is currently cheaper than owning in both São Paulo and Rio de Janeiro. Although the imputed rent versus rent yield spread has decreased in the last four years, it is only because to lower interest rates and not because actual rent levels and home prices have
converged. So far, no such tendency has been observed. The logical conclusion, if the average investor is a rational economic agent and according to the “no arbitrage” principle, is that low rent yields should drive more individuals to rent rather than buy, thereby lowering demand for homes and consequently the price. In other words, unless rent prices increase further, which seems unlikely as they are generally closely tied to disposable income, home prices should
0% 5% 10% 15% 20% 25% 30% 35% 40% 45% 50% J-0 8 A -0 8 J-0 8 O -0 8 J-0 9 A -0 9 J-0 9 O -0 9 J-1 0 A -1 0 J-1 0 O -1 0 J-1 1 A -1 1 J-1 1 O -1 1 J-1 2 A -1 2 J-1 2 São Paulo
Rio de Janeiro
SP actual
44 eventually drop to bring “rent versus own” market to equilibrium. We cannot rule out, however, that investors make irrational decisions. A further conclusion that we have arrived at is that the gap between the expected growth rate implied by the model and the actual growth rate observed from the Fipezap data suggests that the nature of the housing boom is not purely speculative.
As expected, the quantitative part of this study has yielded results that, although insightful, remain incomplete and lack the robustness to draw true conclusions. In trying to explain the recent housing boom in Brazil quantitatively, we are challenged first and foremost by the lack of data. Not only does it provide us with relatively little hindsight as it dates back only to January 2008, it also is incomplete. Only the home prices and rents of the two major Brazilian cities, São Paulo and Rio de Janeiro are available in the necessary time frame to perform any sort of rigorous analysis. Insofar as this data is incomplete, this analysis will be limited to providing a partial explanation to our question.
45 the market to return to equilibrium. To confirm these results, however, we must look at other, more qualitative factors that possibly play a role in this housing boom.
46
4.2Fundamental Approach
The next and likely the most challenging step of this analysis is to arrive at explanations for this housing boom using qualitative arguments. Even when rich and detailed data is available, the existence of an asset bubble is one that, economists agree, is difficult to determine scientifically. Shiller (2008), a proponent of demand-side explanations to the US real estate crisis of the 2000s, suggests that bubbles are the results of “irrational exuberance”. Detecting irrationality however, either through data or reasoning, is an arduous task as. A first step is to discount one-by-one the possible rational explanations for an asset boom as exhaustively as possible, leaving investor irrationality as the only remaining explanation. The irrational decision made by investors to pay more than the fundamental value for real estate could be explained by the social and economic environment or perhaps by favored by certain behavioral inclinations. To answer these questions, we will draw from several sources: public economic data on Brazil, academic papers and
opinions of experts in the field of real estate and economics. Drawing from these insights, we will attempt to piece together the various factors that affect the real estate market.
47
4.2.1 Supply and demand
It is no secret that Brazil has a fast growing middle class. In its the report, Banco Central do
Brasil (2011) cites FGV data showing that the broad middle class, officially known as “C Class”,
had grown from a 38% percent share (66 million) of the total population in 2003 to 54% (102 million) by 2011 In 2009, the Secretaria de Assuntos Estrategicos (SAE), a government agency, conducted a survey of “C Class” households spanning all aspects of their daily lives: spending, education, health, nutrition, etc. Today, the Brazilian middle class accounts for a towering 46% of the nation’s purchasing power, the largest share of all classes. In the scope of our analysis,
however, the most interesting finding was that 19% of the C Class had the intention to buy property in the coming 5 years (Secretaria Assuntos Estratégicos, 2011). This means an increased demand of about 18 million units for real estate property. Regardless how these future
homeowners decide to enter the market, i.e. new constructions versus existing homes; it should have a strong impact on the market. If construction does not keep up, there could be a shortage in the supply of property which would explain a strong price increase.
Another key characteristic of the Brazilian housing market is the important déficit habitacional (housing deficit), which refers to the (large) portion of Brazilians who do not live in “adequate” housing. According to the Instituto de Pesquisa Econômic Aplicada (IPEA), inadequate housing is characterized by at least one of the following criteria:
48 Such inadequate housing problems are prevalent in Brazil’s urban slums known as favelas. Commissioned by the Ministerio das Cidades¸ the Minas Gerais-based Fundação João Pinheiro (FJP) published in 2008 a report on the Brazilian housing deficit. According to this report, the national deficit was 5.5 million homes in 2008, 83.5% of which are located in urban areas. In other words, in 2008 there was a shortage of 5.5 million homes for the entire Brazilian population to be housed under an “adequate” roof. Specifically, this shortage was of 1.06 million (8.9% of all homes) in the state of São Paulo and as high as 510,000 in São Paulo metropolitan area. The state of Rio de Janeiro, in contrast, has a shortage of “only” 426,000 (8.1% of all homes). At first glance, such as high deficit could suggest a serious supply-demand imbalance which could explain high housing prices. The problem however, is more complex. The same report provides a breakdown of the national housing deficit by income. Figure 11 shows this breakdown.
49
Figure 11 - Breakdown of housing deficit by income (number of minimum wages earned) (Fundação João
Pinheiro, 2011), Source: FJP
In essence, given their income levels, the vast majority of the people affected by the housing deficit are actually not potential homeowners. Their income does not allow them to make the minimum payment on a property – the average loan-to-value ratio14 in Brazil is 50% (Barbosa, 2011) – nor afford interest payments on a mortgage. It is safe to say that the Brazilians affected by the housing deficit are not the ones bidding home prices up.
A third and final explanation for increased housing demand could be the arrival of foreign investors on the Brazilian real estate market. In April 2008, Brazil sovereign debt attained “investment grade”15 status which opened the doors to many institutional investors from around the world that face strict risk constraints on their investment bringing along with them in the rush
14 Maximum percentage of a property value that can be covered by the mortgage. An LTV of 50% means that the other 50% is paid upfront in cash.
50 a multitude of less sophisticated investors as well. Since then, foreign direct investment (FDI) in Brazil has nearly doubled – from US$ 18.8 billion in 2006 and US$ 34.6 billion in 2007 to US$ 68.8 in 2011 (Banco Central do Brasil, 2011). Regardless of what other possible factors than the acquisition of investment grade status in explaining the increase in FDI, it is important to note that the arrival of such capital in Brazil, although the majority of it is not directed at real estate, could have played a large role in increasing demand and driving prices up. In particular, these investors might have a higher willingness to pay than domestic investors and could have contributed to the price surge.
To sum up, the demand side of the equation shows that the growing middle class and the arrival
en masse of foreign capital makes the case for a non-negligible, net increase in demand on the
real estate market. The housing deficit, on the other hand, does not really contribute to housing demand as the households that are affected cannot realistically be considered actors on the housing market due to their low income.
51
Figure 12 - Construction in Brazil since 2006 in billions BRL (Barbosa, 2011)
Trying to match the increase in demand to the increase in supply here is a futile endeavor. It is therefore difficult to estimate whether new construction was enough to accommodate the demand. Had it not been the case, it could have provided a rational explanation for the housing boom. It seems important however to specify one caveat to this analysis. Real estate markets are specific because they are geographically constrained: there is a limit to the amount housing that can be supplied in a specific location. Particularly in “premium” local markets, i.e. dense and highly populated areas with high economic activity such as São Paulo and Rio de Janeiro, it is possible for there to have been a shortage of supply – the number of possible apartment buildings and houses is limited. Brazil is already highly urbanized – 87% in 2010 according to the CIA – but major city are still an important decision. To recap, while at a national scale, new
construction may have absorbed new housing demand, it is possible for shortages to have formed in “premium”, local housing market, due to geographical constraints.
Another way to test the existence of housing shortage is to look at unsold stock. If there is
52 excess demand for housing is pushing property prices up. In the municipality of São Paulo, the syndicate for housing SECOVI publishes data on housing starts16 and sales. Erro! Fonte de
referência não encontrada. shows this data since 2004 in 12 month cumulative terms. The
results are quite interesting: the two values track each other quite well until the second half of 2009. From the second semester of 2009 until the end of 2010, housing sales exceed housing starts which, a phenomenon that provides a rationale for São Paulo’s rising house prices. Since the beginning of 2011 however, housing starts have largely exceeded sales, a possible sign of an imminent slowdown of the housing market. In fact, 2001 saw approximately 38,000 new housing starts while sales plunged, increasing unsold inventory by 20%. Recent trends therefore point to a slowdown of real estate prices rather than the opposite. As a result, it stands to reason that using these observations to try to justify the behavior of Fipezap data would not be very conclusive. According to the São Paulo index, prices have been on a steep and steady rise since the beginning of 2008 and the SECOVI data does not show the persistent housing shortage that would justify it entirely. Unfortunately, no such data exists for Rio de Janeiro.
53
Figure 13 – Cumulative 12 month housing starts vs. sales since 2004 in São Paulo (SECOVI-SP, 2012)
54
4.2.2 Housing credit and regulation
Borrowing money in Brazil, a country with historically high rates of inflation, has always been very costly and challenging. Until the late 1990s most real estate transactions were done in cash and housing credit was unheard of. Only since 1997 and the passing of Lei nº 9.514/97 in the Brazilian civil code – inspired by the North American model – is “fiduciary alienation” possible for financial institutions. This means that if an individual purchases property via financing, the property can be used as collateral. In case of default of the borrower, the property can be
transferred to the creditor. This legal provision is fundamental to the opening of a housing credit market as the wealthiest members of an economy can put up sufficient collateral to guarantee mortgage. Only since the passing of this law has the Brazilian mortgage market truly come to life, although it remains rather underdeveloped at only 5% of GDP (SECOVI-SP, 2012) – as can be observed in Figure 14 – compared to 67% and 106% in the United States in 2000 and 2008 respectively (Levitin & Wachter, 2010).
55 Today in Brazil, a physical person can have recourse to two different modes of financing for the purchase of real estate property:
• For property of less than R$ 500,000, via the Sistema Financeiro de Habitação (SFH) of
the BCB with advantageous conditions such as high LTVs of up to 80-90%.
• Otherwise, via a Carteira Hipotecária¸ a traditional mortgage with varying conditions
depending on the underwriting institution.
These housing loans are traditionally funded by two entities of the state-owned bank Caixa
Econômica Federal (CEF) or “Caixa”. ABECIP17, the industry association, is responsible for the oversight of these two entities:
• The Sistema Brasileiro de Poupança e Empréstimo (SBPE), the national savings and loan program. By law, savings and loans institutions are required to commit 65% of their savings account to housing credit.
• The Fundo de Garantia por Tempo de Serviço (FGTS), the national workers’ fund.
In recent years, the origination of new mortgages has increasingly solicited these two sources of funds, as can be seen in Figure 15, so much so that a point of saturation might soon be reached. In fact, if recent trends continue, according to projections by ABECIP, the stock of housing credit required to finance Brazilian mortgages will exceed the 65% mandated for housing credit and the subsidized savings base could run out. Figure 16 shows these projections. As can be seen,
ABECIP projects that Brazilian could face a shortage as soon as the end of 2013 (Barbosa, 2011). Moody’s Investors Service predicts it could run out by the end of 2014 (Coppola & Brandt, 2012). This shortage of subsidized financing is likely to also boost the development of funding
56 for mortgages via private, “secondary” markets. In fact, two such markets have emerged in the past decade in the form of LCIs18, i.e. traditional covered bonds, but also securitized MBS in the form of CRIs19. These secondary markets were made possible in 1997 after the creation of the
Sistema Financeiro Immobiliário (SFI), whose aim was to create a link between Brazilian
housing credit and capital markets. To the extent that enough funds were still available via SBPE and FGTS, these markers remained small at first until high growth in recent years (Coppola & Brandt, 2012).
Figure 15 - New mortgages from SBPE and FGTS since 2008 (SECOVI-SP, 2012), Source: ABECIP
18 Letras de Credito Immboliário¸ i.e. real estate credit bills
57
Figure 16 - SBPE saving and real estate financing projections (Barbosa, 2011), Source: ABECIP
There is another force pushing the development of these secondary, private markets. SBPE savings deposits that currently finance the majority of Brazilian mortgages pay a government-subsidized and mandated rate of at least 6%. Recently however, savings rules have changed in Brazil. In order to pave the way for the COPOM to further reduce the SELIC rate. The recent, aggressive reductions have caused yields on local bonds to drop to levels below the savings rate, putting them at a disadvantage. In order not to mitigate local governments’ ability to raise money while allowing the COPOM to pursue its aggressive rate cutting strategy, the minister of Finance, Guido Mantega, announced new savings rules in May 2012. As of that date, if the benchmark SELIC rate were to drop below 8.5%, the government sponsored savings rate would be pegged to 70% of the SELIC plus a fluctuating reference rate (Simões & Colitt, 2012). In fact, on July 11th 2012, the COPOM met for the 168th time and decided to lower the SELIC rate from 8.5% to 8%, thereby putting into effect the abovementioned rule. In broader terms, the COPOM’s recent
63
104
162
244
370
561
25%
35%
46%
59%
76%
98%
254
299
351
414
487
573
0 100 200 300 400 500 600 7002009
2010
2011
2012
2013
2014
-100% -50% 0% 50% 100% Poupança SBPE Estoque Financiamentos
58 persistent lowering of the benchmark SELIC rate is likely push investment to higher-yielding mortgage securities from private, secondary markets (Coppola & Brandt, 2012).
In light of these observations and in the scope of our analysis, two important issues need to be studied. First we need to understand whether or not Brazilian consumers are currently over-leveraged, in other words, if there is a risk of a credit bubble. Second, we need to look into how the above-mentioned secondary are regulated and if the right oversight mechanisms are in place.
4.2.2.1Consumer credit bubble
To judge this issue, it is important to first look at how mortgage lending conditions have changed during the housing boom. In broad terms, Brazilian mortgage standards have relaxed in the past decade. According to the HSBC report, one could acquire a $R 200,000 property with a 40% less income than in 2002. In addition, the standard mortgage horizon is now lined up with OECD standard at 30 years compared to 15 in 2002 (Barbosa, 2011). These two occurrences are clear signs of an easing of mortgage conditions. This is important as it opens the market to new entrants, who in the past could not have met the stricter conditions required by lenders. In general, the two key indicators of lending standards are LTV ratios, i.e. how significant a down payment the borrower must make, and “front-end” ratios, i.e. the percentage of income dedicated to mortgage payments.
59 remain conservative compared to the ones observed in the United States during the housing crisis. In the United States, mortgages that conform to standards imposed by Freddie Mac and Fannie Mae have LTV ratios of 80% or less. It is therefore safe to say that these new conditions have not caused an over-leverage of Brazilian mortgage holders.
Figure 17 - Progression of average LTV ratios in Brazil (SECOVI-SP, 2012), Source: ABECIP
In the case of front-end ratios, which are a measure of a borrower’s ability to make mortgage payments, figures are rather conservative as well. Again, according to the HSBC report on the Brazilian housing credit market, the average front end ratio is currently 30% versus 25% in 2002 (Barbosa, 2011). In the US, conforming loans are subject to maximum front-end ratios of 28 to 41%, depending on the overseeing authority.
Overall, it seems that mortgage conditions in Brazil are lined up with OECD standards and in some cases still rather conservative, especially in terms of LTV ratios. However, it is important to integrate this into the overall consumer credit situation of Brazil. Asked about this issue,
60 goods and many middle class households have also taken out automotive loans in recent year. Recalling that housing loans are currently about 5% of GDP, up from about 3% a decade ago (SECOVI-SP, 2012), and observing in Figure 18 that total credit has in Brazil has grown from 26% to 49% of GDP, it is reasonable to suspect some form of ominous consumer over-leverage. However, as it turns out, most of this growth comes from corporate loans via the BNDS20, the Brazilian Development Bank, which have grown much faster than consumer credit. In fact consumer loans currently only represent 33% of total credit. Additionally, the cost of consumer credit remains prohibitively high at an average of 47% per annum in April 2011. Overall, it seems unlikely that a violent credit bubble should occur, as borrowing in Brazil cannot be considered to be either cheap or easily available. As can be seen in Figure 19, Brazil’s indebtedness is still well below international levels. Nevertheless, the real risk could be the saturation of credit growth (Fontevecchia, 2011). In late 2011, the consumer debt burden, i.e. the cost of servicing debt21, was stable at around 22% of the economy’s disposable income and around 35% when including amortization of principal (Badkar, 2012). These levels are relatively high and could signal, as suggested by Professor Eid Júnior, that the consumer credit market in Brazil has reached a point of saturation. If so, the resulting negative shock on consumer demand would surely affect housing demand.
61
Figure 18 - Credit as a percentage of Brazilian GDP (Banco Central do Brasil, 2011)