Effects of High Intensity Interval Training
and Strength Training on Metabolic,
Cardiovascular and Hormonal Outcomes in
Women with Polycystic Ovary Syndrome: A
Pilot Study
Ida Almenning1, Astrid Rieber-Mohn1, Kari Margrethe Lundgren1, Tone Shetelig Løvvik2,3, Kirsti Krohn Garnæs1, Trine Moholdt1,2*
1Department of Circulation and Medical Imaging, Faculty of Medicine, Norwegian University of Science and Technology, Trondheim, Norway,2Department of Obstetrics and Gynecology, St. Olav’s Hospital, Trondheim, Norway,3Department of Laboratory Medicine, Children’s and Women’s Health, Norwegian University of Science and Technology, Trondheim, Norway
Abstract
Background
Polycystic ovary syndrome is a common endocrinopathy in reproductive-age women, and associates with insulin resistance. Exercise is advocated in this disorder, but little knowl-edge exists on the optimal exercise regimes. We assessed the effects of high intensity inter-val training and strength training on metabolic, cardiovascular, and hormonal outcomes in women with polycystic ovary syndrome.
Materials and Methods
Three-arm parallel randomized controlled trial. Thirty-one women with polycystic ovary syn-drome (age 27.2±5.5 years; body mass index 26.7±6.0 kg/m2) were randomly assigned to high intensity interval training, strength training, or a control group. The exercise groups exercised three times weekly for 10 weeks.
Results
The main outcome measure was change in homeostatic assessment of insulin resistance (HOMA-IR). HOMA-IR improved significantly only after high intensity interval training, by -0.83 (95% confidence interval [CI], -1.45, -0.20), equal to 17%, with between-group differ-ence (p = 0.014). After high intensity interval training, high-density lipoprotein cholesterol increased by 0.2 (95% CI, 0.02, 0.5) mmol/L, with between group difference (p = 0.04). Endothelial function, measured as flow-mediated dilatation of the brachial artery, increased significantly after high intensity interval training, by 2.0 (95% CI, 0.1, 4.0) %, between-group difference (p = 0.08). Fat percentage decreased significantly after both exercise regimes,
a11111
OPEN ACCESS
Citation:Almenning I, Rieber-Mohn A, Lundgren KM, Shetelig Løvvik T, Garnæs KK, Moholdt T (2015) Effects of High Intensity Interval Training and Strength Training on Metabolic, Cardiovascular and Hormonal Outcomes in Women with Polycystic Ovary Syndrome: A Pilot Study. PLoS ONE 10(9): e0138793. doi:10.1371/journal.pone.0138793
Editor:Cornelis B Lambalk, VU University Medical Center, NETHERLANDS
Received:March 12, 2015
Accepted:September 3, 2015
Published:September 25, 2015
Copyright:© 2015 Almenning et al. This is an open access article distributed under the terms of the Creative Commons Attribution License, which permits unrestricted use, distribution, and reproduction in any medium, provided the original author and source are credited.
Data Availability Statement:All relevant data are within the paper and its Supporting Information files.
Funding:The Norwegian Fund for Research in Sports Medicine. The funders had no role in study design, data collection and analysis, decision to publish, or preparation of the manuscript.
without changes in body weight. After strength training, anti-Müllarian hormone was signifi-cantly reduced, by -14.8 (95% CI, -21.2, -8.4) pmol/L, between-group difference (p = 0.04). There were no significant changes in high-sensitivity C-reactive protein, adiponectin or lep-tin in any group.
Conclusions
High intensity interval training for ten weeks improved insulin resistance, without weight loss, in women with polycystic ovary syndrome. Body composition improved significantly after both strength training and high intensity interval training. This pilot study indicates that exercise training can improve the cardiometabolic profile in polycystic ovary syndrome in the absence of weight loss.
Trial Registration
ClinicalTrial.govNCT01919281
Introduction
Polycystic ovary syndrome (PCOS) is the most common endocrinopathy in reproductive-age women and recognized as the leading cause of anovulatory infertility. The prevalence of PCOS is estimated to be up to 20% using the Rotterdam criteria [1]. The manifestations of the syn-drome include hyperandrogenism, anovalutory menstrual dysfunction, and polycystic ovaries. In addition to concerns about fertility and hyperandrogenism, PCOS is also recognized as a metabolic disorder as these women have increased prevalence of insulin resistance (IR) and hyperinsulineamia, dyslipidemia, and low-grade inflammation [2–4]. The prevalence of obesity is also higher in PCOS women, and even lean women with PCOS frequently show excessive body fat and central adiposity [5,6]. This symptom clustering shows a clear similarity to the metabolic syndrome [7]. Further, endothelial function measured using flow-mediated dilation is found to be compromised in PCOS, also after adjusting for age and body mass [8]. Taken together, this suggests that women with PCOS are at increased risk of cardiovascular disease, although study findings are equivocal [9,10]. Weight-independent (intrinsic) IR seen in PCOS is strongly implicated in the aetiology of the syndrome, contributing significantly to the repro-ductive and metabolic complications of the disorder [11]. The central role of IR in the manifes-tations of PCOS has led to it becoming a primary target for PCOS management.
Lifestyle intervention is regarded as first-line therapy in women with PCOS [12], and has been found to improve both metabolic and reproductive manifestations of the syndrome [13]. Despite the potential beneficial effects of exercise in PCOS, there is a gap in knowledge about exercise type and intensity required to improve outcomes in this population [14]. In men at risk for IR, high intensity interval training (HIT) has been shown to have greater impact on IR than moderate continuous training [15]. Further, strength training (ST) has been found to improve insulin sensitivity in overweight/obese, sedentary men [16].
structured exercise training on insulin sensitivity, measured with homeostatic model assess-ment of insulin resistance (HOMA-IR) in women with PCOS. The comparison of HIT versus ST for these hypothesized effects was exploratory.
Materials and Methods
This pilot study was carried out at the Department of Circulation and Medical Imaging, Faculty of Medicine, Norwegian University of Science and Technology (NTNU), in collaboration with the Department of Gynecology and Obstetrics, St. Olav’s hospital, both Trondheim, Norway. The Regional Committee for Medical and Health Research Ethics in Central Norway approved the study (REK-midt 2013/886) and participants gave their written informed consent before entering.
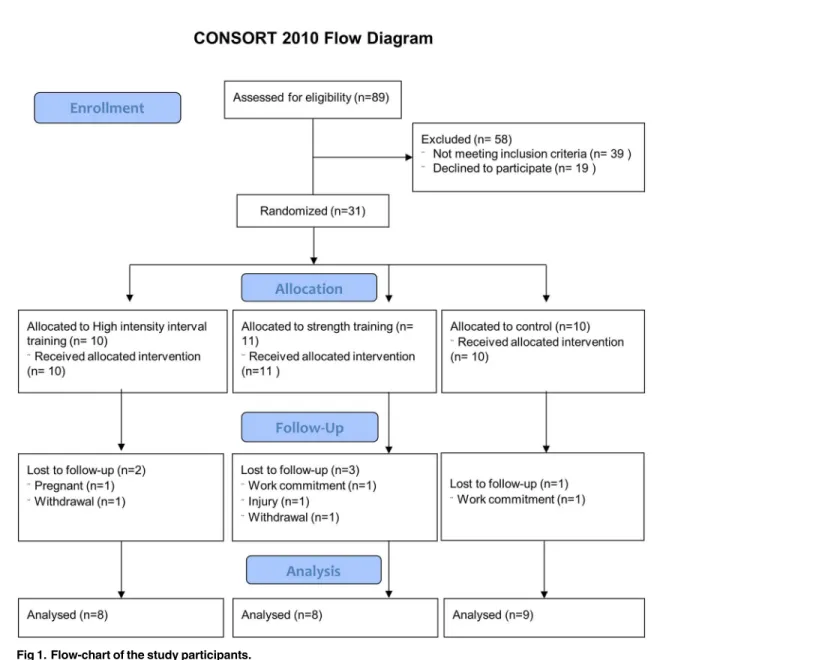
We enrolled women with PCOS from July to October 2013 through community advertise-ment (Fig 1). PCOS was defined according to the Rotterdam criteria [1]: A minimum of two of the following criteria; (i) PCO morphology (12 or more 2–9 mm follicles or>10 ml in volume,
in at least one ovary), (ii) hyperandrogenism (either clinical signs as hirsutism or acne, or bio-chemical), and (iii) oligo/amenorrhea. Hirsutism was defined as a Ferriman Gallwey score8 [17]. Cut-off values for biochemical hyperandrogensim was defined as testosterone>3.0 nmol/
L, calculated free testosterone>32 nmmol/L, SHBG<30 nmol/L, or free androgen index (FAI
as 100 x testosterone concentration (nmol/L) /SHBG concentration (nmol/L)>5% [18].
Oligo-menorrhea was defined as an intermenstrual interval>35 days and<8 menstrual bleedings
in the past year. Amenorrhea was defined as absent menstrual bleeding or none bleeding in the past 90 days. Some of the included women were diagnosed by their own gynecologist. In women who had no prior PCOS diagnosis, we first assessed if they had oligo/amenorrhea and hyperandrogenism. If they fulfilled only one of these criteria, a vaginal ultrasound was done to confirm the diagnosis before study entry. Exclusion criteria included regular high-intensity endurance or strength training (defined as2 sessions of vigorous exercise per week), physical ailments/injuries that limited exercise performance, on-going pregnancy, concurrent treat-ments (insulin sensitizers as metformin and pioglitazone) or drugs known to affect gonadotro-pin or ovulation, with a wash out period of one month prior to inclusion. The exception was regular use of oral contraceptives, and women were included if they did not change the type or dose>1 month prior to the study or during the intervention period.
We calculated the study sample size based on the primary outcome measure of HOMA-IR. We selected the sample size to provide a statistical power of 80%, with a 0.05 alpha level (two-tailed), to detect a between-group difference inΔHOMA-IR of -0.5, with a standard deviation of 0.3 [15]. The power calculation was done as a comparison between two groups (active versus control), and based on independent t-test. The comparison between the two active groups was exploratory. This gave a minimum sample size of seven participants in each group. To allow for an expected 20% lost to follow-up, we aimed at including minimum 30 participants.
Thirty-one women were stratified according to BMI (or<27) as suggested by an earlier
study [19] and allocated in a 1:1:1 manner to HIT, ST or to a control group. We used a com-puter random number generator developed and administered at Unit for Applied Clinical Research at the University to randomize the subjects. Baseline testing was done before random-ization. Follow-up testing was performed from October to December 2013, and these measure-ments were done non-blinded to group assignment. The subjects met in the lab after an over-night fast for12 hours and after refraining from exercise for>72 hours at both baseline and
Participants in HIT and ST were asked to attend three weekly exercise sessions for ten weeks. An exercise physiologist supervised the exercise training at least once weekly. The par-ticipants were asked to maintain their normal diet during the intervention period, without any diet plan.
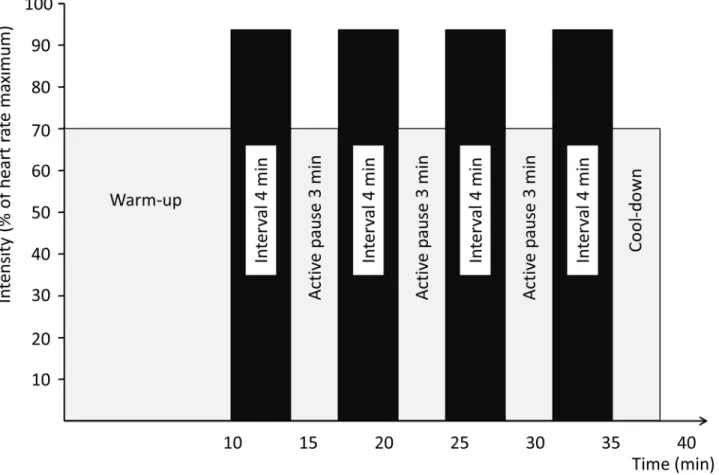
The HIT program included two weekly sessions of four times four minutes HIT at 90–95% of individual heart rate maximum (HRmax), separated by three minutes of moderate intensity
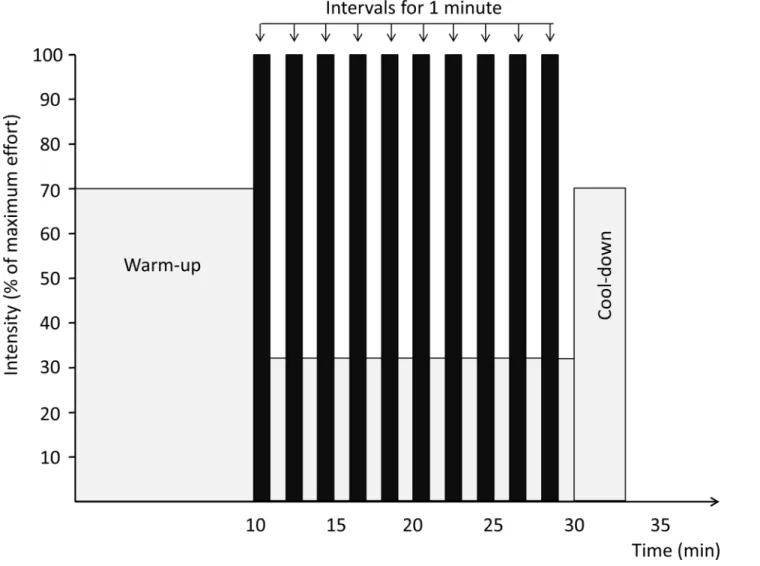
exercise at*70% of HRmax(Fig 2), and one weekly session of ten times one minute with
max-imal intensity (‘all out’) HIT, separated by one minute of rest/very low activity (Fig 3). The exercise mode was treadmill or outdoor walking/running and/or cycling (self-selected). To
Fig 1. Flow-chart of the study participants.
ensure correct exercise intensity during HIT, the subjects used heart rate monitors (Polar RCX3, POLAR, Oulu, Finland) in all sessions. Heart rate data was stored in a personal online training diary (www.polarpersonaltrainer.com) for use in analyses of compliance and exercise intensity. We checked downloaded heart rate data once weekly to ensure correct intensity.
The ST program consisted of eight dynamic strength drills with a resistance of 75% of one repetition maximum (1RM), with ten repetitions and three sets separated by one-minute rest between sets. During the intervention period, the load was increased progressively once the subjects could successfully perform three sets of ten repetitions. All sessions were conducted at a local fitness center with good access to equipment.
We advised the women in the CG to adhere to the recommended150 minutes of weekly moderate-intensity exercise [20] without any follow-up during the ten weeks intervention period. After post-testing, the CG received one-month access to a local fitness center free of charge, and they were offered the HIT and ST training programs.
The primary outcome measure was change in IR from baseline to post-intervention. We cal-culated HOMA-IR as fasting serum insulin inμU per mL x fasting plasma glucose in mmol per
L/22.5 [21]. Plasma glucose was measured using a Roche Moduclar P (Roche, Switzerland). Plasma glucose, total cholesterol, high-density lipoprotein (HDL) cholesterol, low-density lipo-protein (LDL) cholesterol, triglycerides, and high-sensitivity C-reactive lipo-protein (CRP) were measured using a Roche Moduclar P (Roche, Switzerland). Serum insulin, adiponectin and lep-tin were measured in duplicates by enzymed-linked immunosorbent assay (ELISA, IBL-Inter-national, Germany), using a DS2 ELISA processing system (Dynex Technologies, USA). In
Fig 2. Four times four minutes high intensity interval program.
serum, testosterone and homocysteine were measured using mass spectrometry (Agilent 1290/ Agilent 1100 HPLC analyzer, Agilent Technologies, USA), and anti-Müllarian hormone (AMH) using ELISA (STA-R Evolution, Stago, UK), SHBG and DHEAs by an immunologic method (Roche Modular E, Roche, Switzerland). We calculated free testosterone by free andro-gen index (FAI) as 100 x testosterone concentration (nmol/L) /SHBG concentration (nmol/L). Laboratory assays were performed in the clinical biochemistry laboratory at St.Olav’s hospital or at the Department of Circulation and Medical Imaging, Norwegian University of Science and Technology. The inter- and intra-assay coefficient variation was 2.1% and 1.5% for glu-cose, 2.5% and 0.9% for total cholesterol, 2.8% and 0.8% for HDL cholesterol, 2.4% and 0.8% for LDL cholesterol, 2.9% and 0.9% for triglycerides, 3.8% and<1% for high-sensitivity CRP,
5.3% and 9.5% for insulin, 7.0% and 9.9% for adiponectin, 6.9% and 8.7% for leptin, 9.3% and 5.4% for AMH, 6.0% and 3.0% for testosterone, 2.4% and 1.3% for SHBG, 4.8% and 2.1% for DHEAs, and 3.5% and 6.4% for homocysteine.
We estimated endothelial-dependent vasodilation in the left brachial artery by flow-medi-ated vasodilation (FMD) using the method described by Skaug et al [22]. A single experienced operator did all FMD-examinations, with use of a 12-MHz ultrasound Doppler Probe (Vivid 7
Fig 3. Ten times one minute high intensity interval program.
System, GE Vingmed Ultrasound, Horten, Norway). An observer blinded for group allocation analyzed the FMD data. Baseline brachial artery diameter was measured before inflation of a cuff on the forearm inflated to 250 mmHg for 5 minutes. The diameter was again measured 60 seconds after cuff release and FMD% reported is the percentage change in diameter between baseline recordings and 60 seconds after cuff release. We recorded resting heart rate as the low-est heart rate during the rlow-est period of 5 minutes prior to FMD recordings.
Body weight, body composition and visceral fat were measured with the participants wear-ing light clothwear-ing and without shoes or socks uswear-ing bioelectrical impedance analysis
(InBody720, Biospace CO, Korea). Waist circumference was measured to the nearest 0.5 cm horizontally at the level of the umbilicus by using a metric tape with the women in standing position and at normal expiration.
Maximum oxygen uptake (VO2max) was measured using direct analyses of expired gas
(Oxycon Pro, Jaeger, Germany). After warming up for ten minutes, the subjects walked or ran on a treadmill until exhaustion. We used an individualized ramp protocol, adjusted to last 8–12 minutes after warm-up [23]. VO2maxwas averaged over the 30 seconds of highest oxygen
uptake. As criterion for reaching that maximum exhaustion, the respiratory exchanges ratio had to be>1.10 at the end of the test. Heart rate recovery was measured as the difference in
heart rate from the maximum heart rate reached at the end of the VO2maxtest to one minute
after stopping.
Menstrual frequency was self-reported. Clinical hyperandrogenism (hirsutism) was mea-sured by self-scoring of hair growth in seven body areas [17]. Each area was scored from 0 (absence of terminal hairs) to 4 (extensive terminal hair growth), and the scores of all areas were summed for a total hair growth score.
Observed data are reported as mean ± standard deviation (SD). We used the Kolmogorov-Smirnov test and visual inspection of histograms and Q-Q-plots to assess for normality in the data, and log-transformed when appropriate (for SHBG). We used one-way analysis of vari-ance to compare continuous variables between groups at baseline. All subjects who met for testing after ten weeks were included in the analyses, regardless of compliance to the interven-tion, with outcome measures analyzed according to the treatment arm to which the subjects were randomized into. Compliance to exercise training was calculated as the number of ses-sions completed divided by the number of scheduled sesses-sions in the study, in percentage. We used bivariate Pearson correlations to examine associations between HOMA-IR and body composition variables (fat percentage and visceral fat), and between HOMA-IR and VO2max.
To assess changes in outcome variables within groups, we used univariate general linear model with the baseline value of the outcome measure as covariate. Within-group differences were considered significant when the 95% confidence interval (CI) of the estimated marginal means for each group did not include zero [24]. We used univariate general linear model covariance analysis (ANCOVA), with Bonferroni adjustment, to test differences between groups, with the difference (Δ-value) as the dependent factor, group variable as the fixed factor, and baseline values as covariates [25]. As we investigated several outcome measures, the results on second-ary outcomes in this study should be regarded as exploratory. P-values of<0.05 were
consid-ered significant. We used the SPSS Statistics software program version 20 (SPSS Inc., USA).
Results
In total, none of the women fulfilled all three diagnostic criteria. The number of women who had oligo/amenorrhea + hyperandrogenism was 4, 2 and 4, in the ST, HIT and control group, respectively. The number of women who had oligo/amenorrhea + PCO was 3, 5 and 2, in the ST, HIT and control group, respectively. The number of women who had hyperandro-genism + PCO was 2, 0 and 1, in the ST, HIT and control group, respectively. In addition, 2
Table 1. Baseline characteristics of randomized participants.Variables are expressed as means±standard deviation. P-values for between-group
com-parisons of continuous variables at baseline (ANOVA). BMI = Body Mass Index, VO2max= Maximum oxygen uptake, HR rest = resting heart rate, HR recovery = heart rate recovery (maximum heart rate minus heart rate one minute after end of maximum effort exercise test), FMD = flow-mediated dilation, FG score = Ferriman Gallway score, OC use = oral contraceptives use, HOMA-IR = Homeostatic assessment of insulin resistance, TST = Testosterone, FAI = Free Androgen Index (Testosterone x 100/SHBG), AMH = Antimüllarian Hormone, SHBG = Sex-Hormone Binding Globulin,
DHEAS = Dehydroepiandrosterone sulfate. T Chol = total cholesterol, HDL = high-density lipoprotein cholesterol, LDL = low-density lipoprotein cholesterol, TG = triglycerides.
ST (n = 11) HIT (n = 10) CG (n = 10) p-value
Weight, kg 76.5±20.2 73.5±16.7 74.5±16.1 0.93
BMI, kg/m2 27.4±6.9 26.1±6.5 26.5±5.0 0.89
Waist, cm 94.4±18.1 92.3±15.8 92.9±14.6 0.96
Fat mass, kg 26.7±15.5 25.8±12.4 26.4±10.7 0.99
Fat mass, % 32.6±10.4 33.2±9.6 34.2±6.9 0.92
Visceral fat, cm2 106.4±54.4 103.9±51.9 111,3±38.7 0.94
Fat-free mass, kg 27.7±3.6 26.4±3.2 26.6±3.6 0.63
VO2max, mL kg-1min-1 38.3±9.4 35.6±5.6 36.1±7.7 0.70
HR rest, beats/min 56.8±10.0 63.4±6.5 59.9±12.8 0.34
HR recovery, beats 38.5±10.7 33.0±13.4 37.3±13.9 0.60
FMD, % 5.7±2.2 4.0±1.2 6.2±1.9 0.04
FG score 7.1±3.3 5.7±2.9 9.0±3.3 0.09
OC use (n) 4 6 1
-Regular cycles (n) 3 2 3
-Oligomenorrhea (n) 6 7 6
-Amenorrhea (n) 2 1 1
-Glucose, mmol/L 5.0±0.2 5.1±0.3 5.0±0.4 0.90
Insulin,μIU/mL* 14.9±6.2 21.8±7.1 15.8±8.1 0.13
HOMA-IR* 3.3±1.3 4.9±1.7 3.6±2.1 0.17
TST, nmol/L 1.4±0.6 1.5±1.0 1.3±0.5 0.84
FAI 2.8±1.7 1.9±1.3 2.6±1.3 0.37
AMH, pmol/L 63.0±45.0 68.3±54.0 53.3±38.9 0.76
SHBG, nmol/L 60.7±37.2 128.0±110.4 57.6±30.2 0.05
DHEAS,μmol/L 6.1±3.1 7.2±3.1 7.1±2.8 0.66
T Chol, mmol/L 4.7±0.8 4.5±1.1 4.7±0.6 0.86
HDL, mmol/L 1.5±0.5 1.5±0.4 1.6±0.5 0.71
LDL, mmol/L 3.1±1.1 2.5±0.8 2.7±0.7 0.38
TG, mmol/L 0.9±0.4 1.2±0.6 0.7±0.3 0.10
Homocysteine*,μg/mLμmol/mL 8.5±1.5 10.1±7.2 8.8±2.4 0.74
hsCRP, mg/L 2.6±2.5 2.9±3.2 1.7±3.1 0.67
Adiponectin*,μg/mL 11.4±2.7 11.3±3.5 10.6±2.7 0.84
Leptin*, ng/Ml 19.5±15.4 16.5±6.7 22.8±14.1 0.60
*= Insulin, HOMA-IR, leptin, adiponectin and homocysteine were only measured in subjects with data after intervention, and data for insulin are only in n = 25.
women in ST, 3 women in HIT and 3 women in the control group were diagnosed by their own gynecologist prior to study entry.
Participants in ST performed 26 ± 6.5 exercise sessions, thereby giving a compliance of 87%. In HIT, participants performed 27 ± 1.9 sessions, thereby an average exercise compliance of 90%.
HOMA-IR improved significantly after HIT with -0.8 (95% CI: -1.5, -0.2), and with a between-group difference (p = 0.014,Table 2). Pairwise post hoc analyses showed that this dif-ference was between the HIT and the control group only (p = 0.013). Individual changes in HOMA-IR are presented inFig 4. After HIT, FMD increased significantly with 2.0% (95% CI: 0.1, 4.0), but with non-significant between-group difference. HDL increased significantly with 0.2 nmol/l (95% CI: 0.02, 0.5) after HIT, with a significant between-group difference (p = 0.04,
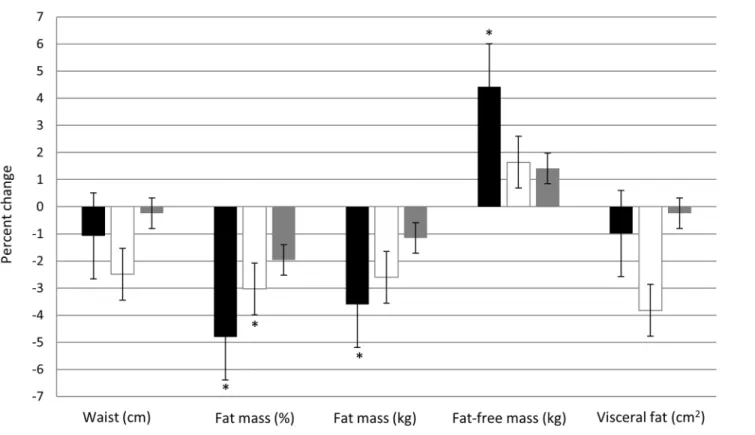
Table 2). As can be seen fromTable 2andFig 5, weight or waist circumference did not change in any group, while fat percentage decreased after both ST and HIT with -1.6 (95%CI: -2.5, -0.7) and -0.9 (95% CI: -1.8, -0.01) respectively. Fat mass in kilograms decreased after HIT with -0.6 (95% CI: -1.1, -0.004) and fat-free mass increased after ST with 1.2 (95% CI: 0.4, 2.1). There were no between-group differences in body composition outcome variables. Anti-Mül-larian levels decreased after ST with -14.8 (95% CI: 21.2, -8.4), with a significant between-group difference (p = 0.04). Pairwise post hoc analyses showed that this difference was between the HIT and the ST group (p = 0.046).
Fat percentage was positively correlated with HOMA-IR at baseline and after ten weeks (both, r = 0.47, p = 0.02). Visceral fat was positively correlated with HOMA-IR at baseline and after ten weeks (both, r = 0.41, p = 0.04). There was no correlation between changes after the intervention period in fat percentage and HOMA-IR (r = 0.24, p = 0.25), or between changes in visceral fat and HOMA-IR (r = 0.21, p = 0.32). There was a significant inverse association between HOMA-IR and VO2maxat baseline (r = -0.42, p = 0.04), but not after ten weeks (r =
-0.32, p = 0.12). The change in HOMA-IR correlated inversely with change in VO2max(r =
-0.49, p = 0.01).
Discussion
The main findings of our study were significantly reduced IR, as well as improved endothelial function after ten weeks of HIT in women with PCOS, and improved body composition after both HIT and ST. These improvements were seen without changes in body weight. We also found indications of positive changes in reproduction-related hormonal outcomes after both HIT and ST, and improvements in HDL cholesterol and homocysteine after HIT.
This pilot study is the first randomized controlled trial to compare HIT and ST as indepen-dent interventions in women with PCOS. It is also one of few studies on effects of exercise training also including normal weight women with PCOS.
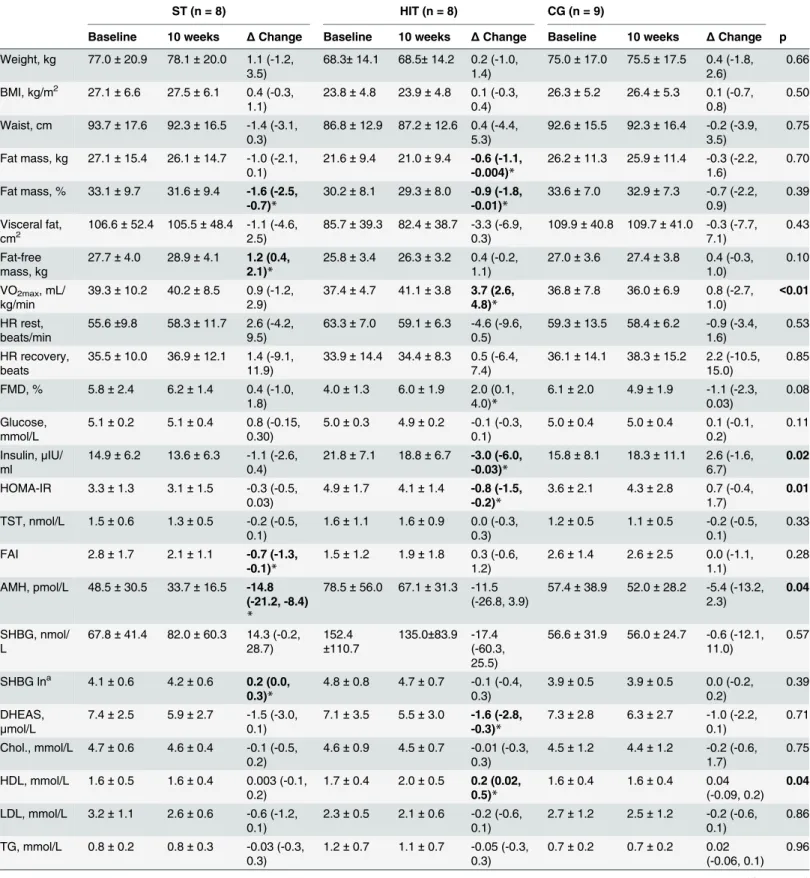
Table 2. Outcome measures at baseline and after intervention (10 weeks) in women who completed follow-up testing. Observed values as means±standard deviation (SD). Delta (Δ) change from baseline to 10 weeks after adjustment for baseline values, with 95% confidence interval (CI). P
(val-ues) for between-group comparisons between changes, adjusted for baseline values.
ST (n = 8) HIT (n = 8) CG (n = 9)
Baseline 10 weeks ΔChange Baseline 10 weeks ΔChange Baseline 10 weeks ΔChange p
Weight, kg 77.0±20.9 78.1±20.0 1.1 (-1.2,
3.5)
68.3±14.1 68.5±14.2 0.2 (-1.0,
1.4)
75.0±17.0 75.5±17.5 0.4 (-1.8,
2.6)
0.66
BMI, kg/m2 27.1±6.6 27.5±6.1 0.4 (-0.3, 1.1)
23.8±4.8 23.9±4.8 0.1 (-0.3,
0.4)
26.3±5.2 26.4±5.3 0.1 (-0.7,
0.8)
0.50
Waist, cm 93.7±17.6 92.3±16.5 -1.4 (-3.1,
0.3)
86.8±12.9 87.2±12.6 0.4 (-4.4,
5.3)
92.6±15.5 92.3±16.4 -0.2 (-3.9,
3.5)
0.75
Fat mass, kg 27.1±15.4 26.1±14.7 -1.0 (-2.1,
0.1)
21.6±9.4 21.0±9.4 -0.6 (-1.1, -0.004)*
26.2±11.3 25.9±11.4 -0.3 (-2.2,
1.6)
0.70
Fat mass, % 33.1±9.7 31.6±9.4 -1.6 (-2.5, -0.7)*
30.2±8.1 29.3±8.0 -0.9 (-1.8, -0.01)*
33.6±7.0 32.9±7.3 -0.7 (-2.2,
0.9)
0.39
Visceral fat,
cm2 106.6
±52.4 105.5±48.4 -1.1 (-4.6,
2.5)
85.7±39.3 82.4±38.7 -3.3 (-6.9,
0.3)
109.9±40.8 109.7±41.0 -0.3 (-7.7,
7.1)
0.43
Fat-free mass, kg
27.7±4.0 28.9±4.1 1.2 (0.4, 2.1)*
25.8±3.4 26.3±3.2 0.4 (-0.2,
1.1)
27.0±3.6 27.4±3.8 0.4 (-0.3,
1.0)
0.10
VO2max, mL/ kg/min
39.3±10.2 40.2±8.5 0.9 (-1.2,
2.9)
37.4±4.7 41.1±3.8 3.7 (2.6, 4.8)*
36.8±7.8 36.0±6.9 0.8 (-2.7,
1.0)
<0.01
HR rest, beats/min
55.6±9.8 58.3±11.7 2.6 (-4.2,
9.5)
63.3±7.0 59.1±6.3 -4.6 (-9.6,
0.5)
59.3±13.5 58.4±6.2 -0.9 (-3.4,
1.6)
0.53
HR recovery, beats
35.5±10.0 36.9±12.1 1.4 (-9.1,
11.9)
33.9±14.4 34.4±8.3 0.5 (-6.4,
7.4)
36.1±14.1 38.3±15.2 2.2 (-10.5,
15.0)
0.85
FMD, % 5.8±2.4 6.2±1.4 0.4 (-1.0,
1.8)
4.0±1.3 6.0±1.9 2.0 (0.1,
4.0)*
6.1±2.0 4.9±1.9 -1.1 (-2.3,
0.03)
0.08
Glucose, mmol/L
5.1±0.2 5.1±0.4 0.8 (-0.15,
0.30)
5.0±0.3 4.9±0.2 -0.1 (-0.3,
0.1)
5.0±0.4 5.0±0.4 0.1 (-0.1,
0.2)
0.11
Insulin,μIU/ ml
14.9±6.2 13.6±6.3 -1.1 (-2.6,
0.4)
21.8±7.1 18.8±6.7 -3.0 (-6.0, -0.03)*
15.8±8.1 18.3±11.1 2.6 (-1.6,
6.7)
0.02
HOMA-IR 3.3±1.3 3.1±1.5 -0.3 (-0.5,
0.03)
4.9±1.7 4.1±1.4 -0.8 (-1.5, -0.2)*
3.6±2.1 4.3±2.8 0.7 (-0.4,
1.7)
0.01
TST, nmol/L 1.5±0.6 1.3±0.5 -0.2 (-0.5,
0.1)
1.6±1.1 1.6±0.9 0.0 (-0.3,
0.3)
1.2±0.5 1.1±0.5 -0.2 (-0.5,
0.1)
0.33
FAI 2.8±1.7 2.1±1.1 -0.7 (-1.3, -0.1)*
1.5±1.2 1.9±1.8 0.3 (-0.6,
1.2)
2.6±1.4 2.6±2.5 0.0 (-1.1,
1.1)
0.28
AMH, pmol/L 48.5±30.5 33.7±16.5 -14.8 (-21.2, -8.4)
*
78.5±56.0 67.1±31.3 -11.5
(-26.8, 3.9)
57.4±38.9 52.0±28.2 -5.4 (-13.2,
2.3)
0.04
SHBG, nmol/ L
67.8±41.4 82.0±60.3 14.3 (-0.2, 28.7)
152.4
±110.7
135.0±83.9 -17.4 (-60.3, 25.5)
56.6±31.9 56.0±24.7 -0.6 (-12.1, 11.0)
0.57
SHBG lna 4.1±0.6 4.2±0.6 0.2 (0.0,
0.3)*
4.8±0.8 4.7±0.7 -0.1 (-0.4, 0.3)
3.9±0.5 3.9±0.5 0.0 (-0.2, 0.2)
0.39
DHEAS, μmol/L
7.4±2.5 5.9±2.7 -1.5 (-3.0, 0.1)
7.1±3.5 5.5±3.0 -1.6 (-2.8, -0.3)*
7.3±2.8 6.3±2.7 -1.0 (-2.2, 0.1)
0.71
Chol., mmol/L 4.7±0.6 4.6±0.4 -0.1 (-0.5, 0.2)
4.6±0.9 4.5±0.7 -0.01 (-0.3, 0.3)
4.5±1.2 4.4±1.2 -0.2 (-0.6, 1.7)
0.75
HDL, mmol/L 1.6±0.5 1.6±0.4 0.003 (-0.1, 0.2)
1.7±0.4 2.0±0.5 0.2 (0.02, 0.5)*
1.6±0.4 1.6±0.4 0.04 (-0.09, 0.2)
0.04
LDL, mmol/L 3.2±1.1 2.6±0.6 -0.6 (-1.2, 0.1)
2.3±0.5 2.1±0.6 -0.2 (-0.6, 0.1)
2.7±1.2 2.5±1.2 -0.2 (-0.6, 0.1)
0.86
TG, mmol/L 0.8±0.2 0.8±0.3 -0.03 (-0.3, 0.3)
1.2±0.7 1.1±0.7 -0.05 (-0.3, 0.3)
0.7±0.2 0.7±0.2 0.02 (-0.06, 0.1)
0.96
intensity. It has been seen in other insulin resistant populations that IR is improved more by HIT compared to moderate intensity training [15,32]. Exercise training, and in particular HIT, may improve IR by several signaling pathways, as reviewed by Gibala [33].
IR correlated with body fat percentage and amount of visceral fat, but we found no associa-tion between changes in IR and these body composiassocia-tion variables. This is in line with previous data [34]. We found reductions in overall body fat percentages after both ST and HIT. This was also seen in a previous study [30], whereas yet another study found no effect of exercise training on total body fat percentage [27]. These conflicting results may be due to differences between study populations at baseline, different methodology for body composition assess-ment, as well as different exercise regimes. We saw no significant changes in visceral fat amount after exercise, but a trend towards lower visceral fat after HIT. In contrast, Hutchinson et al [34] found reduced visceral fat after HIT in a non-controlled study on obese women with
Table 2. (Continued)
ST (n = 8) HIT (n = 8) CG (n = 9)
Baseline 10 weeks ΔChange Baseline 10 weeks ΔChange Baseline 10 weeks ΔChange p
Homocys., μmol/mL
8.5±1.5 8.5±1.6 0.01 (-1.0,
1.0)
10.1±7.2 9.6±4.0 -0.6 (-1.0, -0.1)*
8.8±2.4 8.8±4.0 -0.01 (-0.8,
0.8)
0.99
hsCRP, mg/L 1.7±2.5 1.8±2.7 0.04 (-0.9,
1.0)
3.2±3.1 2.4±2.7 -0.8 (-2.6,
1.0)
1.7±1.9 1.6±2.4 -0.02 (-0.6,
0.5)
0.65
Adiponect., μg/mL
11.4±2.7 11.7±2.7 0.1 (-1.1,
1.3)
11.3±3.5 11.4±3.6 0.02 (-0.8,
0.8)
10.6±2.7 11.0±3.1 0.4 (-0.4,
1.2)
0.77
Leptin, ng/mL 19.5±15.4 16.8±10.8 -2.7 (-5.8,
0.5)
16.5±6.7 15.7±7.2 -0.8 (-3.9,
2.4)
22.8±14.1 22.3±13.2 -0.5 (-5.0,
4.0)
0.42
aVariables are analysed after logarithmic transformation.
*Significant within-group changes from baseline to post-test (zero not within the 95% CI). BMI = Body mass index, VO2max= Maximum oxygen uptake, HR rest = resting heart rate, HR recovery = heart rate recovery (maximum heart rate minus heart rate one minute after end of maximum effort exercise test), FMD =flow mediated dilatation, FG-score = Ferriman-Gallwey score, OC use = oral contraceptives use, HOMA-IR = Homoeostatic assessment of insulin resistance, TST = Testosterone, FAI = Free Androgen Index (Testosterone x 100/SHBG), AMH = Antimüllarian Hormone, SHBG = Sex-Hormone Binding Globulin, DHEAS = Dehydroepiandrosterone sulfat
doi:10.1371/journal.pone.0138793.t002
Fig 4. Individual changes in HOMA IR from baseline to post-intervention.
PCOS. The ST group increased their fat-free mass in parallel to the decrease in fat mass. Since skeletal muscle tissue is the primary metabolic target organ for glucose disposal, maintaining or increasing muscle mass is important in women with PCOS.
FMD has been found to be impaired in women with PCOS [8], suggesting that the risk of cardiovascular events is higher in these women. We found a significant improvement in FMD after HIT, in line with a previous study [29]. Although baseline values were included as a covar-iate in the analysis of FMD change, we realize that there could be a possible regression towards the mean in the HIT group. Further, the increased HDL cholesterol, the improved VO2maxand
the reduced homocysteine levels after HIT could add benefit in regard to cardiovascular pre-vention. We did not, however, see any positive changes in serum markers of low-grade inflam-mation (adiponectin, leptin and high-sensitivity CRP).
AMH levels decreased significantly after ST. Few previous studies have assessed the effect of exercise training on AMH levels in women with PCOS, and with conflicting results. In a small non-randomized study, Moran et al [35] found decreased AMH after 12 weeks of exercise in overweight women with PCOS. In contrast, Nybacka et al [36] observed decreased AMH only after low caloric diet and not after exercise or after the combination of diet and exercise. Fur-ther, Thomson et al [37] found no significant changes in AMH levels after a weight loss inter-vention in overweight/obese PCOS. We are not able to offer any explanations to the
discrepancy between these study results.
Fig 5. Percent change in body composition from baseline to post-intervention.
We did not see any significant changes in total serum testosterone after exercise training, but the ST group had significantly lower FAI after intervention due to increased SHBG levels. Some studies have found reduced testosterone and FAI after the combination of exercise and diet [30,
38], others no changes after exercise training alone [29,31,34]. After HIT, DHEAS was signifi-cantly reduced. The measurement of circulating DHEAS has been used as a marker of adrenal androgen secretion and excess [39]. As some of the women in our study took hormonal oral contraceptive pills (OCP), sexual hormone changes have to be interpreted with caution.
There are some limitations to our study. Our total number of participants was only 31 and when allocated to three different groups, the number of participants in each group was low. This could increase the risk for type II error. We corrected for baseline differences in our analysis to eliminate the effects that baseline differences could have on post-test values. However, the use of OCP or the fact that we did not controlled for diet may have influence some of the outcome mea-surements. OCP use could specifically be a potential confounder in the hormonal analyses. Stud-ies on the pharmacological effects of OCP use on HOMA-IR are limited. However, a Cochrane review [40] on the effects of metformin and OCP in PCOS reported that fasting insulin levels and fasting glucose levels did not change with OCP treatment in any of the three trials reporting these two outcomes. In our study, women taking OCP did not change their medication type or dosage during the intervention period and none started using OCP during the study period. We also assessed a quite high number of outcome variables, without adjustments for multiple testing. This increases the risk for some of the changes seen occurring by chance. The secondary out-come variables should therefore be seen as exploratory/preliminary. Regarding the external validity of our study, we think that our population might have had an in average lower BMI than generally seen in women with PCOS. Some of the assessments were done non-blinded for group allocation. All testing at baseline was however done before randomization. The drop- out rate in our study (20%) was as expected based on experience from other clinical exercise trials, and was taken into consideration in the sample size calculation. It must be considered whether the amount of exercise prescribed in the study is feasible and realistic over time for women with PCOS who are not participating in an exercise study with close follow-up. Long-term adherence to such exercise programs is a clinically relevant issue. Further, the inclusion of two different HIT protocols for each participant within the HIT group (twice weekly 4 x 4 minutes and once weekly 10 x 1 minute) makes it difficult to isolate the effect of each exercise protocol. The women were encouraged to maintain their normal diet, but we cannot exclude the possibility for changes in diet during the intervention period, as we did not register diet throughout the study period. Insulin sensitivity was calculated with the HOMA-IR index and not the gold standard method, the euglycaemic clamp technique. HOMA-IR have some limitation and may not be as accurate as clamp in small exercise interventions [41]. However, our results are supported by other studies using both clamp and HOMA-IR to measure insulin sensitivity in exercise inter-ventions with moderate and/or high intensity exercise [15,32,42].
In conclusion, this pilot study indicated that ten weeks of HIT improved IR and FMD, in women with PCOS. Both HIT and ST improved body composition. Changes were seen after exercise intervention as the sole treatment and without changes in weight. These findings may have important implications for exercise training in management and treatment of PCOS. However, further research is needed to advance our conclusions, and establish exercise guide-lines for these women.
Supporting Information
S1 CONSORT Checklist.
S1 Protocol.
(DOCX)
S1 Dataset.
(SAV)
S2 Dataset.
(SAV)
Author Contributions
Conceived and designed the experiments: TM. Performed the experiments: TM IA ARM TSL KKG. Analyzed the data: TM IA ARM KML. Contributed reagents/materials/analysis tools: TM IA ARM. Wrote the paper: TM IA.
References
1. Revised 2003 consensus on diagnostic criteria and long-term health risks related to polycystic ovary syndrome (PCOS). Hum Reprod. 2004; 19(1):41–7. Epub 2003/12/23. PMID:14688154.
2. Dunaif A. Insulin action in the polycystic ovary syndrome. Endocrinology and metabolism clinics of North America. 1999; 28(2):341–59. PMID:10352922.
3. Kim JJ, Choi YM. Dyslipidemia in women with polycystic ovary syndrome. Obstetrics & gynecology sci-ence. 2013; 56(3):137–42. Epub 2013/12/12. doi:10.5468/ogs.2013.56.3.137PMID:24327994; PubMed Central PMCID: PMCPmc3784112.
4. Repaci A, Gambineri A, Pasquali R. The role of low-grade inflammation in the polycystic ovary syn-drome. Molecular and cellular endocrinology. 2011; 335(1):30–41. doi:10.1016/j.mce.2010.08.002
PMID:20708064.
5. Kirchengast S, Huber J. Body composition characteristics and body fat distribution in lean women with polycystic ovary syndrome. Hum Reprod. 2001; 16(6):1255–60. PMID:11387301.
6. Alvarez-Blasco F, Botella-Carretero JI, San Millan JL, Escobar-Morreale HF. Prevalence and charac-teristics of the polycystic ovary syndrome in overweight and obese women. Arch Intern Med. 2006; 166 (19):2081–6. doi:10.1001/archinte.166.19.2081PMID:17060537.
7. Reaven GM. Role of insulin resistance in human disease (syndrome X): an expanded definition. Annual review of medicine. 1993; 44:121–31. doi:10.1146/annurev.me.44.020193.001005PMID:8476236.
8. Sprung VS, Atkinson G, Cuthbertson DJ, Pugh CJ, Aziz N, Green DJ, et al. Endothelial function mea-sured using flow-mediated dilation in polycystic ovary syndrome: a meta-analysis of the observational studies. Clinical endocrinology. 2013; 78(3):438–46. doi:10.1111/j.1365-2265.2012.04490.xPMID:
22775449.
9. Schmidt J, Landin-Wilhelmsen K, Brannstrom M, Dahlgren E. Cardiovascular disease and risk factors in PCOS women of postmenopausal age: a 21-year controlled follow-up study. The Journal of clinical endocrinology and metabolism. 2011; 96(12):3794–803. Epub 2011/10/01. doi:10.1210/jc.2011-1677
PMID:21956415.
10. Wild S, Pierpoint T, McKeigue P, Jacobs H. Cardiovascular disease in women with polycystic ovary syndrome at long-term follow-up: a retrospective cohort study. Clinical endocrinology. 2000; 52 (5):595–600. PMID:10792339.
11. Diamanti-Kandarakis E, Dunaif A. Insulin resistance and the polycystic ovary syndrome revisited: an update on mechanisms and implications. Endocr Rev. 2012; 33(6):981–1030. doi: 10.1210/er.2011-1034PMID:23065822.
12. Moran LJ, Pasquali R, Teede HJ, Hoeger KM, Norman RJ. Treatment of obesity in polycystic ovary syn-drome: a position statement of the Androgen Excess and Polycystic Ovary Syndrome Society. Fertil Steril. 2009; 92(6):1966–82. Epub 2008/12/09. S0015-0282(08)03909-5 [pii] doi:10.1016/j.fertnstert. 2008.09.018PMID:19062007.
13. Moran LJ, Hutchison SK, Norman RJ, Teede HJ. Lifestyle changes in women with polycystic ovary syn-drome. Cochrane Database Syst Rev. 2011;(7: ):CD007506. Epub 2011/07/08. doi:10.1002/
14651858.CD007506.pub3PMID:21735412.
15. Earnest CP, Lupo M, Thibodaux J, Hollier C, Butitta B, Lejeune E, et al. Interval training in men at risk for insulin resistance. Int J Sports Med. 2013; 34(4):355–63. doi:10.1055/s-0032-1311594PMID:
23180210.
16. Croymans DM, Paparisto E, Lee MM, Brandt N, Le BK, Lohan D, et al. Resistance training improves indices of muscle insulin sensitivity and beta-cell function in overweight/obese, sedentary young men. Journal of applied physiology. 2013; 115(9):1245–53. doi:10.1152/japplphysiol.00485.2013PMID:
23970530; PubMed Central PMCID: PMC3841835.
17. Ferriman D, Gallwey JD. Clinical assessment of body hair growth in women. J Clin Endocrinol Metab. 1961; 21:1440–7. doi:10.1210/jcem-21-11-1440PMID:13892577.
18. Al Kindi MK, Al Essry FS, Al Essry FS, Mula-Abed WA. Validity of serum testosterone, free androgen index, and calculated free testosterone in women with suspected hyperandrogenism. Oman Med J. 2012; 27(6):471–4. Epub 2012/12/12. doi:10.5001/omj.2012.112PMID:23226817; PubMed Central PMCID: PMCPMC3515039.
19. Stepto NK, Cassar S, Joham AE, Hutchison SK, Harrison CL, Goldstein RF, et al. Women with polycys-tic ovary syndrome have intrinsic insulin resistance on euglycaemic-hyperinsulaemic clamp. Human reproduction. 2013; 28(3):777–84. doi:10.1093/humrep/des463PMID:23315061.
20. Haskell WL, Lee IM, Pate RR, Powell KE, Blair SN, Franklin BA, et al. Physical activity and public health: updated recommendation for adults from the American College of Sports Medicine and the American Heart Association. Circulation. 2007; 116(9):1081–93. PMID:17671237.
21. Matthews DR, Hosker JP, Rudenski AS, Naylor BA, Treacher DF, Turner RC. Homeostasis model assessment: insulin resistance and beta-cell function from fasting plasma glucose and insulin concen-trations in man. Diabetologia. 1985; 28(7):412–9. Epub 1985/07/01. PMID:3899825.
22. Skaug EA, Aspenes ST, Oldervoll L, Morkedal B, Vatten L, Wisloff U, et al. Age and gender differences of endothelial function in 4739 healthy adults: the HUNT3 Fitness Study. European journal of preventive cardiology. 2013; 20(4):531–40. doi:10.1177/2047487312444234PMID:22456692.
23. Froelicher VF, Myers J. Exercise and the heart. 5th ed. Philadelphia: Saunders Elsevier; 2006. XI, 524 s. p.
24. Gardner MJ, Altman DG. Confidence intervals rather than P values: estimation rather than hypothesis testing. Br Med J (Clin Res Ed). 1986; 292(6522):746–50. Epub 1986/03/15. PMID:3082422; PubMed Central PMCID: PMC1339793.
25. Vickers AJ, Altman DG. Statistics notes: Analysing controlled trials with baseline and follow up mea-surements. Bmj. 2001; 323(7321):1123–4. PMID:11701584.
26. Brown AJ, Setji TL, Sanders LL, Lowry KP, Otvos JD, Kraus WE, et al. Effects of exercise on lipoprotein particles in women with polycystic ovary syndrome. Med Sci Sports Exerc. 2009; 41(3):497–504. PMID:19204602; PubMed Central PMCID: PMC2727938.
27. Nybacka A, Carlstrom K, Stahle A, Nyren S, Hellstrom PM, Hirschberg AL. Randomized comparison of the influence of dietary management and/or physical exercise on ovarian function and metabolic parameters in overweight women with polycystic ovary syndrome. Fertil Steril. 2011; 96(6):1508–13. doi:10.1016/j.fertnstert.2011.09.006PMID:21962963.
28. Stener-Victorin E, Jedel E, Janson PO, Sverrisdottir YB. Low-frequency electroacupuncture and physi-cal exercise decrease high muscle sympathetic nerve activity in polycystic ovary syndrome. Am J Phy-siol Regul Integr Comp PhyPhy-siol. 2009; 297(2):R387–95. doi:10.1152/ajpregu.00197.2009PMID:
19494176.
29. Sprung VS, Cuthbertson DJ, Pugh CJ, Aziz N, Kemp GJ, Daousi C, et al. Exercise training in polycystic ovarian syndrome enhances flow-mediated dilation in the absence of changes in fatness. Med Sci Sports Exerc. 2013; 45(12):2234–42. PMID:24240117.
30. Thomson RL, Buckley JD, Noakes M, Clifton PM, Norman RJ, Brinkworth GD. The effect of a hypocalo-ric diet with and without exercise training on body composition, cardiometabolic risk profile, and repro-ductive function in overweight and obese women with polycystic ovary syndrome. J Clin Endocrinol Metab. 2008; 93(9):3373–80. doi:10.1210/jc.2008-0751PMID:18583464.
31. Vigorito C, Giallauria F, Palomba S, Cascella T, Manguso F, Lucci R, et al. Beneficial effects of a three-month structured exercise training program on cardiopulmonary functional capacity in young women with polycystic ovary syndrome. J Clin Endocrinol Metab. 2007; 92(4):1379–84. doi: 10.1210/jc.2006-2794PMID:17264174.
32. Tjonna AE, Lee SJ, Rognmo O, Stolen TO, Bye A, Haram PM, et al. Aerobic interval training versus continuous moderate exercise as a treatment for the metabolic syndrome: a pilot study. Circulation. 2008; 118(4):346–54. PMID:18606913. doi:10.1161/CIRCULATIONAHA.108.772822
34. Hutchison SK, Stepto NK, Harrison CL, Moran LJ, Strauss BJ, Teede HJ. Effects of exercise on insulin resistance and body composition in overweight and obese women with and without polycystic ovary syndrome. J Clin Endocrinol Metab. 2011; 96(1):E48–56. Epub 2010/10/12. jc.2010-0828 [pii] doi:10. 1210/jc.2010-0828PMID:20926534.
35. Moran LJ, Harrison CL, Hutchison SK, Stepto NK, Strauss BJ, Teede HJ. Exercise Decreases Anti-Mül-lerian Hormone in Anovulatory Overweight Women with Polycystic Ovary Syndrome—A Pilot Study. Hormone and metabolic research = Hormon- und Stoffwechselforschung = Hormones et metabolisme. 2011; 43(13):977–9. Epub 11.10.2011. doi:10.1055/s-0031-1291208PMID:21989557
36. Nybacka A, Carlstrom K, Fabri F, Hellstrom PM, Hirschberg AL. Serum antimullerian hormone in response to dietary management and/or physical exercise in overweight/obese women with polycystic ovary syndrome: secondary analysis of a randomized controlled trial. Fertil Steril. 2013; 100(4):1096– 102. doi:10.1016/j.fertnstert.2013.06.030PMID:23876536.
37. Thomson RL, Buckley JD, Moran LJ, Noakes M, Clifton PM, Norman RJ, et al. The effect of weight loss on anti-Mullerian hormone levels in overweight and obese women with polycystic ovary syndrome and reproductive impairment. Hum Reprod. 2009; 24(8):1976–81. doi:10.1093/humrep/dep101PMID:
19380385.
38. Palomba S, Falbo A, Giallauria F, Russo T, Rocca M, Tolino A, et al. Six weeks of structured exercise training and hypocaloric diet increases the probability of ovulation after clomiphene citrate in overweight and obese patients with polycystic ovary syndrome: a randomized controlled trial. Hum Reprod. 2010; 25(11):2783–91. doi:10.1093/humrep/deq254PMID:20858697.
39. Wild RA, Umstot ES, Andersen RN, Ranney GB, Givens JR. Androgen parameters and their correlation with body weight in one hundred thirty-eight women thought to have hyperandrogenism. Am J Obstet Gynecol. 1983; 146(6):602–6. Epub 1983/07/15. PMID:6223527.
40. Costello MF, Shrestha B, Eden J, Johnson NP, Sjoblom P. Metformin versus oral contraceptive pill in polycystic ovary syndrome: a Cochrane review. Human reproduction (Oxford, England). 2007; 22 (5):1200–9. Epub 2007/01/31. doi:10.1093/humrep/dem005PMID:17261574.
41. Wallace TM, Levy JC, Matthews DR. Use and abuse of HOMA modeling. Diabetes care. 2004; 27 (6):1487–95. Epub 2004/05/27. PMID:15161807.
42. Harrison CL, Stepto NK, Hutchison SK, Teede HJ. The impact of intensified exercise training on insulin resistance and fitness in overweight and obese women with and without polycystic ovary syndrome. Clinical endocrinology. 2012; 76(3):351–7. Epub 2011/06/30. doi:10.1111/j.1365-2265.2011.04160.x