Abstract—Each database host in the cloud platform often has
to service more than one database application system. However, under the resource limitations of the host, evenly distributed databases into each host is an important issue needed to be addressed. The database sizes and the number of databases must be taken into account for workload balancing among database hosts. If too many data or databases are gathered in only few database hosts, the data skew may occur and result in poor quality of service. Currently, how to evenly allocating databases into hosts has not been concerned yet. In this research, we will propose five database allocation algorithms for distributing databases to hosts in the cloud platform. The equations used to evaluate the deviation of database allocation results are also provided in this report. In our experimental study, one of proposed approach can perform very near optimal solution. We hope that it will help the practical applications in the cloud platform.
Index Terms—cloud computing, database allocation, load
balancing, Best Fit Decreasing Strategy
I. INTRODUCTION
HE Cloud computing is an emerging business solution and has brought to much attention [7][12][18][19]. In the cloud platform, the Storage as a Service (StaaS) is a business model in which a large company rents space in their storage infrastructure to a smaller company or individual [21][24]. It can address the requirements of each software service to distribute the storage space and all kinds of the service on the resource pool. Cloud storage services allow users through the web-based applications at any place and any time via Internet-connected devices for facilitate the use of its storage capabilities without the need for extra proprietary storage system. The storage layer is the main core of the cloud storage, like infrastructure as a service (IaaS) in cloud computing, which is composed of various types of storage devices dispersed in different regions. In this storage layer, either DAS, FC SAN, iSCSI or NAS of IP storage devices can be integrated by consolidation system of storage virtualization technology. Thus remote monitoring and management for all devices can be performed in this consolidation system. Moreover, there must be collaboration between different storage devices, and provides a single integrated services.
Due to a great diversity and large volume of data in the cloud, the databases are spread across a broad range of hosts to serve numerous of users and must have sufficient scalability and management capabilities to face any specific data needs in real time. Therefore, several researches on how to efficiently manage databases in cloud platform have been proposed [6][10][11][13][16].
1
Yu-Lung Lo and Min-Shan Lai are with the Department of Information management, Chaoyang University of Technology, Wufong District, Taichung, 41349 Taiwan. Phone: +886-04-2332-3000 ext. 4274; fax: +886-4-2374-2337; e-mail: yllo@cyut.edu.tw; s10014608@cyut.edu.tw.
A database management system on the database server to serve a large number of users is quite resource consumption, such as the demand on storage space and memory as well as the executing database engine for service and management of the database. On the practical application, a host often serves more than one database application systems concurrently. Accordingly, if too many of them share the limited resources of a host, it may decrease the efficiency of the application systems. Therefore, how to allocate various sizes and the number of databases to every host evenly is one of most important issues for ensuring the good performance in the cloud. However, it has not been discussed until now.
In this paper, we would like to study the load balancing of database allocations in the cloud by considering both two factors of the various sizes of databases and the number of databases. The remaining of this paper is organized as follows: in section 2, we review the related works of data allocations. Then, in section 3, we propose five algorithms for database allocation in cloud platform. After that, we design experiments to evaluate the efficiencies of proposed approaches in section 4. Finally, a conclusion is given in the last section.
II. RELATED WORKS
Cloud infrastructure consists of global master nodes and local slave nodes. Databases are always allocated in slave nodes to serve as database hosts. A database host can serve more than one database and the application systems concurrently. There still has not any report to address the load balancing issue for database hosts in the cloud platform. There is a similar concept by Mackey et al [9] for storing small files in HDFS efficiently and improving the space utilization for metadata. HDFS stands for Hadoop architecture consists of a distributed file system [25]. We will briefly introduce Mackey's approach in this section. Furthermore, since the ideas of Round-robin scheduling and the Best fit decreasing strategy will be used in our proposed schemes, we would also like to give an introduction for them.
A. Metadata Management for Small Files in HDFS
The Hadoop architecture consists of a Distributed file system (HDFS) and a programming framework MapReduce [2]. It is formed with a metadata server called the Name node and a large number of I/O nodes called Data nodes, such that a single Name node keeps metadata of all files on different Data nodes as shown in Figure 1 [9]. In conventional multi-user environments, users are given quotas to access and use such that the HDFS provides for a mechanism to put quotas on user directories. In Hadoop’s implementation, cluster administrators are given two options for applying user quotas; 1) maximum number of files per directory 2) maximum file space for a user directory. Mackey et al discuss their work on these options [9]. Figure 2 shows two cases where an
The Load Balancing of Database Allocation
in the Cloud
Yu-lung Lo and Min-Shan Lai
1incoming request may exceed the quota limitations. Assuming the user quota for number of files is seven and storage is 7GB. N shows the current number of files and S shows the current storage capacity. User 2 in the figure has reached the limit on the number of files, although the space quota is still under utilization. User n has reached the space limit, but the number of files is under utilization. In both cases, users will not be allowed to proceed with the MapReduce job because of the inability to create new files in the respective directory [9].
Figure 1. Hadoop file system [9]
Figure 2. An incoming request May be exceeding number of files quota or storage quota [9]
B. Round-Robin Scheduling
Round-robin scheduling [14] is a simple algorithm designed especially for time-sharing systems for arranging processes are kept in a circular queue as shown in Figure 3. The CPU scheduler goes around this queue and allocates the CPU to each process for a time interval of time slices without priority. It provides a complete fairness among the processes. Round-robin algorithm has been widely used in many scheduling approaches [15][3][23].
Figure 3. Round-robin scheduling [23]
C. Best Fit Decreasing Strategy
Best fit decreasing strategy is often used to solve the bin packing problem and look for the near optimal solution [4][5]. In the problem, objects of different volumes (sizes) must be packed into a finite number of bins with limited capacity each in a way that minimizes the number of bins used. In another similar problem that the objects distributed into all the bins are most evenly. By best fit decreasing strategy, the objects are first sorted into decreasing order according to sizes. In the each iteration, the current largest object is assigned to the bin which currently owns the smallest volumes of packs assigned. This process is repeated until all the objects have been assigned as shown in Figure 4. In the figure, P1 and P2 could be bins, and B1, B2, ..., B8 could be packages in decreasing order according to size. This scheme is also used in many research fields such as data processing and data allocations [8][11][20].
Figure 4. Best Fit Decreasing Strategy
III. LOAD BALANCING FOR DATABASE ALLOCATIONS A database host often serves a number of database management systems. If too many of databases share the limited resources of a host concurrently, it may decrease the efficiency of the application systems. Therefore, evenly designating various sizes and the number of databases to every host can ensure the efficiencies of application systems in the cloud. In this section, we design five allocation algorithms for allocating databases to the hosts. The volumes of data and the number of databases are taken into account for load balancing the allocations. Suppose that all the databases have been sorted in decreasing order according to their sizes and will be allocated into hosts in this sequence.
A. Round-Robin Allocation
Round-robin allocation uses the idea of Round-Robin scheduling to allocate databases in round robin fashion as shown in Figure 5. In the figure, D1, D2, ..., and etc. denote the databases in decreasing order of sizes, and are periodically allocated to hosts N1 to N5.
Figure 5. Round-Robin Allocation
B. Z-Distribution
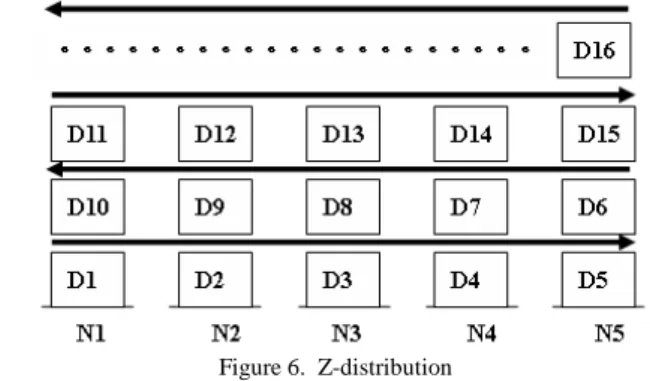
Z-Distribution modifies the Round-robin allocation to allocate databases into hosts in a Z like manner. In this approach, databases are sequentially designated to hosts from N1 to N5 in odd iterations and to hosts from N5 to N1 in even iterations, as shown in Figure 6.
This scheme like Round-robin allocation can well distribute the number of databases to host. In addition, it can distribute the volumes of data to every host more evenly than Round-robin allocation.
Figure 6. Z-distribution
C. Best Fit Decreasing Strategy with Size First
Best fit decreasing strategy with size first uses the Best fit decreasing strategy [5] to allocate databases into hosts with considering the sizes of databases only. The designation of this scheme is similar to that of the Figure 4.
This allocation method emphasizes that it tries to evenly distributing the volumes of data instead of the number of databases to each hosts.
D. Best Fit Decreasing Strategy with Limited Number of
Databases
Best fit decreasing strategy with limited number of databases also use the Best fit decreasing strategy to allocate databases into hosts additional the number of databases is limited in each host. When the number of databases allocated reaches the limitation of a host, the host won't be assigned database again and the database is allocated to the next host with smallest volume of data.
In this approach, we specify the average number of databases (each host assigned if evenly distributed) for the limited number of databases for each host. Therefore, we can evenly allocate the number of databases to hosts like in Round-robin allocation and Z-distribution. However, the load balance of volume of data for each host may not as good as Best fit decreasing strategy with size first.
E. Quantity Ratio Allocation
Quantity Ratio Allocation tries to designate the databases with the smallest volumes of data together with the largest volumes of data to a same host. Since databases are sorted in decreasing order, a host allocated a few number of databases but large volumes of data should delay the designation and wait for the smaller ones. The Equation (1) is designed for evaluating the Quantity Ratio (QRi) for the host i,
where NDBavg and DBavg denote the average number of
databases and the average data volume respectively which each host can be allocated, NDBi and DBi denote the number
of databases and the data volume respectively already allocated in the ith host concurrently. The next designation of database will go for the host with the highest value of quantity ratio. We also note that the limited number of databases for each host can also be applied in this approach to evenly designate the number of databases to hosts.
i avg
i avg i
NDB NDB
DB DB QR
− −
= … (1)
Let's give an example for illustration. Suppose that the known average number of databases (NDBavg) is 10 and
average data volume is 150GB. If host A has already been allocated one database with data volume of 100GB, its quantity ratio will be 5.6 (50/9=). If the other host B has already been allocated five databases with total data volume of 90GB, its quantity ratio will be 12 (60/5=). Since host B has the higher quantity ratio, the next database will be designated to host B. The host A will be delayed and wait for allocating smaller databases.
IV. PERFORMANCE STUDY
In order to evaluate the performances of our proposed database allocation schemes, a series of experiments are performed in this section.
A. Experimental Model
We first design following 3 equations to evaluate how balance of our five allocation approaches.
∑
=−
= n
i
avg i
size DB DB
D 1
…(2)
∑
=
−
= n
i
avg i
NoOfDBs NDB NDB
N
1
…(3)
2 2
+ =
total NoOfDBs
total size
N N
D D
DR …(4)
In Equation (2), Dsize denotes the total size of deviation
which accumulates the difference between the ideally average data volume should be allocated and the actually data is allocated to each host. Where n is the total number of databases, DBi is the data volume allocated in the ith host and DBavg is the ideally average data volume should be allocated
to every host.
In Equation (3), NNoOfDBs denotes the total number of
of databases allocated in the ith host and NDBavg is the ideally
average number of databases should be allocated to every host.
In Equation (4), DR denotes the normalized Deviation Ratio which looks deviation ratios of size (Dsize / Dtotal) and of
the number of databases (NNoOfDBs / Ntotal) as an coordinate in
two dimensional space and computes the distance to the origin (0, 0). Where Dtotal is the total size (volume) of all databases
and Ntotal is the total number of databases being allocated. We
normalize the Dsize and NNoOfDBs to the ratios of (Dsize / Dtotal)
and (NNoOfDBs / Ntotal), respectively, in which their values are
between 0 and 1 such that no one will overly dominate the DR value if Dzise or NNoOfDBs is too vast.
The parameters of our experiment are presented in Table 1. Suppose that the database sizes are not uniformly distributed. The sizes of databases are varied and can be determined by the Zipf-like distribution as shown is Equation (5) [17][22]. In this equation, |Bi| is the size of the ith database,
|R| is the total data volume of all databases, Zb is the database
skew, and b is the total number of databases. We note that when Zb = 1, the equation becomes a Zipf distribution, and
when Zb = 0, it is a uniform distribution. The size distributions
for 1000 databases when Zb equals to 0, 0.5, and 1.0 are
shown in Figure 7. In addition, Sizes of the largest database and the smallest database for Zb varied from 0.0 to 1.0 are
presented in Table 2. If Zb=1, the largest and smallest
databases consist of 13.36TB and 0.013TB data respectively. Furthermore, databases are sorted in decreasing order according to their sizes before allocated to hosts.
Table 1. experimental parameters
Parameter setting
Hosts (n) 100
Number of databases (b) 1000 Total data volume (|R|) 100TB Database skew (Zb) 0.1~1.0
∑
=
= b
j Z Z i
b b
j i
R B
1 1
…(5)
1 10 100 1000 10000 100000
1 63 125 187 249 311 373 435 497 559 621 683 745 807 869 931 993
Database IDs
GB
Zb=0.0 Zb=0.5 Zb=1.0
Figure 7. DB sizes in Zip-like distributions
Table 2. The sizes of largest and smallest DBs for various Zb
Zb Largest DB (TB) Smallest DB(TB)
0.0 0.10 0.100
0.1 0.18 0.090
0.2 0.32 0.080
0.3 0.56 0.070
0.4 0.96 0.061
0.5 1.62 0.051
0.6 2.65 0.042
0.7 4.22 0.034
0.8 6.46 0.026
0.9 9.50 0.019
1.0 13.36 0.013
For easier discussion and labeling, Best Fit Decreasing Strategy with Size First and Best Fit Decreasing Strategy with Limited Number of Databases Allocations will be shorten as BestFit_Size and BestFit_NDB, respectively, in this section. The experimental results are shown in the following subsections. Our experimentation consists of five parts:
(i) Analysis of database size deviation
(ii) Analysis of the number of database deviation (iii) Analysis of deviation ratio
(iv) Analysis of Scalability (v) Optimality study
B. Analysis of database size deviation
In this study, the database size deviations after databases allocated in hosts are investigated. The Equation (2) is used for computing the total size of deviation which accumulates the difference between the ideally average data volume should be allocated and the actually data is allocated to each host. The experimental result is shown in Figure 8. There is no doubt that the database size deviations of all allocation approaches are increasing as rising the database skew from 0.1 to 1.0. It's due to the higher database skew the more difficulty to distribute databases to each host evenly. In the figure, the Quantity Ratio allocation can most evenly allocate databases to hosts when database skew is minor such as Zb <=
0.4. However, the BestFit_Size outperforms all other allocation schemes if Zb >= 0.5. That's because this study
considers the database sizes as the only influence factor and BestFit_Size allocation only focuses on balancing the data volume to every host. Since the Round-robin allocation considers evenly distributing the number of databases to all the hosts only and ignores the effect of data volume distributions, it performs the worst in this study
0 10 20 30 40 50 60 70 80
0.1 0.2 0.3 0.4 0.5 0.6 0.7 0.8 0.9 1
Zb
TB
BestFit_Size BestFit_NDB
Round-Robin Z-Distribution
QuantityRatio
C. Analysis of the number of database deviation
In this section, we examine the number of database deviation. The Equation (3) is used for calculating the total number of database deviation which gathers the difference between the ideally the average number of databases should be allocated and the actually number of databases are allocated to each host. The experimental result is shown in Figure 9. In the figure, all approaches can perfectly allocate the even number of databases to every host except BestFit_Size. To evenly distribute the number of databases to all hosts is not taken into account by BestFit_Size allocation. Therefore, the number of database deviation for BestFit_Size grows up as increasing the database skew.
0 50 100 150 200 250 300 350 400 450
0.1 0.2 0.3 0.4 0.5 0.6 0.7 0.8 0.9 1
Zb
No
. o
f DB
s
BestFit_Size BestFit_NDB Round-Robin Z-Distribution
QuantityRatio
Figure 9. Analysis of the number of database deviation
D. Analysis of Deviation Ratio
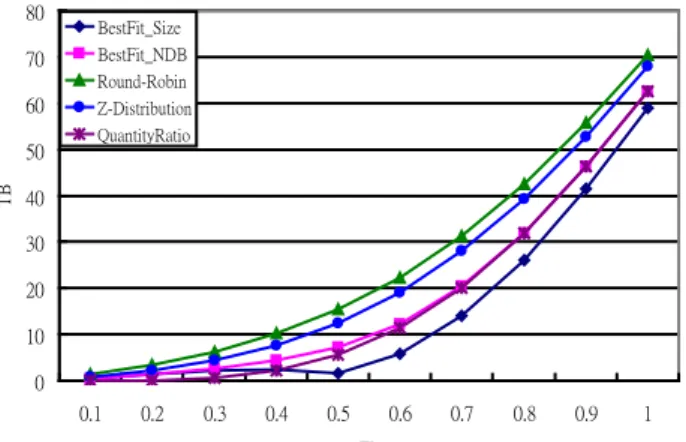
Since the studies of previous two sections considered either database size deviation or the number of database deviation only, both of them will be taken into account simultaneously in this section. To prevent any one of these two deviation factors over dominating the experimental results, they are normalized to design the total deviation ratio calculated by Equation (5). We use this equation to analyze the deviation ratios of five approaches. The experimental result is presented in Figure 10. We can find that Quantity ratio allocation performs best in five schemes. The BestFit_NDB almost acts as good as Quantity ratio allaction when Zb >=0.7. Nevertheless, the BestFit_NDB performs
worse than Quantity ratio allocation and stands in the second best if Zb < 0.7. We also note that Round-robin allocation
which considers evenly distributing the number of databases only almost performs the worst except when Zb =1. In addition,
the Bestfit_Size is very sensitive to database skew when increasing the skew the deviation ratios of BestFit_Size grows most rapidly and becomes the worst when Zb =1.
0 0.1 0.2 0.3 0.4 0.5 0.6 0.7 0.8
0.1 0.2 0.3 0.4 0.5 0.6 0.7 0.8 0.9 1
Zb
DR
BestFit_Size BestFit_NDB Round-Robin Z-Distribution
QuantityRatio
Figure 10. Analysis of deviation ratio
E. Analysis of Scalability
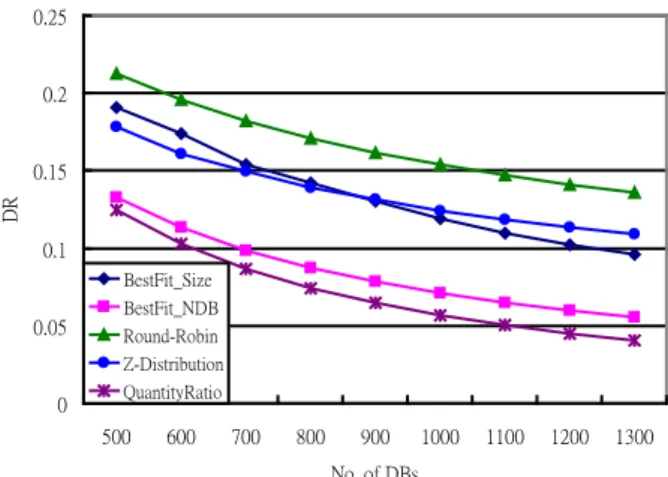
The scalability of our five allocation approaches are examined in this section. In this study, the total number of databases is varied from 500 to 1300. The total data volume and the number of hosts are still fixed for 100TB and 100, respectively. The database skew (Zb) is fixed at 0.5. The
deviation ratio by Equation (4) is used to evaluate the performances of allocation schemes. The experimental result is shown in Figure 11. All the deviation ratios of five approaches are decreased as we increasing the number of databases. It is due to that more number of databases, which implies smaller data volume for every database, is more easily to balance the database allocations. Moreover, the Quantity ratio allocation still outperforms the other four approaches. It benefited greatly by larger number of databases.
0 0.05 0.1 0.15 0.2 0.25
500 600 700 800 900 1000 1100 1200 1300
No. of DBs
DR
BestFit_Size BestFit_NDB Round-Robin Z-Distribution QuantityRatio
Figure 11. Analysis of scalability
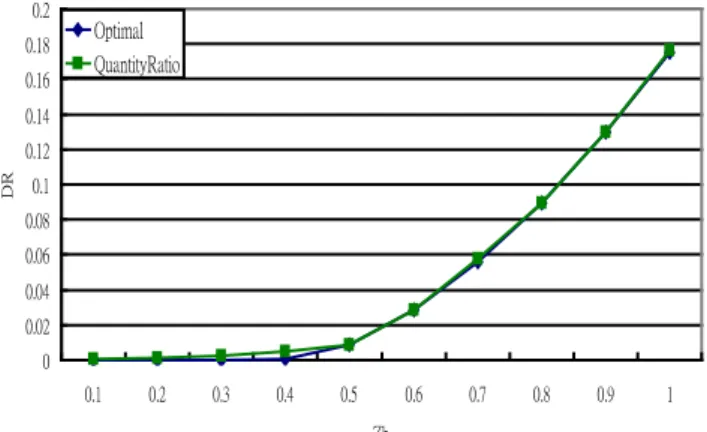
F. Optimality study
0 0.02 0.04 0.06 0.08 0.1 0.12 0.14 0.16 0.18 0.2
0.1 0.2 0.3 0.4 0.5 0.6 0.7 0.8 0.9 1
Zb
D
R
Optimal QuantityRatio
Figure 12. Quantity ratio vs. optimal solution
V. CONCLUSION
Storage as a Services (StaaS) is one of the important services in Cloud platform. All the essential applications and database services are gathered here. In this Cloud platform, databases are dispersed across a broad range of hosts to service numerous users. A database management system which needs storage space for data and memory for database engine running is quite resource consumption. On the practical application, a host often serves more than one database application systems concurrently. Therefore, balance allocated databases to every host can ensure the efficiency of each application system. In this paper, we proposed five database allocation schemes in which both data volume and the number of databases are taken into account. A deviation ratio, which is derived by normalized data size deviation and the number of databases deviation, is designed for evaluating the degree of evenly distributed databases. Our experimental results point out that the Quantity ratio allocation approach has the best performance and is very close to the smallest deviation ratio of optimal solution. Besides, if evenly distributed data volume to each host is most concerned, the Best Fit Decreasing Strategy with Size First approach (BestFit_Size) can perform it well. In addition, if the limitation of CPU power and memory is serious to care for, all proposed approaches, except BestFit_Size, can evenly allocate the number of databases to each host.
REFERENCES
[1] S.A. Cook, “The Complexity of Theorem Proving Procedures,” In proceedings of 3rd Annual ACM Symposium on the Theory of Computing, New York: ACM. 1971: 151-158.
[2] J. Dean and S. Ghemawat, “MapReduce: Simplified Data Processing on Large Clusters,” In Proceedings of the 6th Symposium on Operating System Design and Implementation (OSDI 04), Usenix Assoc., pages 137–150, 2004.
[3] D.J. DeWitt, J. Gray, “Parallel Database Systems: The Future of High Performance Database Systems,” Comm. ACM 35 (6), 85 - 98, 1992. [4] M.R. Garey and D.S. Johnson, Computers and Intractability: A Guide
to the Theory of NP Completeness, Freeman, San Francisco, 1979. [5] D.S. Johnson, “Near-optimal bin packing algorithms,” Ph.D. Thesis,
MIT, Cambridge, MA, 1973.
[6] J.L. Johnson, “SQL in the Clouds,” Computing in Science and Engineering, pp. 12-28, July/August, 2009.
[7] Y. Kakuda, H. Yukitomo, S. Kusumoto, and T. Kikuno, "Scientific Computing in the Cloud, " IEEE Design & Test, Vol. 12, Issue 3, IEEE Computer Society Press, pp. 34-43, May 2010.
[8] M. Kitsuregawa and Y. Ogawa. “Bucket spreading parallel hash: A new, robust, parallel hash join method for data skew in the super database computer (SDC),” In Proc. of 16th Int ’ l Conf. on VLDB, pages 210-221, Brisbane, Australia, August 1990.
[9] G. Mackey, S. Sehrish and J. Wang, "Improving metadata management for small files in HDFS," CLUSTER ‘09. IEEE International Conference on Cluster Computing and Workshops, September, 2009. [10] V. Mateljan, D. Cisic, and D. Ogrizovic, “Cloud Database-as-a-Service (DaaS) – ROI,” proceedings of the 33rd International Convention MIPRO, pp. 1185-1188, May 2010.
[11] Z. Mian and Z. Nong, “The Study of Multimedia Data Model Technology Based on Cloud Computing,” The 2nd International Conference on Signal Processing Systems (ICSPS), pp. V3-743-V3-746, July 2010.
[12] A. Michael, F. Armando, G. Rean, A. D. Joseph, K. Randy, K. Andy, L. Gunho, P. David, R. Ariel, S. Ion, and Z. Matei, “A View of Cloud Computing,” Communications of the ACM, Vol.53, No. 4, pp. 50-58, 2010.
[13] J. Rogers,O. Papaemmanouil, and U. Cetintemel, "A Generic Auto-Provisioning Framework for Cloud Databases," IEEE 26th International Conference on Data Engineering Workshops (ICDEW), pp. 63-68, 2010.
[14] A. Silberschatz, P. B. Galvin, and G. Gagne, " Process Scheduling," Operating System Concepts, John Wiley & Sons, Inc., 8th edition. pp. 194, 2010.
[15] T. Stöhr, H. Märtens, E. Rahm, “Multi-Dimensional Database Allocation for Parallel Data Warehouses,” Proc. 26th VLDB Conference, Cairo, Egypt, Sep. 2000.
[16] N.E. Taylor and Z.G. Ives, “Reliable Storage and Querying for Collaborative Data Sharing Systems,” IEEE 26th International Conference on Data Engineering (ICDE), pp. 40-51, 2010.
[17] C. Turbyfill. ”Comparative Benchmark of Relational Database System,”. PhD thesis, Cornell University, September 1987.
[18] M.A. Vouk, “Cloud Computing- Issues, Research and Implementations,” the 30th International Conference on Information Technology Interfaces, pp. 31-40, June 23-26, 2008.
[19] E. Walker, W. Brisken, and J. Romney, “To Lease or Not to Lease from Storage Clouds,” Computer, Vol. 43, Issue 4, IEEE Computer Society Press, pp. 6-9, April 2010.
[20] J.L. Wolf, D.M. Dias, P.S. Yu, and J. Turek, “Comparative performance of parallel join algorithms,” In Proc. of Int’l Conf. on Parallel and Distributed Information Systems, pages 78-88, Miami, Florida, December 1991.
[21] S. Zhang, S. Zhang, X. Chen, and X. Huo, “Cloud Computing Research and Development Trend,” the 2nd International Conference on Future Networks, pp. 93-97, Jan. 2010.
[22] G.K. Zipf, “Human Behavior and the Principle of Least Effort: An Introduction to Human Ecology,” Addison-Welsey, Reading, MA. 1949.
[23] Y.F., Zheng, C., Shao, “An efficient round-robin algorithm for combined input-crosspoint-queued switches,” In: Dini P, ed. Proc. of
the IEEE ICAS/ICNS, Papeete: IEEE Computer Society, pp. 23−28,
2005.
![Figure 1. Hadoop file system [9]](https://thumb-eu.123doks.com/thumbv2/123dok_br/16418563.195042/2.892.71.434.249.705/figure-hadoop-file-system.webp)