The Genetic Architecture of Natural Variation
in Recombination Rate in
Drosophila
melanogaster
Chad M. Hunter1,2*, Wen Huang1,2,3, Trudy F. C. Mackay1,2, Nadia D. Singh1,2,4
1Program in Genetics, Department of Biological Sciences, North Carolina State University, Raleigh, North Carolina, United States of America,2W. M. Keck Center for Behavioral Biology, North Carolina State University, Raleigh, North Carolina, United States of America,3Initiative in Biological Complexity, North Carolina State University, Raleigh, North Carolina, United States of America,4Bioinformatics Research Center, North Carolina State University, Raleigh, North Carolina, United States of America
*chadmhunter@ncsu.edu
Abstract
Meiotic recombination ensures proper chromosome segregation in many sexually repro-ducing organisms. Despite this crucial function, rates of recombination are highly variable within and between taxa, and the genetic basis of this variation remains poorly under-stood. Here, we exploit natural variation in the inbred, sequenced lines of theDrosophila melanogasterGenetic Reference Panel (DGRP) to map genetic variants affecting
recom-bination rate. We used a two-step crossing scheme and visible markers to measure rates of recombination in a 33 cM interval on theXchromosome and in a 20.4 cM interval on
chromosome3Rfor 205 DGRP lines. Though we cannot exclude that some biases exist
due to viability effects associated with the visible markers used in this study, we find ~2-fold variation in recombination rate among lines. Interestingly, we further find that recom-bination rates are uncorrelated between the two chromosomal intervals. We performed a genome-wide association study to identify genetic variants associated with recombina-tion rate in each of the two intervals surveyed. We refined our list of candidate variants and genes associated with recombination rate variation and selected twenty genes for functional assessment. We present strong evidence that five genes are likely to contrib-ute to natural variation in recombination rate inD.melanogaster; these genes lie outside
the canonical meiotic recombination pathway. We also find a weak effect of Wolbachia infection on recombination rate and we confirm the interchromosomal effect. Our results highlight the magnitude of population variation in recombination rate present inD. mela-nogasterand implicate new genetic factors mediating natural variation in this quantitative
trait. OPEN ACCESS
Citation:Hunter CM, Huang W, Mackay TFC, Singh ND (2016) The Genetic Architecture of Natural Variation in Recombination Rate inDrosophila melanogaster. PLoS Genet 12(4): e1005951. doi:10.1371/journal.pgen.1005951
Editor:Jeff Sekelsky, The University of North Carolina at Chapel Hill, UNITED STATES
Received:October 16, 2015
Accepted:March 1, 2016
Published:April 1, 2016
Copyright:© 2016 Hunter et al. This is an open access article distributed under the terms of the Creative Commons Attribution License, which permits unrestricted use, distribution, and reproduction in any medium, provided the original author and source are credited.
Data Availability Statement:All relevant data are within the paper and its Supporting Information files.
Funding:This work was supported by National Science Foundation grant MCB-1412813 to NDS and National Institutes of Health grant R01 GM45146 to TFCM. The funders had no role in study design, data collection and analysis, decision to publish, or preparation of the manuscript.
Author Summary
During meiosis, homologous chromosomes exchange genetic material through recombi-nation. In most sexually reproducing species, recombination is necessary for chromo-somes to properly segregate. Recombination defects can generate gametes with an incorrect number of chromosomes, which is devastating for organismal fitness. Despite the central role of recombination for chromosome segregation, recombination is highly variable process both within and between species. Though it is clear that this variation is due at least in part to genetics, the specific genes contributing to variation in recombina-tion within and between species remain largely unknown. This is particularly true in the
model organism,Drosophila melanogaster. Here, we use theD.melanogasterGenetic
Ref-erence Panel to determine the scale of population-level variation in recombination rate and to identify genes significantly associated with this variation. We estimated rates of
recombination on two different chromosomes in 205 strains ofD.melanogaster. We also
used genome-wide association mapping to identify genetic factors associated with recom-bination rate variation. We find that recomrecom-bination rate on the two chromosomes are independent traits. We further find that population-level variation in recombination is mediated by many loci of small effect, and that the genes contributing to variation in recombination rate are outside of the well-characterized meiotic recombination pathway.
Introduction
Meiotic recombination, the reciprocal exchange of genetic information between homologous chromosomes during meiosis, is necessary for proper chromosome segregation in many
organ-isms [1]. Interestingly, the distribution of meiotic recombination events, or crossovers, varies
dramatically in almost all taxa studied to date [2–12]. In addition, crossover frequency varies within and between species and populations in a huge diversity of organisms including humans, chimpanzees, flies, mice, worms, yeast, and many others [3,4,6,8,12–26].
In addition to its role in preserving genomic integrity between generations, recombination is a pivotal force in evolution. Recombination can reduce interference between a genetic variant and the genetic background in which it resides, thereby increasing the efficacy of natural
selec-tion [27–29]. Moreover, the exchange of genetic material between homologs creates new allelic
combinations and thus contributes to the raw material for the process of evolution. Further highlighting its importance for evolution in general and genome evolution in particular, rates of recombination correlate with numerous genomic features such as the level of DNA polymor-phism [30–32], rates of protein evolution [33,34], density of transposable elements [35–38], density of satellite DNA [39,40], and codon bias [41,42].
Given the importance of recombination and the pervasive natural variation in recombina-tion rate, it is perhaps unsurprising that the genetic basis of this variarecombina-tion has been an active area of research for the last decade. With respect to the genetic basis of the distribution of crossover events, the first known determinant of recombination distribution in metazoans
was discovered recently [43–45]. This remarkable discovery implicates PRDM9 in
determin-ing the locations of meiotic recombination hotspots in both humans and mice. Sequence
vari-ation withinPrdm9also modulates hotspot activity in humans [46]. PRDM9 is a histone
methyltransferase that catalyzes histone H3 lysine 4 trimethylation [47]. This rapidly evolving
Comparatively less is known in other systems such as Drosophila. Several studies have iden-tified sequence motifs associated with recombination events [7,11,12,56–59], but none have
been functionally validated to date. Drosophila lacks PRDM9 [48,58], and perhaps relatedly,
also lacks the highly punctate recombination landscape seen in mammals. While in humans up
to 80% of recombination events fall in 10–20% of sequence [6], crossover distribution in
Dro-sophila is far less heterogeneous [12,60].
Recent work in mammals has also provided insight into the genetic architecture of global recombination rate. RNF212 has been repeatedly associated with natural variation in recombi-nation rate in several systems including humans [61,62], cattle [63], and Soay sheep [64]. Con-sistent with a role of this protein in modulating recombination rate, RNF212 is essential for meiotic recombination and has a key role in stabilizing meiosis-specific recombination factors
in mice [65]. PRDM9 has also been associated with heritable variation in recombination rate in
humans and mice [52,66]. Other mediators of recombination rate include REC8 [63], which is
a cohesin that is required for proper chromosome segregation in many organisms [67–69]. In
humans, inversion 17q21.31, a 900 kb inversion, is associated with increased recombination
and reproductive output in European females [70].
The genetic architecture of recombination rate variation outside of mammals remains
poorly understood, even in the model organismDrosophila melanogaster. However, it is
well-documented that recombination rate is a variable and heritable trait in Drosophila. For instance, classical genetic experiments indicate that the amount of crossing-over as well as the distribution of crossover events can vary among lines ofD.melanogaster[12,13,71,72], suggest-ing population-level variation in this trait. Additionally, genetic control for crossover rate has been suggested by laboratory selection experiments in which recombination rate itself was suc-cessfully subject to artificial selection [73–85]. Finally, changes in recombination rate have been shown to evolve as a correlated response to artificial selection on other characteristics, such as sternopleural bristle number [86], DDT resistance [87], geotaxis [88], and resistance to
temperature fluctuations [89], which is again consistent with segregating natural variation in
recombination rate. Additionally, the observation that modifiers of recombination rate are commonly associated with variants controlling completely unrelated traits suggests that these modifiers are pervasive in the genome and/or may have pleiotropic effects.
To gain the first insight into the genetic basis of population-level variation in recombination
rate inD.melanogaster, we used an association mapping approach. We favored an unbiased
approach in part becauseD.melanogasterlacks homologs of the three known determinants of
recombination rate in mammals noted above: RNF212, REC8, and PRDM9. We measured
recombination rates on both the3RandXchromosomes in the 205 fully-sequenced inbred
lines of theDrosophila melanogasterGenetic Reference Panel (DGRP) [90,91] using a two-step
crossing scheme. We find nearly 2-fold variation in recombination rate among lines with a standard karyotype. Unexpectedly, we find that recombination rates are uncorrelated between
theXand3rdchromosomes. We leveraged this pervasive population-level variation in
recom-bination rate for genome-wide association (GWA) mapping to identify dominant or semi-dominant variants associated with phenotypic variation in recombination rate on each chro-mosome. We selected the top 20 most promising candidate genes associated with recombina-tion rate and subjected these candidates to both gene-level and allele-level funcrecombina-tional
assessment. Our functional assays implicate five highly promising candidates as novel
media-tors of recombination rate variation inD.melanogaster:CG10864,CG33970,Eip75B,lola, and
Results
Robustness of Data
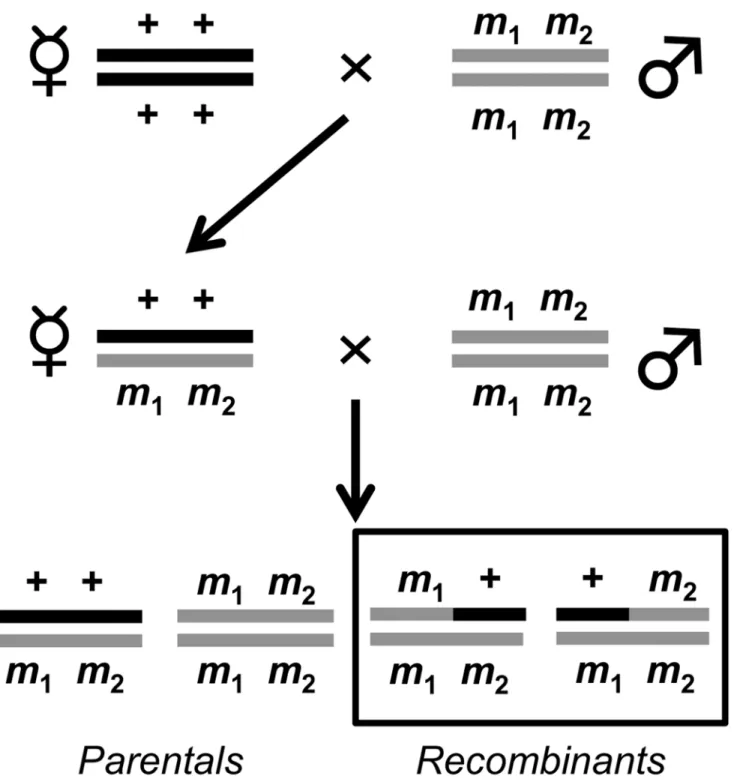
To assay recombination rate variation in the DGRP, we used a classic two-step crossing scheme (Fig 1). We measured recombination rates in two different genomic intervals: the 20.4 cM
interval betweenebony(e) andrough(ro) on chromosome3Rand the 33 cM interval between
yellow(y) andvermilion(v) on theXchromosome. In total, 506,045 progeny were scored for
recombinant phenotypes (217,525 for thee rointerval and 288,520 for they vinterval). On
average, each replicate (there were three replicates per DGRP line per chromosome assay)
con-tained ~368 progeny (for thee rointerval) and ~499 progeny (for they vinterval). We first
ver-ified that our data conformed to expectations under Mendelian inheritance. Deviations from these expectations would be consistent with viability defects associated with the visible markers used in this study. To do so, for each line we compared the number of wild-type progeny to the
number of progeny possessing both markers (eithere roory v), summing across all three
repli-cates (S1 Table). We also compared the number of recombinant progeny possessing only one
marker to the number of recombinant progeny containing only the other marker (eithere +
versus+ roory +versus+ v) (S1 Table). The null expectation is a 1:1 ratio for the
aforemen-tioned pairs of phenotype classes. We used a Bonferroni correction [92,93] withα= 0.05 to
correct for multiple tests. When comparing the ratios of the two non-recombinant haplotypes,
we find 15 lines that deviate from the expected 1:1 wild-type:e roratio (Bonferroni-corrected
P<0.03, all comparisons,G-test) and 8 lines that deviate from the expected 1:1 wild-type:y v ratio (Bonferroni-correctedP<0.03, all comparisons,G-test). In all but one case, the deviation is in the direction of a relative excess of wild type flies. Only one line deviated significantly in both intervals (DGRP_819), with more wild-type progeny in both intervals. When comparing the ratios of the two recombinant haplotypes, we find that DGRP_31 deviates significantly
from the expected 1:1e+/ +roratio (Bonferroni-correctedP<0.0001,G-test) and that
DGRP_819 deviates significantly from the expected 1:1y+/ +vratio (Bonferroni-corrected
P<0.0001,G-test).
Similarly, we tested for sex ratio unity by comparing the numbers of female and male progeny.
There are no deviations from the expected 1:1 male:female ratio in the 205 lines for thee ro
inter-val (Bonferroni-correctedP>0.10, all comparisons,G-test). For they vinterval, only two lines significantly deviate from expectation (DGRP_41 AND DGRP_801) (Bonferroni-corrected P<0.0002, both comparisons,G-test), both in the direction of a relative excess of females.
To assess the consequences of possible viability defects associated with our visible markers on recombination rate estimation, we analyzed correlations between viability defects and recombination. That is, to address whether epistatic interactions between our visible markers and DGRP genotype yield viability defects, we analyzed whether the ratios of the number of
males vs. females, + + individuals versusm1m2individuals, orm1+ individuals versus +m2
individuals are correlated with our estimates of recombination within the DGRP (S2 Table).
Again, each of these ratios should be 1, but could be skewed by viability defects associated with
the markers. Our analysis demonstrates that in they vinterval, none of these ratios are
corre-lated with our estimates of recombination rate. For thee rointerval, we observe a weak but
sta-tistically significant correlation between the ratio of wild type progeny toe roprogeny and
recombination rate. However, no significant correlation is seen between the sex ratio and recombination rate or the ratio of the two classes of recombinants and recombination rate for
thee rointerval. These data are consistent with weak epistatic interactions between thee ro
genetic background and wild-type genetic backgrounds that yield viability defects.
systematic bias towards wild-type chromosomes, indicating that there are no major viability defects associated with any of these mutations alone or in the pairs in which they were used for the current experiment. This confirms previous descriptions of these mutants and their lack of viability defects [94,95]. Our analysis does indicate weak viability effects of thee robackground
Fig 1. Two step crossing scheme to measure crossover frequency in the DGRP.+ + denotes wild-type andm1m2denotes either the doubly markede
roon chromosome3Ror doubly markedy von theXchromosome. Since males are heterogametic, only one copy of theyorvmarker is needed to display a phenotype. Crossover frequency is calculated by taking the ratio of the total number of recombinants (denoted by black box) to the total number of progeny.
as revealed by epistatic interactions with wild-type genetic backgrounds. As a consequence, the scale and scope of the reported variation in recombination rate may be mis-estimated. Given how weak the viability defects appear to be, we believe any mis-estimation is likely to be small in magnitude.
Heritable Continuous Variation in Recombination Rate among DGRP
Lines
Following the crossing scheme detailed in the Materials and Methods and inFig 1, we
esti-mated crossover rate for each DGRP line in thee roand they vintervals (S2 Table;S1A and
S1B Fig) for three replicates. These replicates are largely consistent with one another (S3 Table;
S2A–S2L Fig). Analyzing only lines with a standard karyotype on all chromosomes (n= 112),
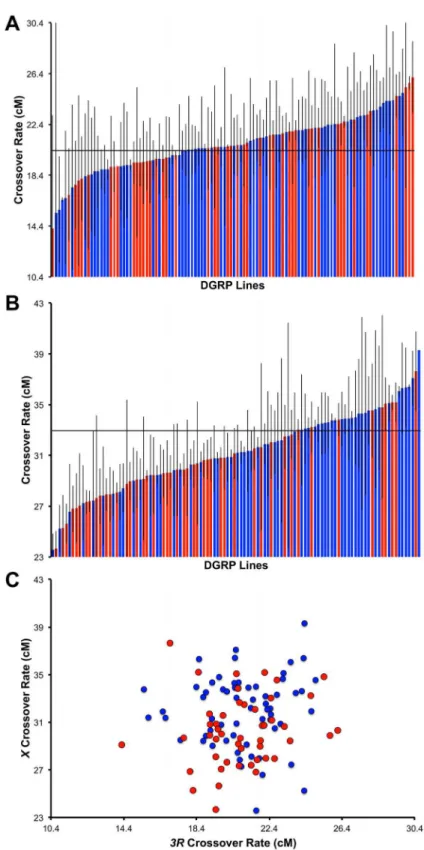
the average crossover rate fore rois 20.9 ± 0.2 cM (ranging from 14.2 cM to 26.12 cM) (Fig
2A). This agrees well with the published map distance of 20.4 cM [95]. Among these lines, we
observe 1.84-fold variation in mean crossover rate. Analyzing only lines with a standard
karyo-type on all chromosomes, the average crossover rate fory vis 31.2 ± 0.3 cM (ranging from 23.6
cM to 39.30 cM) (Fig 2B), compared with the published map distance of 33 cM [94]. Similar to
the magnitude of population-level variation in recombination rate on3R, here we observe
1.67-fold variation among these lines in mean crossover rate for they vinterval.
There is significant genetic variation for crossover rate among lines for both intervals (Fe ro= 1.34,Pe ro= 0.038 andFy v= 3.00,Py v<0.0001, ANOVA). Using only lines with a standard kar-yotype (112 lines), we estimated broad-sense heritability (H2) of recombination rate for thee ro interval as 0.12 and fory vinterval as 0.41 (Table 1). These results confirm that recombination rate is a heritable trait and has a genetic component. Interestingly, there is no significant
correla-tion between recombinacorrela-tion rates in these two intervals (Spearman’sρ= 0.09,P= 0.36;Fig 2C).
Consistent with this, a model fitting effects of line, genomic interval, and line-by-interval inter-action effects reveals significant interinter-action effects (P<0.0001, ANOVA,S4 Table), indicating that the magnitude of the difference in recombination frequency between the two loci surveyed varies significantly among lines. These analyses illustrate that recombination rate on
chromo-some3Rand chromosomeX, at least in the way they have been assayed here, are independent
traits in this panel of flies.
Correlation with Other Phenotypes
As a widely-used community resource, the DGRP offers a unique opportunity to examine the relationship between recombination rate and other phenotypes because a variety of phenotypes
have been surveyed in this panel. We tested whether crossover rates in thee roory vinterval
(of lines with standard karyotypes) were correlated with various traits including organismal fit-ness. While the majority of correlations were weak and not statistically significant, we elaborate on several interesting significant correlations (S23 Table) inS1 Text.
Interchromosomal Effect
Recombination is suppressed within inverted regions, and recombination elsewhere in the
genome increases through what is known as the interchromosomal effect [96,97]. A large
num-ber of the DGRP lines are either homozygous or polymorphic for a chromosomal inversion. To test for the interchromosomal effect, we separated lines with inversions from lines with stan-dard karyotypes and tested whether lines that possessed an inversion somewhere in the genome had higher rates of recombination in our surveyed intervals. Lines with inversions
have significantly increased rates of recombination in they vinterval relative to lines with
Fig 2. Natural variation in recombination rate.Variation in crossover frequency in the DGRP (standard karyotypes only) in the (A)e rointerval on chromosome3Rand (B) in they vinterval on theXchromosome.
The strains in each panel are ordered by recombination rate. DGRP lines infected by Wolbachia are indicated in blue while DGRP lines not infected by Wolbachia are indicated in red. Grey bars depict standard error. For reference, the reported map distance for thee rointerval is 20.4 cM, while the reported map distance for they vinterval is 33 cM, indicated by a horizontal line in both graphs. (C) Recombination rate on3Ras a function of
recombination rate on theXchromosome (standard karyotypes only).
interval (20.9 cM vs. 20.7 cM) but the difference in recombination frequency between standard and inverted karyotypes is not statistically significant (P= 0.66, t-test). These results are
dis-cussed in the context of previous work inS1 Text.
Effects of Wolbachia
In the DGRP, 108 lines are infected withWolbachia pipientis[91]. To test for an effect of
Wol-bachia infection on recombination frequency, we used a linear model (seeMaterials and
Meth-ods) and fit effects of line and Wolbachia infection status for each interval surveyed. Analyzing
only lines with standard karyotype, we find there is a significant effect of Wolbachia infection
in they vinterval (P= 0.0003, ANOVA), such that Wolbachia-infected lines have a higher
crossover frequency (31.8 cM) than uninfected lines (30.0 cM). No effect of Wolbachia
infec-tion was found for thee rointerval (P= 0.35, ANOVA). Importantly, estimates of heritability
are not driven by Wolbachia infection in either interval (S5 Table).
Genome-Wide Association Analyses
The continuous variation for recombination rate among lines described above (Fig 2A and 2B)
suggests that the genetic architecture of this trait is likely complex and regulated by many inde-pendent genetic factors. The observed variation in recombination rate in the DGRP motivates our association mapping approach to more finely define the genetic basis of this trait. To iden-tify genetic variants contributing to variation in recombination rate, we performed genome
wide association mapping on the mean crossover rates from the DGRP in thee roandy v
inter-vals. Note that given the experimental design of our study (Fig 1), we are only able to identify
variants that are at least partially dominant in their effects on recombination frequency. Reces-sive modifiers are not captured in this study, likely yielding underestimates of the scope of nat-ural variation in recombination rate in this system. We did the association mapping in three different ways for each interval because of the inversions segregating in the DGRP and the
known effect of inversions on recombination frequency (see [97] for review). Of the inversions
segregating in the DGRP, none are on theXchromosome. However, 49 lines contained at least
one copy of theC,K,MoorPinversion on chromosome arm3R; all four of these inversions
span at least part of thee rointerval used to assay recombination rate [99]. We thus exclude
these lines when analyzing recombination rate data for the3Rinterval. The three datasets used
for the3Ranalyses were: 1) lines with no inversion on3R(n = 156), 2) lines with neither3R
inversions nor inversion polymorphisms elsewhere in the genome (n = 130), and 3) lines with
the standard karyotype (lines lacking inversions; n = 112). The three datasets used for theX
chromosome analyses were: 1) all lines (n = 205), 2) lines without inversion polymorphisms (n = 152) and 3) lines with a standard karyotype (n = 112).
The statistical model used to infer associations assesses and adjusts for significant associa-tions of both Wolbachia status and inversions. For thee rointerval, there is a significant effect
of theNSinversion (P= 0.003, ANOVA;Table 2) on crossover rate in the restricted data set
Table 1. Analyses of variance of recombination rate.Results are displayed for both thee roandy vintervals (using only lines with standard karyotypes).
H2denotes broad sense heritability.
Interval Source df Type III SS MS F P-value σ2 H2
e ro Line 110 0.21 0.0019 1.35 0.035 1.95E-04 0.12
Error 200 0.29 0.0014 1.14E-03
y v Line 109 0.33 0.0030 2.95 <0.001 0.00072 0.41
Error 204 0.21 0.0010 0.0011
that removes lines with inversions on3Rand lines with inversion polymorphisms. For they v
interval,Wolbachiainfection is significantly associated with crossover rate in all three of our
data sets (P<0.01, all cases, ANOVA;Table 2). Additionally, inversionst,NS,K, andMoare all significantly associated with crossover rate in they vinterval (P<0.05, all cases, ANOVA
Table 2). These data are summarized inTable 2.
The full results for all six GWA analyses are presented as supplementary tables (S6–S11
Tables). To generate a list of candidate genes and alleles, we combined the results from the
dif-ferent GWAS for each chromosome interval, using a significance threshold ofP<10−5. For a
Venn diagram displaying overlap among the different data sets, seeS3 Fig. We tested whether
the distribution of these associated variants was significantly different from the null expectation of a uniform distribution across chromosomes (as a function of the number of polymorphisms on each chromosome). Using lines with standard karyotypes, we find that the distribution of associated variants is significantly different from the distribution of variants in the genome for both intervals (P<0.02, both comparisons,G-tests). It appears that in both intervals, there is an
enrichment of associated variants on chromosome2R(e ro: 63 versus 33;y v: 29 versus 16;
observed versus expected).
For thee rointerval, the three GWAS yielded a combined total of 688 unique variants at a
nominal significance threshold ofP<10−5. For they vinterval, combining results from all
three GWA analyses, we identified 160 unique variants at a nominal significance threshold of P<10−5. A description of types and locations of these variants is included inS12 Table. There
were no variants that overlapped between the two intervals, consistent with the lack of correla-tion between the two traits. However different variants in the same gene (see below) were shared between the associations found in the two intervals. Variants in 359 genes were
impli-cated as potential candidates from the threee roGWAS, and variants in 111 genes were
associ-ated with recombination rate variation in they vGWAS. There is very little overlap between
these gene lists; a total of fifteen genes showed overlapping (gene-level) associations between
thee roandy vGWAS (bab1,bun,CG4440,CG5953,CG31817,CG32521,CR44199,dnr1,
dpr6,Eip63E,Eip75B,Ptp61F,Sec16,Shroom, andSNF4Agamma). The effect sizes for these
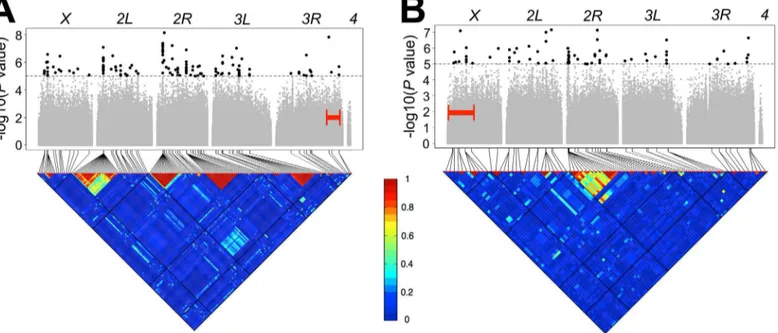
variants were moderate, averaging ~2.32 cM for both intervals (S4A and S4B Fig).Fig 3A and
3Bdisplays the Manhattan plots and linkage disequilibrium plots for both intervals for the
lines with standard karyotypes whileS5andS6Figs display the same information for the other
data sets analyzed.
Candidate Genes
We sought to functionally assess a subset of the genes identified by our association mapping. We used several criteria to refine our list of candidate associations to a tractable set of 20 candi-date genes. First, we restricted our focus to protein-coding genes harboring significantly
Table 2. Analyses of variance of the effects of Wolbachia infection and inversions on recombination rate.
Interval Data Set # of DGRP Lines Pvalues
Wolbachia Status 2L(t) 2R(NS) 3R(P) 3R(K) 3R(Mo)
e ro All lines (with no3Rinversions) 156 0.17 0.12 0.59 - -
-e ro No inversion polymorphisms (and no3Rinversions) 130 0.31 0.12 0.003 - -
-e ro Only standard karyotypes 112 0.53 - - - -
-y v All lines 205 0.01 <0.0001 0.0006 0.1 0.002 0.001
y v No inversion polymorphisms 152 0.006 <0.0001 0.002 0.16 0.049 0.0004
y v Only standard karyotypes 112 0.008 - - - -
associated genetic variants. We then integrated theP-value of the association, effect size, and the number of GWAS the gene was implicated in on either or both chromosomes to refine our list of putative candidates. We narrowed our list further by limiting ourselves to genes with documented expression in the ovaries [99–103]. Our final candidate gene list (Table 3) includes
eleven genes from thee roGWA, five genes from they vGWA and four genes that were found
in both. There was more than one significantly associated genetic variant in 8 of our 20
candi-date genes (CG1273,CG4440,CG7196,dpr6,Eip75B,jing,Ptp61FandUbx) withjingand
Ptp61Fhaving the most significantly associated variants (17 and 13 respectively). The full list
of variants within these genes and associatedP-values are listed inS13 Tableand the genotypes
of each DGRP line at these variants are listed inS14 Table.
Functional Assessment
If these identified candidate genes mediate recombination rate in some way, we expect that per-turbing these genes will affect recombination rate. We used both mutant analysis and RNAi to either knock out or knock down expression of each of these genes, and compared recombina-tion rate in the knock out/down lines to an appropriate genetic background control. We
mea-sured recombination rate in thee roandy vintervals for available mutants and RNAi lines for
all 20 candidate genes in the same way as described earlier. We used a combination ofP
-ele-ment insertions, chromosomal deletions, as well as any available RNAi lines. For the RNAi
experiments, we used ananos GAL4driver, which should target the effects of knockdown to
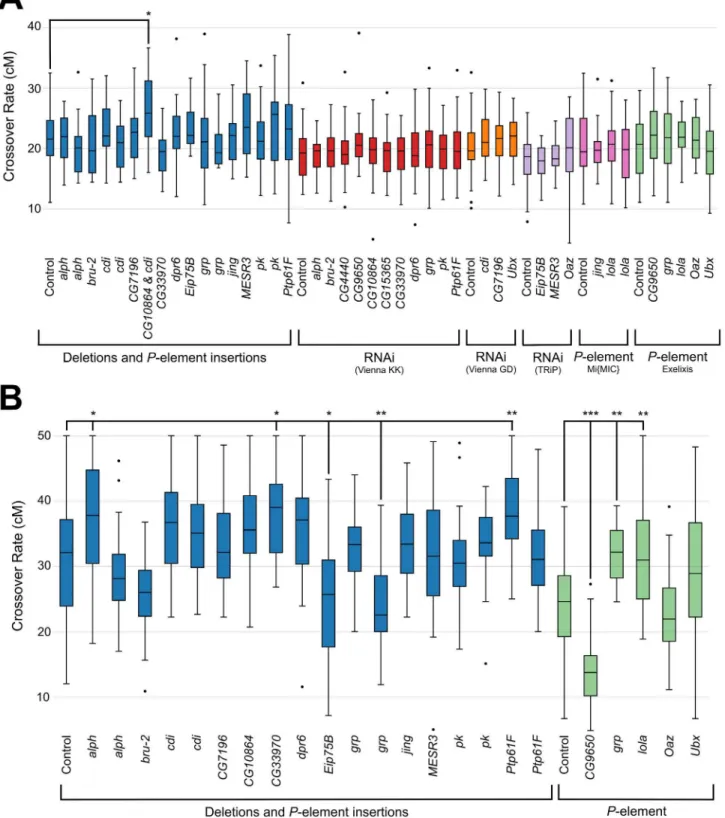
oogenesis. For assessment using thee romarkers, the only line tested that produced a
signifi-cant difference from control line was a deletion line,Df(3R)ED2(P= 0.004, Dunnett’s test) (Fig 4A;S15 Table); this line shows a significant increase in recombination frequency relative to the genetic background control. This deletion encompasses 71 full genes and part of 1 additional
Fig 3. Genome-wide association analyses.Manhattan plots and accompanying linkage disequilibrium heat maps are depicted for the (A)e rointerval and (B)y vinterval for lines with standard karyotypes. A significance threshold ofP10−5is denoted for Manhattan plots. Each point is a tested genetic variant in the DGRP and points above this threshold (in black and enlarged to aid in visualization) indicate significantly associating variants. Additionally, the surveyed interval for each chromosome (eithere roory v) is bracketed in red. The triangular heat map displays the amount of linkage disequilibrium (LD, measured here asr2) between variants. Each major chromosome is depicted. Red denotes complete LD and blue denotes absence of LD.
gene, including two of our candidate genes:cdiandCG10864. It should also be noted that this
deletion is on chromosome3R, spanning the cytological region 91A5 to 91F1 (for referenceeis
at 93C7-93D1 and rois at 97D4-97D5). Using they vmarkers, seven lines tested show a
signifi-cant deviation in recombination frequency relative to the appropriate control (Fig 4B;S16
Table). These includedalph,CG9650,CG33970,Eip75B,grp,lola, andPtp61F(P<0.05, all
comparisons, Dunnett’s test).Eip7B, andCG9650showed a decrease in recombination relative
to the control whilealph,CG33970,Eip75B,lola, andPtp61Fshowed an increase in
recombina-tion relative to the control. Interestingly, oneP-element insertion ingrpshowed a significant
increase of recombination while a differentP-element insertion ingrpshowed a significant
decrease of recombination.
Expression Analysis
While the mutant/RNAi analysis provides insight into whether the candidate genes function in some way to mediate recombination, we also wanted to test whether these candidate genes show significant differences at the allelic level. We hypothesized that the effects of these genes on recombination rate were mediated by expression level differences and thus tested for differ-ences in gene expression in ovaries between allelic variants of our 20 candidate genes. We
Table 3. Summary of Candidate Genes identified during GWAS and selected for functional assessment.We report the number of GWAS the gene was implicated in out of six total. modENCODE expression [100,102,103] is listed as mRNA signal in ovaries (i.e. virgin mRNA signal / mated mRNA signal). FlyAtlas expression [99] is listed as mRNA signal in ovaries as well as whole flies (i.e. ovary mRNA signal / whole fly mRNA signal). mRNA expression from early ovarian tissues [101] is listed as either expression in only‘early’meiosis (germaria to stage 3),‘late’meiosis (remaining ovarioles),‘both’phases, or sig-nificant differential expression (‘DE’) between the early and late.
Candidate Gene
GWAS Number of GWAS
LowestP -value
Largest Effect Size
modENCODE Expression [100,102,103]
FlyAtlas Expression [99]
Early Ovarian Tissues [101]
alph y v 1 2.29E-07 3.44 167 / 181 207 / 222 Both
bru-2 e ro 1 1.14E-05 1.57 2 / 2 2 / 9 Both
cdi e ro 1 9.22E-06 1.63 35 / 26 6/60 Both
CG1273 e ro 1 3.47E-07 2.61 - 3 / 12 Both
CG4440 e ro&y v
6 1.10E-08 3.00 - / 1 2 / 46 Early
CG7196 e ro 3 8.00E-07 3.01 - 2 / 80 Both
CG9650 e ro 1 5.54E-06 2.34 - 12 / 9 Both
CG10864 e ro 1 3.72E-06 2.39 - 5 / 6 Both
CG15365 e ro 1 3.55E-07 2.61 1 / 1 6 / 8 Both
CG33970 y v 1 5.66E-05 2.81 1 / 1 56 / 366 Both
dpr6 e ro&y v
4 9.37E-08 3.09 16 / 15 20 / 13 Both
Eip75B e ro&y v
2 5.98E-06 2.69 4 / 3 115 / 68 Both
grp e ro 1 3.31E-06 -1.10 122 / 110 2137 / 1069 DE
jing e ro 3 4.17E-08 2.79 16 / 17 72 / 26 Both
lola e ro 1 6.13E-08 2.76 130 / 143 112 / 95 DE
MESR3 y v 1 5.90E-06 2.28 16 / 12 197 / 236 Both
Oaz y v 1 8.84E-06 2.68 - 1 / 1 Both
pk e ro 1 7.20E-09 2.92 - 6 / 13 DE
Ptp61F e ro&y v
3 3.36E-08 3.15 91 / 85 928 / 359 DE
Ubx y v 1 4.82E-06 1.53 - 1 / 13 Both
Fig 4. Functional assessment of candidate genes.Recombination rate ofP-element insertions, chromosomal deletions and RNAi lines assayed in the (A) e rointerval and (B)y vinterval. Experimental strains are compared to the control strain (first boxplot in each bracketed set). Boxplots show first to third quartiles with whiskers extending to the smallest and largest nonoutliers. The median is indicated by a black line in each box.*indicates aP<0.05,** indicatesP<0.01 and***indicatesP<0.001 (via Dunnett’s test of recombination proportions).
measured gene expression as mRNA abundance using quantitative RT-PCR (qPCR). For each of our twenty candidate genes, we selected three DGRP lines containing the major allele and
three lines containing the minor allele (S17 Table). For candidate genes that had that multiple
significantly associated variants, all attempts were made to include lines in which all minor
alleles were present. The genotypes of these lines at the gene surveyed can found inS18 Table.
Once a line was selected to assess a candidate gene, it was not used to assess another candidate gene. RNA was extracted from dissected ovaries from virgin DGRP females. The qPCR data
(normalized toGAPDH) reveal significant differential expression for 11 of our 20 candidate
genes (Fig 5;S19 Table). DGRP lines with the major alleles ofCG4440,CG15365,CG33970,
andPtp61F(P<0.003, all comparisons, t-test) display higher expression levels than lines with
the minor alleles. Conversely, DGRP lines with the major alleles ofCG1273,CG10864,dpr6,
Eip75B,lola,Oaz, andUbx(P<0.05, all comparisons, t-test) display lower expression levels than lines with the minor alleles. It should be noted for variants in these eleven candidate genes, all minor alleles are associated with reduced rates of recombination. Comparisons of un-normalized data (given potential concern over unstable housekeeping gene expression
[104,105]) largely confirm these results (S20 Table;S7 Fig).
Fig 5. Assessment of expression difference in ovaries via qPCR.For each candidate gene, the normalized average expression of three lines with the major allele (blue bars) and three lines with the minor allele (red bars) are shown. Error bars denote standard error.*indicates aP<0.05,**indicates
Discussion
Population Level Variation in Recombination Rate
Here we report the largest population-level survey of recombination rate variation in Drosoph-ila to date. We find significant genetic variation for recombination rate in this North American
population ofD.melanogasterfor two independent genomic intervals. At the broadest scope,
these data are consistent with previous work from other systems. Indeed, a wealth of data indi-cate that recombination rate varies between and within populations in species such as Dro-sophila [12,13], mice [23], and humans [5,20,51,106].
The magnitude of population-level variation in recombination rate exposed by our survey
is comparable to what has been previously shown inD.melanogaster. For instance, we
observe 1.67 fold-variation for they vinterval, and previous work in this interval shows
~1.2-fold variation [13,72]. Other genomic regions in Drosophila consistently show 1–2 fold
variation in crossover frequency among strains [13]. Although measured with a different
approach, work from heterogeneous stock mice indicates that crossover frequency varies
~2-fold in both males and females [23]. Work from cattle indicates that average
genome-wide recombination rate varies ~1.7 fold in males [63], which aligns well with our survey.
Similarly, humans show ~2-fold variation in crossover frequency in both males and females [62,107].
It should be noted that the ~2 fold variation in recombination frequency that we report above is biased downward and is not truly reflective of segregating natural variation in recom-bination rate in Drosophila. When we include lines with inversions, which clearly segregate in natural populations, we see a much greater span in recombination rates in the DGRP: 5.2-fold for thee rointerval (excepting lines with an inversion on3R) and 3.5-fold for they vinterval. This range of variation in recombination frequency is remarkable, nearly doubling previous estimates from Drosophila, mouse and humans. However, it also bears mentioning that we cannot exclude that our estimates of recombination may be biased by the weak viability effects associated with our visible markers (see above).
Lack of Correlation between Rates of Crossing over on
3R
and
X
Our results indicate that recombination rate at the two intervals surveyed are uncorrelated in the DGRP. It is certainly possible that the weaker genetic component of phenotypic variation
in recombination rate in thee rointerval as compared to the genetic component of
pheno-typic variation in recombination rate in they vinterval is driving the lack of correlation
between recombination rates in the two intervals. In contrast to what we observe here, previ-ous work in humans showed a significant positive correlation between the number of mater-nal recombination events on individual chromosomes and the number of matermater-nal
recombination events in the remaining genome complement for 20 out of 23 chromosomes, as well as a strong, significant correlation for the first eight chromosomes compared to
chro-mosomes nine through twenty-two and theXchromosome [3]. Other work in Drosophila is
suggestive that two lines with less crossing over in one interval relative to four other lines
generally had less crossing over in other intervals relative to the same four lines [13], though
this is anecdotal at best. The putative difference between Drosophila and humans with regard to correlations in recombination rates across chromosomes is interesting, and may point to different genetic architectures of this trait in these systems. Certainly, the molecular mechan-ics of meiotic recombination have diverged markedly between humans and Drosophila (e.g.
[108]) and the recombinational landscapes in humans and flies are qualitatively different as
Heritability
Previous work has estimated heritability for recombination rate in many different species. While estimates of heritability are necessarily population-specific, mammalian estimates
encompass a wide range, from as small as 0.14 [109] and 0.30 [110] in humans to as large as
0.46 in mice [23]. In maize, heritability of recombination frequency is considerably higher
(broad sense heritability 0.21–0.69; [111]). Insects show a wide range as well, with estimates of
narrow sense heritability of recombination rate ranging from 0.16 in Tribolium [112] to 0.27–
0.49 in grasshoppers [113]. Early estimates of narrow sense heritability of recombination
fre-quency in Drosophila based on parent-offspring regression are comparable to ours (0.09–0.38;
[114]), and selection based approaches yield a narrow sense heritability of 0.12 [79]. That esti-mates of heritability of recombination are low indicates that much of the observed variation in recombination frequency cannot be ascribed to genetic differences along lines. This is consis-tent with the remarkable phenotypic plasticity in recombination frequency in Drosophila, evi-denced in response to temperature [115–122], maternal age [72,115–117,123–133], nutrition [126,127], parasite pressure [134] and other environmental factors. This phenotypic plasticity could also drive the lower than expected correlations between replicates observed in this
exper-iment (seeS3 Table) and also reduce heritability.
Effects of
Wolbachia pipientis
Infection
Wolbachia pipientisis a common endosymbiont that infects the reproductive tissues of many
arthropods [135]. Evidence indicates that over 40% of arthropods are infected withW.pipientis
[136–138]. Approximately 29% of Drosophila stocks from Bloomington Drosophila Stock
Center [139] are infected, along with 76% of theDrosophilaPopulation Genomics Project
(n = 116) [140]. In the DGRP, 108 of 205 (53%) lines are infected withW.pipientis[91]. In Drosophila, there is clear infection in the ovaries [141,142] and infection has been shown to
reduce egg production [143].
Interestingly, we see a significant association between Wolbachia infection and crossover
rates in they vinterval but not in thee rointerval. This discrepancy between the two intervals
surveyed is difficult to explain, and merits further investigation. More curious yet is the con-trast with previous results. It has been shown that Wolbachia infection has no effect on rates of
crossing over in thew ctinterval (18.5 cM) in the laboratory wild-type strain Canton S [144].
Thew ctinterval is actually within they vinterval surveyed in this study, so the discrepancy
between the two studies is puzzling. It may be that the effect of Wolbachia infection on recom-bination frequency is sufficiently minor that the previous study, using a single genetic back-ground and smaller sample sizes than the present study, was underpowered to detect this small effect (an average increase of 1.8 cM associated with Wolbachia infection in our study). Our
results, coupled with previous findings, suggest that W.pipientismight have differential effects
on recombination frequencies in different parts of the genome. Testing explicitly for this het-erogeneity will be a topic of future exploration. In the future, it will also be interesting to see if infecting DGRP lines with Wolbachia causes an increase of crossover rates and if curing DGRP lines via tetracycline yields a corresponding decrease in crossover rates.
Candidate Genes
several variants in the known pigmentation pathway but importantly, also functionally vali-dated seventeen out of twenty-eight candidate genes that had not been previously associated
with pigmentation [145]. Because nothing was known regarding the genetic basis of
popula-tion-level variation in recombination rate in Drosophila and because Drosophila lacks homo-logs of all genes associated with recombination rate variation in other systems, we were eager to leverage this unbiased approach to gain novel insight into the genetic architecture of this fundamentally important trait.
Consistent with the power of GWAS to uncover novel genes associated with phenotypic var-iation, our top candidate genes significantly associated with recombination rate variation con-tain genes outside of the meiotic recombination pathways, which have been characterized in
exquisite detail (see [146] for review). Among the top 20 candidates for functional assessment,
seven are computationally predicted genes that have no clearly defined biological function or
human orthologs. Interestingly, four of our candidate genes have Cys2His2zinc fingers
(CG9650,jing,lola, andOaz). This is particularly intriguing due to the link between the zinc-finger domain containing PRDM9 and hotspot determination, and it is tempting to speculate that these proteins bind to DNA and designate crossover sites in a way that is vaguely
reminis-cent of the role of PRDM9 in mammalian recombination [43–45]. Moreover, theD.
pseudoobs-curaortholog ofOaz,GA14502, was previously identified as a possible candidate gene involved
in recombination as the frequency of its zinc finger binding motif was significantly negatively
associated with recombination on a broad scale [58]. Consistent with a role for zinc-finger
DNA binding in Drosophila recombination, Trem, which also contains zinc fingers, was recently shown to be necessary along with Mei-W68 and Mei-P22 for the formation of
double-strand breaks in Drosophila [147].
We chose two methods for functional assessment of our candidate genes. The first method is a gene-level approach and asks whether perturbation of candidate genes perturbs recombina-tion frequencies. To complement this approach, we also compared expression levels of the dif-ferent alleles in these candidate genes using qPCR. Significant difdif-ferential expression of the major versus minor alleles of our candidate genes in the ovaries would be consistent with gene expression differences underlying differences in rates of crossing over.
Overall, there were 5 genes (bru-2,CG4440,jing,MESR3, andpk) which showed neither a
change in recombination frequency in thee roory vintervals when perturbed nor a difference
in expression level between the major and minor allelic variants. However, lack of functional confirmation does not imply that a candidate gene has no role in modulating recombination rate in Drosophila. Indeed, validation of candidate genes is challenging. The effect sizes of the
genetic variants are moderate at best (S4A and S4B Fig), making detection of these changes
quite difficult in the absence of very large sample sizes. Additionally, recombination rate varia-tion is likely to be a polygenic trait [77,78], and our results confirm this. Further, it has been suggested that in many quantitative traits within the DGRP, there is pervasive epistasis [148,149]. Epistatic interactions may similarly contribute to recombination rate variation in
Drosophila. Consistent with this is the observation that for oneP-element insertion ofgrp,
there is an increase in recombination relative to the appropriate background and a decrease in
recombination rate for anotherP-element insertion (though we note that this observation is
also consistent with variation in allelic effects at a single locus if the twoP-elements were inserted into different locations). Finally, the process of recombination is likely to be highly buffered, and one could hypothesize that there is redundancy for maintaining the number of crossovers required. It is also possible that these statistical associations are false positives due to our lenientP-value.
perturbations in recombination frequency relative to the appropriate genetic background con-trol in addition to differential expression specifically in ovaries between allelic variants at these
loci. These wereCG10864,CG33970,Eip75B,lola, andPtp61F. Two of these (Eip75Band
Ptp61F) were identified in GWAS in both thee roandy vinterval.
CG10864is involved in potassium channel function [150]. In humans, another protein involved in potassium channel function, KCNQ1, has been shown to somatically imprint
regions of the genome with higher rates of recombination [151]. While imprinting appears to
be less common in Drosophila females [152], it is unclear if CG10864 is participating in a
simi-lar role as compared to KCNQ1.
CG33970is predicted to be involved with ATP binding and transporter activity [98]. A direct link between ATP binding and meiotic recombination has yet to be shown, but there have been some hints of connections in the literature. For example, mutations in the ATP-binding domain ofRecA[153] inEscherichia coli,DMC1[154],Rad51andRad55in yeast [155,156] andXRCC3
in humans [157] cause defects in homologous recombination and meiosis. While speculative,
this gives credence to the idea that the putative ATP-binding ability ofCG33970may contribute
to meiotic recombination. Further work is aimed at dissecting this link.
Eip75B(Ecdysone-induced protein 75B) is involved in mediating ecdysone signaling, a ste-roid hormone. Defective ecdysone signaling affects the early germarium, causing defects with meiotic entry [158]. Interestingly, ecdysone signaling is important for female fertility but not
for male fertility [159–161]. Drosophila males do not undergo meiotic recombination
[162,163]. It remains to be seen whether the connection between recombination, fertility and
ecdysone signaling is merely coincidence; however, the role ofEip75Bin oogenesis makes it a
particularly exciting candidate for further work.
lola, orlongitudinals lacking, is BTB zinc finger-containing transcription factor that is
required for axon growth and guidance [164,165]. As noted above, DNA binding ability along
with zinc fingers is exciting as a possible link with recombination. The predicted human ortho-log,ZBTB46orBZEL, was shown to repress a desumoylase [166]. Sumoylation has been linked to DNA repair [167] and therefore it is possible thatlolais involved in early processes that could ultimately lead to crossover formation.
Ptp61F(Protein tyrosine phosphatase 61F) is a member of the protein tyrosine phosphatase
family.Ptp61Fis an induced antagonist of the JAK/STAT pathway [168,169] and has been
directly implicated in oogenesis [170]. In the female germline, expression ofPtp61Fis targeted
to the nucleus and cytoplasmic organelles [171] and this gene is required for normal female
fecundity [172]. Tentative links betweenPtp61Fand DNA damage can be made in mammals;
Ptp61Fis the Drosophila homolog of humanPTP1Band knockoutPTP1Bmice show a higher sensitivity to irradiation and an upregulation of many genes in the DNA excision/repair
path-way [173]. Homologous recombination, base excision repair, and nucleotide excision repair are
the primary pathways by with DNA damage are repaired in Drosophila. While the role for Ptp61Fin meiotic recombination is not obvious, the clear function of this gene in oogenesis coupled with its tentative connection to DNA damage repair is promising.
Conclusion
In conclusion, we have quantified the extent of recombination rate variation in a natural
popu-lation ofD.melanogasterand have shown that genetic background significantly drives
Wolbachia infection can significantly increase rates of recombination. Through our GWA approach, we show that recombination rate is a highly polygenic trait, with many genetic fac-tors of small effect associating with phenotypic variation. We show that a subset of our
candi-date genes (CG10864,CG33970,Eip75B,lola, andPtp61F) play putative roles in modulating
recombination rate variation in Drosophila through both gene-level and expression-level func-tional assessment. Future work will be aimed at determining the role of these candidate genes in the molecular process of recombination.
Materials and Methods
Fly Stocks
TheDrosophilaGenetic Reference Panel is a collection of 205 fully-sequenced inbred lines
[90,91]. Mated, gravidDrosophila melanogasterfemales were originally collected in Raleigh,
NC, USA in 2003. Their progeny were subjected to 20 generations of full-sibling matings. The resulting inbred lines were then fully sequenced. A total of 4,853,802 single nucleotide
poly-morphisms (SNPs) and 1,296,080 non-SNP variants were identified among these lines [91].
To assay recombination rate, we took advantage of visible, recessive markers inD.
melano-gaster. To measure recombination rates on the3Rchromosome, we used a strain marked with ebony(e4) andrough(ro1); these markers are 20.4 cM apart [95]. To measure recombination
on theXchromosome, we used a strain marked withyellow(y1) andvermillion(v1); these
markers are 33 cM apart [94]. These markers were chosen to examine due to the genetic
dis-tance between them, ease of scoring and also their apparent lack of viability defects [94,95]. Each of the doubly marked chromosomes was substituted into a wild-type isogenic Samarkand
genetic background, free ofP-elements [174], to allow for continuity between assays and to
minimize marker genetic background effects.
Recombination Rate Assay
To assay recombination rate variation in the DGRP, we used a classic two-step crossing scheme (Fig 1). All crosses were executed at 25°C with a 12:12 hour light:dark cycle on standard media using virgin females aged roughly 24 hours. We conducted three replicate assays for each inter-val (eithere roory v). For each replicate, all 205 lines were crossed simultaneously to avoid conflating block effects with variation among lines. This yielded three replicate estimates of recombination frequency per line per interval. For the first cross, ten virgin females from every
DGRP line were crossed to ten doubly-marked males (eithere roory v) in eight ounce bottles.
Males and females were allowed to mate for five days, after which all adults were cleared from
the bottles. F1females resulting from this cross are doubly heterozygous; these females are the
individuals in which recombination is occurring. To uncover these recombination events we
backcross F1females to doubly-marked males. For this second cross, twenty heterozygous
vir-gin females were collected and backcrossed to twenty doubly-marked males. Males and females were allowed to mate for five days, after which all adults were cleared from the bottles. After
eighteen days, BC1progeny were collected, frozen, and scored for sex and for visible
pheno-types. Previous work in our lab has demonstrated that freezing flies has no effect on the visible markers we scored. Recombinant progeny were then identified as having only one visible
marker (m1+ or +m2). For each replicate, recombination rates were estimated by taking the
Inversions
Freeze 2 of the DGRP contains information relating to 16 segregating autosomal inversions
verified by cytological methods [91]. We therefore performed association mapping in three
dif-ferent ways for each interval. TheXchromosome (in this population of flies) lacks inversions
while 49 lines contain an inversion on chromosome arm3Rwhich spans at least part of thee ro
interval used to assay recombination rate [98]. We thus completely exclude these lines when
analyzing recombination rate data for the3Rinterval. The three datasets used for the3R
analy-ses were: 1) lines with no inversion on3R(n = 156), 2) lines with neither3Rinversions nor
inversion polymorphisms elsewhere in the genome (n = 130), and 3) lines with the standard
karyotype (n = 112). The three datasets used for theXchromosome analyses were: 1) all lines
(n = 205), 2) lines without inversion polymorphisms (n = 152) and 3) lines with a standard kar-yotype (n = 112).
Statistical and Quantitative Genetic Analyses
To estimate the broad-sense heritability (H2) of recombination rate, we used an ANOVA
framework on line means (the average across the three replicates for each line for each
inter-val). The ANOVA followed the form ofY=μ+L+for each chromosome assayed whereYis
recombination rate,μis the overall mean,Lis the random effect of line andis the residual.
Additionally, we ran a similar ANOVA, adding the genomic region as a fixed factor, to test for a significant interaction between line and genomic region. That ANOVA followed the form of
Y=μ+L+R+L×R+, with the terms the same as above andRis the genomic region
assayed. To estimateH2, we follow the formulaH2=σ2L/ (σ2L+σ2) whereσ
2
Lis the variance
component among lines andσ2is the residual variance or variance component attributed to
error. The variance components were calculated using REML. AllH2estimates were calculated
using R Statistical Software, v3.2.1 and RStudio v0.99.467.
To test for a significant effect of Wolbachia infection, we used an ANOVA framework as
well. The ANOVA follows the formY=μ+W+for each chromosome assayed whereYis
recombination rate (measured in cM),μis the overall mean,Wis fixed effect of Wolbachia
infection status andis the residual, including all individual measurements.
Genome-Wide Association
To identify genetic variants that are associated with differences in mean crossover number in two different intervals of the Drosophila genome, we performed a GWAS using the established
web-based pipeline developed by the Mackay lab at NC State University, Raleigh, NC (http://
dgrp2.gnets.ncsu.edu/) [90,91]. The first step in conducting the GWAS was to adjust line
means for the effects ofWolbachia pipientisinfection as well as the presence of inversions that
are segregating in the DGRP. The adjusted line means are then used to fit a linear mixed
model,Y=Xb+Zu+e.Yis the adjusted phenotypic value,Xis the design matrix for the fixed
variant effectb,Zis the incidence matrix for the random polygenic effectuandeis the residual. The vector of polygenic effectsuhas a covariance matrix in the form ofAσ2, whereσ2is the
polygenic variance component andAis the genomic relatedness. Additionally, Manhattan
plots were constructed using the qqman package in R [175].
Functional Assessment of Candidate Genes
—
Recombination Rate
Assay
P-value of the variant located within or near the gene, effect size of the variant, the number of GWAS that a variant within or near the gene was implicated in and available expression data. To functionally explore these candidate genes with respect to their roles in recombination, we
took advantage of availableP-element insertion lines and chromosomal deletions as well as
RNAi lines (S21 Table). Lines containing aP-element insertion or chromosomal deletion
(delet-ing the candidate gene) as well as appropriate controls (genetic background used to generateP
-element insertion or chromosomal deletion) were used in the same crossing scheme (Fig 1)
detailed above. For the first cross, ten virgin females from every line containing aP-element
insertion or chromosomal deletion were crossed to ten doubly-marked males (eithere roory v)
in eight oz. bottles. Males and females were allowed to mate for five days, after which all adults were cleared from the bottles. For the second cross, ten virgin heterozygous females were col-lected and backcrossed to ten doubly-marked males in vials. Males and females were allowed to
mate for five days, after which all adults were cleared from vials. BC1progeny were collected
from each vial, frozen, and scored for sex and for visible phenotypes. For eachP-element
inser-tion or chromosomal deleinser-tion, there were 30 replicates. For each replicate, recombinainser-tion rates were estimated by taking the ratio of recombinant progeny to the total number of progeny.
The RNAi lines followed an identical crossing scheme except for the males used in the F0
cross. These males contained the doubly-marked chromosome (e ro) along withnanos GAL4
driver [176,177].nanosis expressed throughout Drosophila oogenesis [178]. AllP-element
insertions, chromosomal deletions or RNAi lines were compared to appropriate controls using
Dunnett’s Test [179,180] using both the raw recombination proportions as well as arcsined
transformed data. Statistics were performed in JMP Pro 11.2.0.
Functional Assessment of Candidate Genes
—
Expression Analysis
To test the hypothesis that gene expression differences between alleles drive phenotypic varia-tion in recombinavaria-tion rate, we analyzed ovarian mRNA abundance differences between the major and minor allele for each of our 20 candidate genes using quantitative RT-PCR (qPCR). For each candidate gene, three DGRP lines containing the major allele and three DGRP linescontaining the minor allele were chosen (S17 Table). For the eight genes that had multiple
sig-nificant genetic variants associated within the gene region, DGRP lines that contained the most
major/minor alleles were selected (S18 Table). For each candidate gene, virgin females were
collected from the six DGRP lines contemporaneously to minimize the effects of environmen-tal variation. Females were aged three days in vials with ~0.5 mL of yeast paste. Ovaries were then dissected from anesthetized females in a solution of 1X PBS and stored in Life Technolo-gies RNAlater solution (Life TechnoloTechnolo-gies). For each line, four replicates of ten pairs of ovaries were dissected. Total RNA was extracted from homogenized ovaries using Trizol (Life
Tech-nologies) following manufacturer’s instructions. cDNA was generated using Bio-Rad iScript
cDNA Synthesis and following manufacturer’s instructions. Primers for candidate genes were
generated using FlyPrimerBank [181] (S22 Table). qPCR was run a BioRad CFX384 machine
using Bio-Rad iQ SYBR Green following manufacturer's instructions. Four technical replicates for each sample were run on the same 384 plate, minimizing the contribution of between plate variation.
Samples were analyzed usingGAPDHfor normalization due to its relatively consistent
expression [182]. For each candidate gene, there were six lines analyzed, three that contained
the major allele and three that contained the minor allele identified in our GWAS. For each line, we collected four biological replicates of RNA. We ran four technical replicates of each RNA sample (converted to cDNA). Therefore, for each line, there are a total of 16 qPCR
control. Measurements from each DGRP line were normalized by dividing by the average Cq
value ofGAPDHfor the corresponding DGRP line, modeled after common normalization
pro-cedures [183]. These 96 measurements (48 measurements for the major allele and 48
measure-ments for the minor allele) were then analyzed by comparing the means of the lines containing the major allele to the means of the lines containing the minor allele via a students t-test using JMP Pro 11.2.0. In addition, the raw Cq values (before normalization) were also analyzed to
ensure that potential differentialGAPDHexpression was not biasing results.
Supporting Information
S1 Text. Further discussion of the interchromosomal effect and correlations between recombination rate and other available DGRP phenotypes.
(PDF)
S1 Fig. Natural variation in recombination rate.Variation in crossover frequency in the all
lines of the DGRP in (A) thee rointerval on chromosome3Rand (B) they vinterval on theX
chromosome. The lines for each panel are ordered by recombination rate. Error bars depict
standard error. For reference, the reported map distance for thee rointerval is 20.4 cM, while
the reported map distance for they vinterval is 33 cM, denoted by a horizontal line in both
graphs. (TIF)
S2 Fig. Scatterplots between replicates and averages.Scatterplots showing pairwise relation-ships between replicates as well as between each replicate and the overall average for the (A-F)
e roand (G-L)y vintervals. Spearman’s rho values for all comparisons are included inS3
Table. (TIF)
S3 Fig. Venn diagram of variants uncovered from GWAS.Overlap of significantly associated genetic variants from the three different data sets for each chromosomal interval assayed. (TIF)
S4 Fig. Distribution of effect sizes.Distribution of combined effect sizes for the (A)e roand
(B)y vintervals from all GWA analyses.
(TIF)
S5 Fig. Genome-wide association analyses.Results are depicted for (A) all lines (excluding those with3Rinversions) for thee rointerval and (B) all lines for they vinterval. A significance
threshold ofP10−5is displayed with a horizontal line. Brackets within the Manhattan plot
highlight the chromosomal interval assayed. The triangular heat map displays the amount of
linkage disequilibrium (LD, measured here asr2) between variants. Each major chromosome is
depicted. Red denotes complete LD and blue denotes absence of LD. (TIF)
S6 Fig. Genome-wide association analyses.Results are depicted for (A) lines excluding those
with3Rinversions and/or polymorphic inversions for thee rointerval and (B) lines excluding
those with polymorphic inversions for they vinterval. A significance threshold ofP10−5is
displayed. Brackets within the Manhattan plot highlight the chromosomal interval assayed. The triangular heat map displays the amount of linkage disequilibrium (LD, measured here as
r2) between variants. Each major chromosome is depicted. Red denotes complete LD and blue
S7 Fig. Assessment of expression difference in ovaries via qPCR.For each candidate gene, the raw (before normalization) average expression of three lines with major allele (blue bars)
and three lines with minor allele (red bars) are shown. Error bars denote standard error.
indi-cates aP<0.05,indicatesP<0.01 andindicatesP<0.001. (TIF)
S1 Table. Robustness of data.Raw counts, expected numbers andG-testP-values for number
of males versus females, number of wild-type progeny versus doubly marked individuals (m1
m2), and number of recombinant progeny (either +m2orm1+).
(XLSX)
S2 Table. Recombination rate data for DGRP lines.Three replicates and average (in cM;
used for GWA analysis) for both intervals (e roandy v) are included along with inversion
sta-tus [91].and Wolbachia status of each line [91]. (XLSX)
S3 Table. Correlation between replicates.Spearman's rho values for correlations between rep-licates as well as between each replicate and the overall average for thee roandy vintervals. (XLSX)
S4 Table. ANOVA model.ANOVA testing for the effects of Line, Interval, and the interaction of the two. % is the percentage of variance explained by factor.
(XLSX)
S5 Table. Correlation between replicates.Spearman's rho values for correlations between rep-licates as well as between each replicate and the overall average for thee roandy vintervals. (XLSX)
S6 Table. Genome-wide association analyses for recombination rate.Results from GWA on
e rodata set including all DGRP lines (except those containing an inversion on3R).
(XLSX)
S7 Table. Genome-wide association analyses for recombination rate.Results from GWA on
e rodata set excluding DGRP lines with an inversion on3Ror any polymorphic inversions.
(XLSX)
S8 Table. Genome-wide association analyses for recombination rate.Results from GWA on
e rodata set of DGRP lines only with standard karyotypes.
(XLSX)
S9 Table. Genome-wide association analyses for recombination rate.Results from GWA on
y vdata set including all DGRP lines.
(XLSX)
S10 Table. Genome-wide association analyses for recombination rate.Results from GWA
ony vdata set excluding DGRP lines with any polymorphic inversions.
(XLSX)
S11 Table. Genome-wide association analyses for recombination rate.Results from GWA
ony vdata set of DGRP lines only with standard karyotypes.
(XLSX)
S12 Table. Description of variants.Breakdown of genetic variants identified in 6 GWAS (see
S6andS11Tables).
S13 Table. Genetic variants from GWA.List of significantly associated genetic variants within
candidate genes with correspondingP-value.
(XLSX)
S14 Table. Genotypes of DGRP lines.Genotype of each DGRP line at each significantly asso-ciated genetic variant within candidate genes surveyed.
(XLSX)
S15 Table. Functional assessment results in thee rointerval.Raw counts from gene-level assessment in thee rointerval.
(XLSX)
S16 Table. Functional assessment results in they vinterval.Raw counts from gene-level
assessment in they vinterval.
(XLSX)
S17 Table. DGRP lines used for qPCR expression analysis.List of DGRP lines selected for each candidate gene for qPCR expression analysis.
(XLSX)
S18 Table. Genotypes of DGRP lines used for qPCR.Genotype of DGRP lines selected for qPCR expression analysis at respective gene of choice.
(XLSX)
S19 Table. qPCR expression data.Cq values from qPCR expression analysis, normalized to
GAPDH expression. Lines 1–3 for the major and minor allele correspond to lines inS17 Table.
(XLSX)
S20 Table. qPCR expression data before normalization.Cq values from qPCR expression
analysis. Lines 1–3 for the major and minor allele correspond to lines inS17 Table.
(XLSX)
S21 Table. Genotypes ofP-element insertions, chromosomal deletions and RNAi lines. Lines used for functional assessment.
(XLSX)
S22 Table. Primers used for qPCR.Forward and reverse primers of candidate genes for qPCR expression analysis.
(XLSX)
S23 Table. Correlation with DGRP phenotypes.Spearman’s rank correlation for crossover
rates in thee roandy vintervals (using only standard karyotypes) compared to other DGRP
published phenotypes. Sources of data are listed both within the main text as well as in the chart. Significant correlations are in bold.
(XLSX)
Acknowledgments
The authors gratefully acknowledge Aki Yamamoto for crossing the markers into the
Samar-kand genetic background and Kathryn Kohl for integrating thenanos GAL4driver into the
appropriate genetic backgrounds. The authors also acknowledge Stephen Gilene, Savannah
Jackson, Amy Kelly, Haylee McLean, and Kaitlyn O’Shea for assistance with scoring and